
Presenting data in a clear and engaging manner is crucial for effective communication. Traditional methods, such as tables and spreadsheets, are useful for organizing data, but they often fail to capture the audience’s attention due to their lack of visual appeal. Data visualization addresses this limitation by transforming mundane data into engaging and insightful visuals that are both informative and aesthetically pleasing.
By employing various techniques, including bar charts, infographics, interactive dashboards, storytelling, data visualization tools, data animation, and data art, data presentation can be elevated from dull to dynamic, facilitating the audience’s understanding and interpretation of complex information.
Key Takeaways
- Bar charts can transform dull data into engaging visuals, making it easier for audiences to understand and interpret the information.
- Infographics use creative design to bring data to life, making it more visually appealing and easier to digest.
- Interactive dashboards make data presentation dynamic and user-friendly, allowing users to explore and interact with the information.
- Storytelling with data involves crafting compelling narratives through visualization, making the data more relatable and impactful.
- Data visualization tools enhance presentations with advanced technology, allowing for more sophisticated and interactive data displays.
Bar Charts: Transforming Data into Engaging Visuals
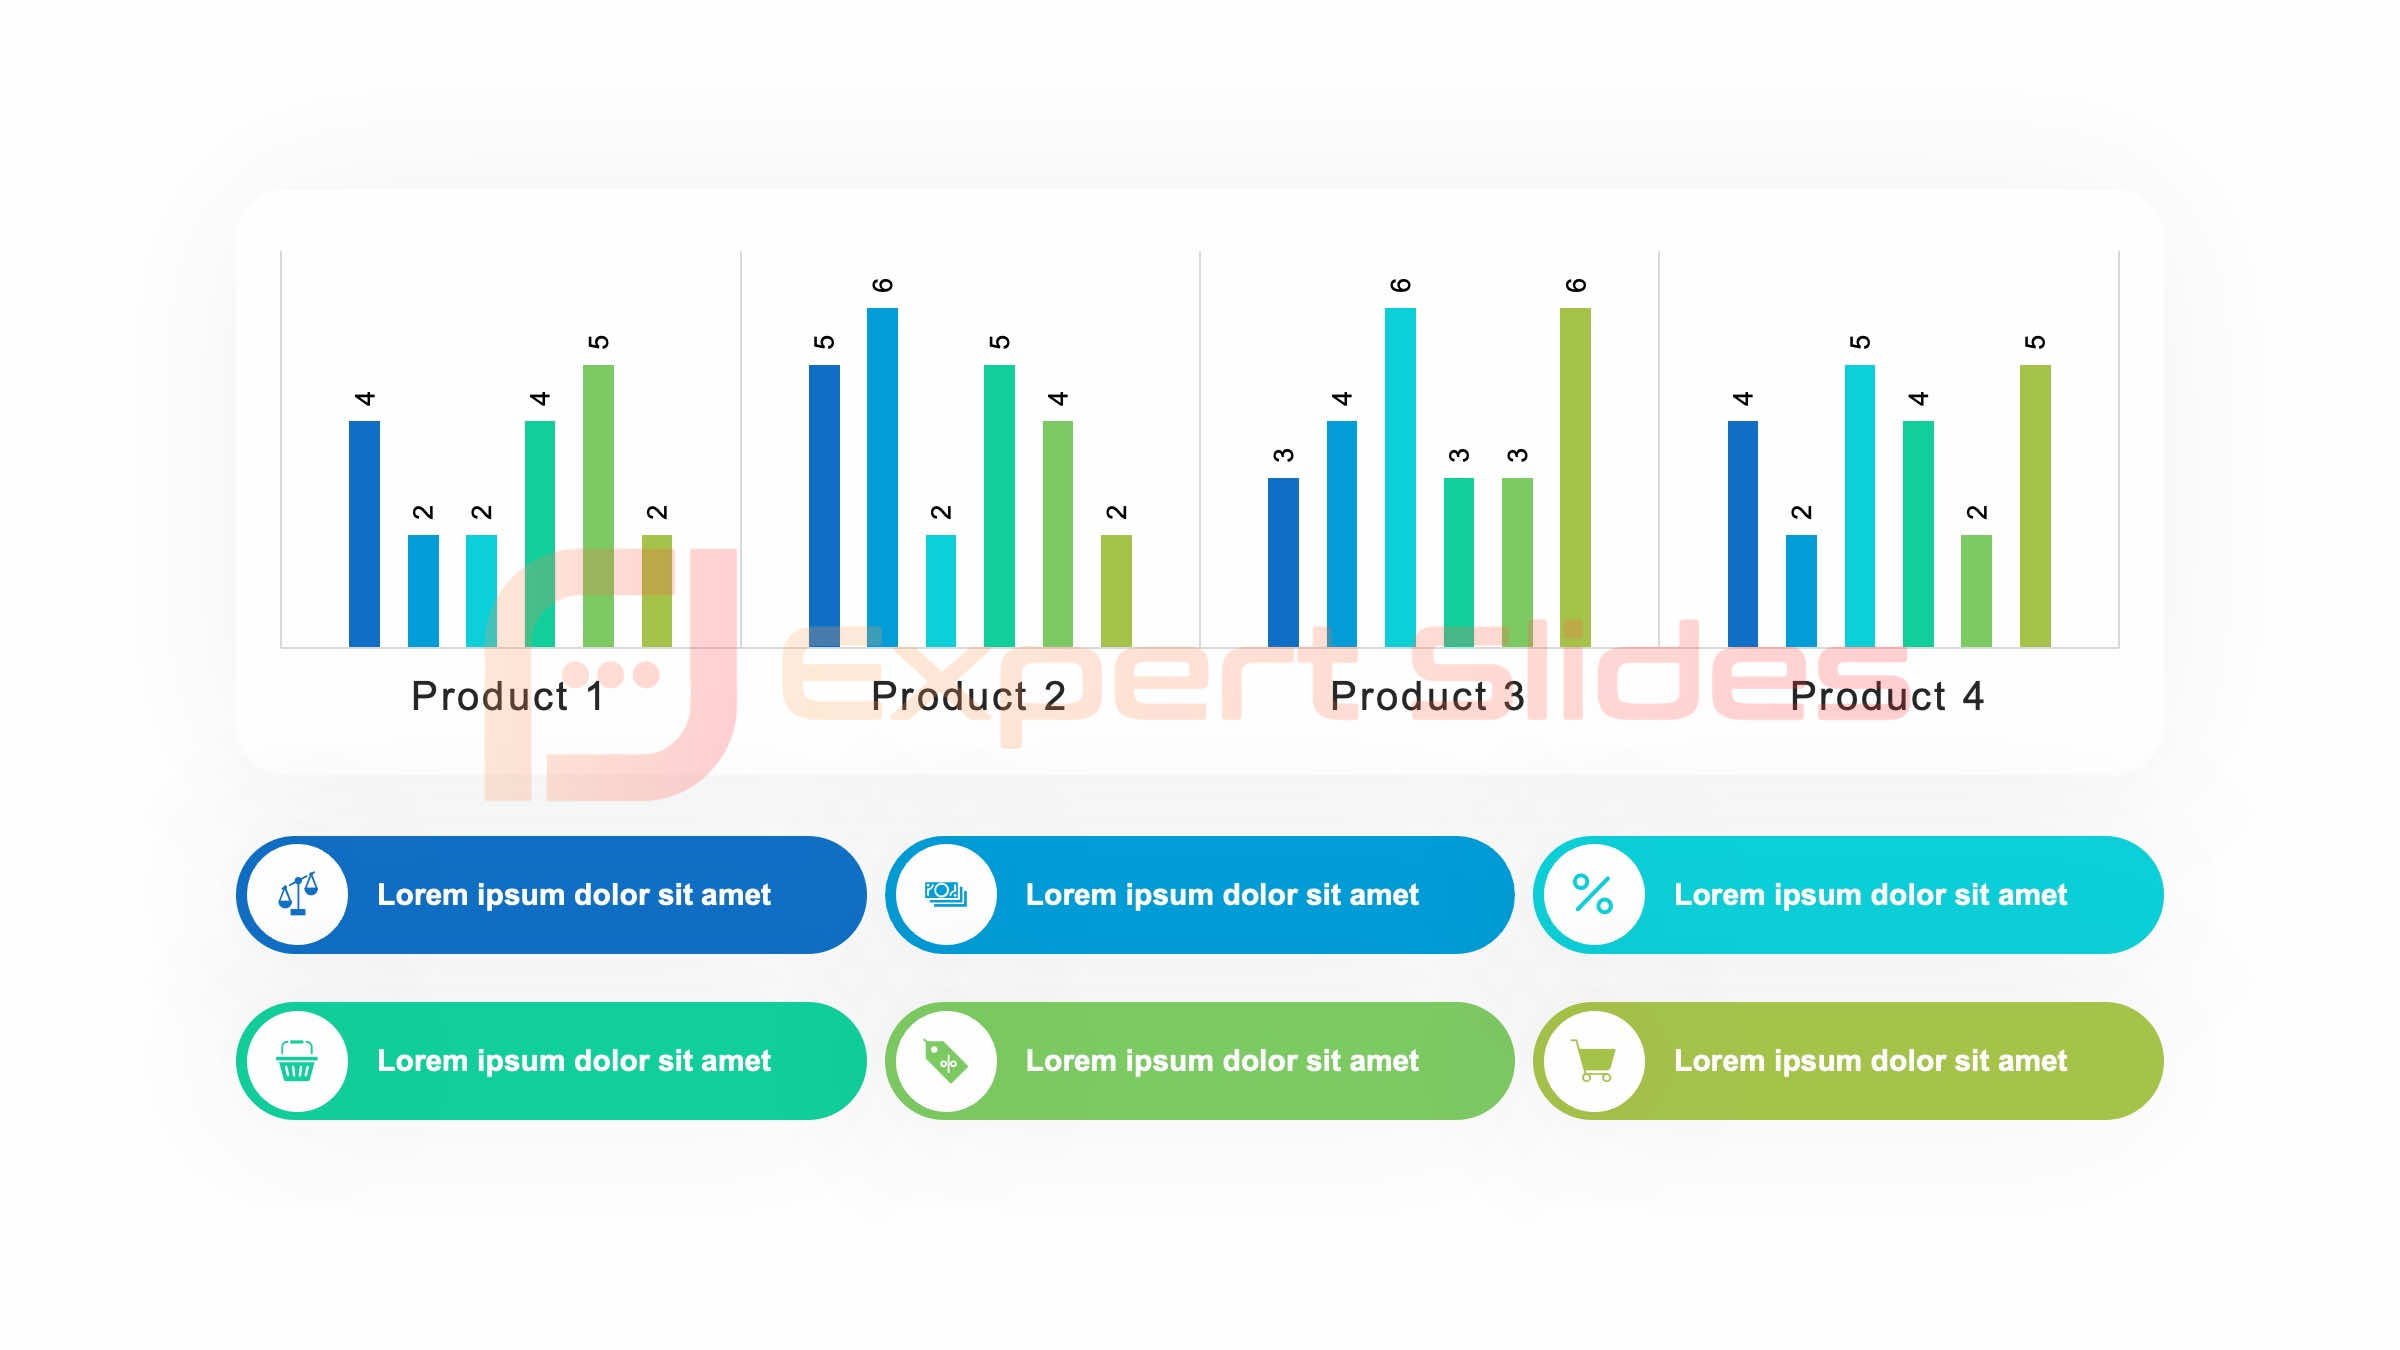
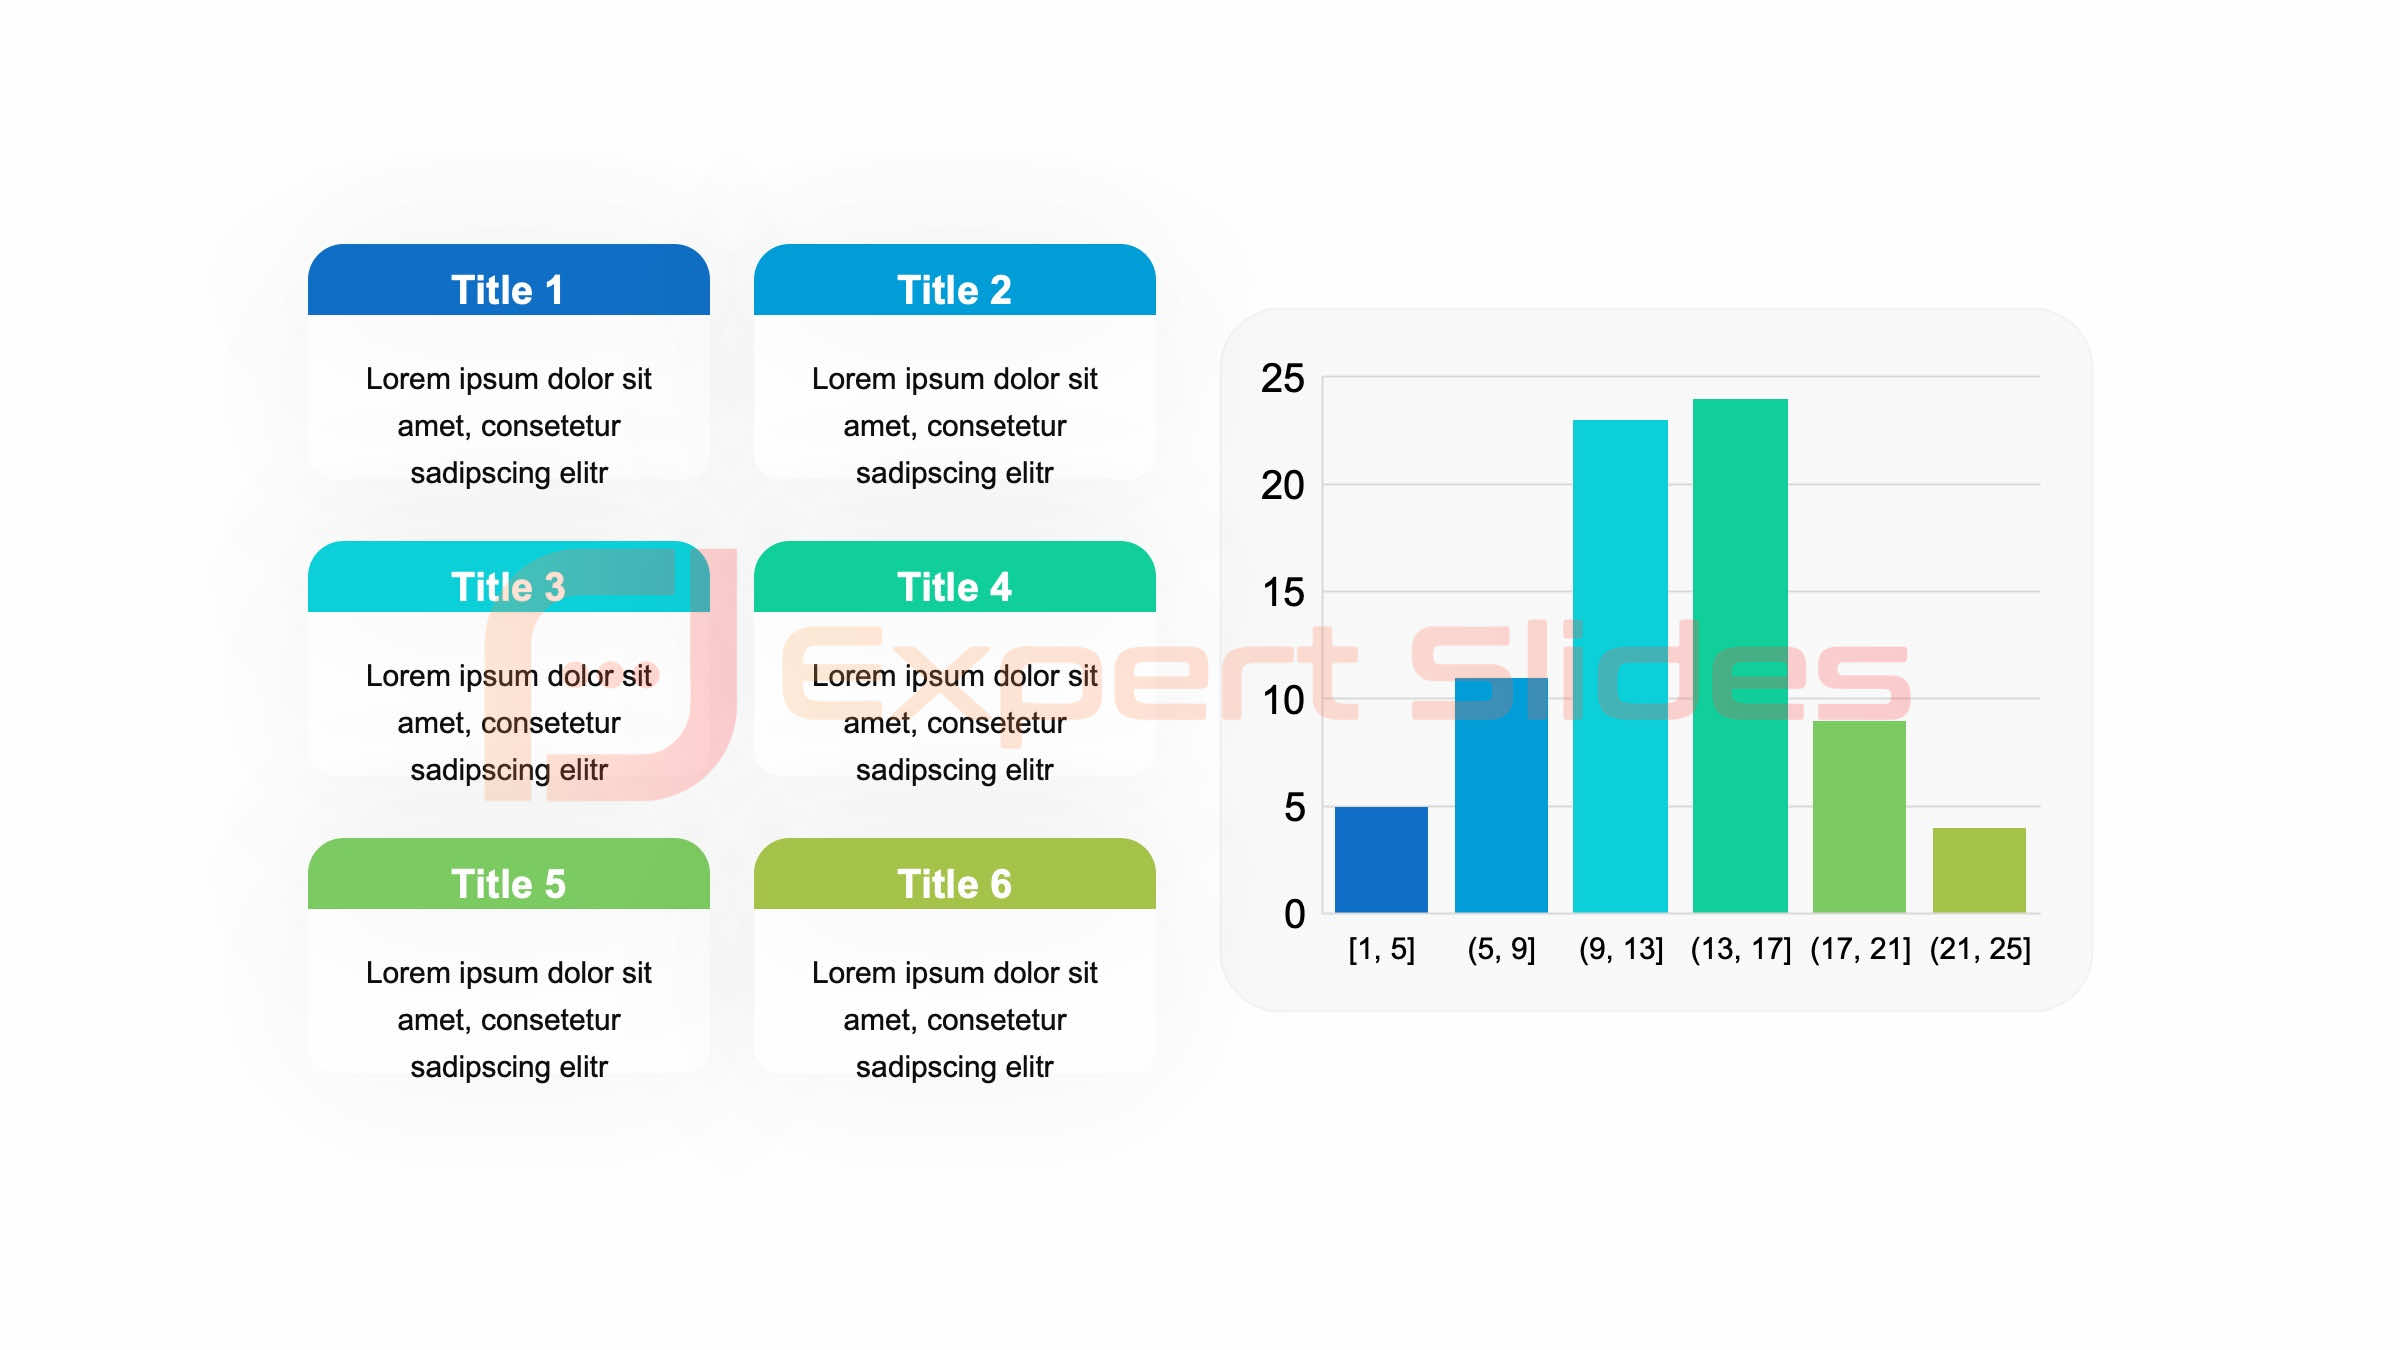 Easy Data Comparison
For instance, a bar chart can be used to show the sales performance of different products over a specific period, enabling the audience to rapidly identify the best-performing products and trends.
Enhancing Data Visualization
Moreover, bar charts can be enhanced with color coding and annotations to further highlight key insights and make the data more engaging. This transformation of raw data into a visually appealing format makes bar charts an excellent tool for turning dull statistics into captivating visuals that are both informative and aesthetically pleasing.
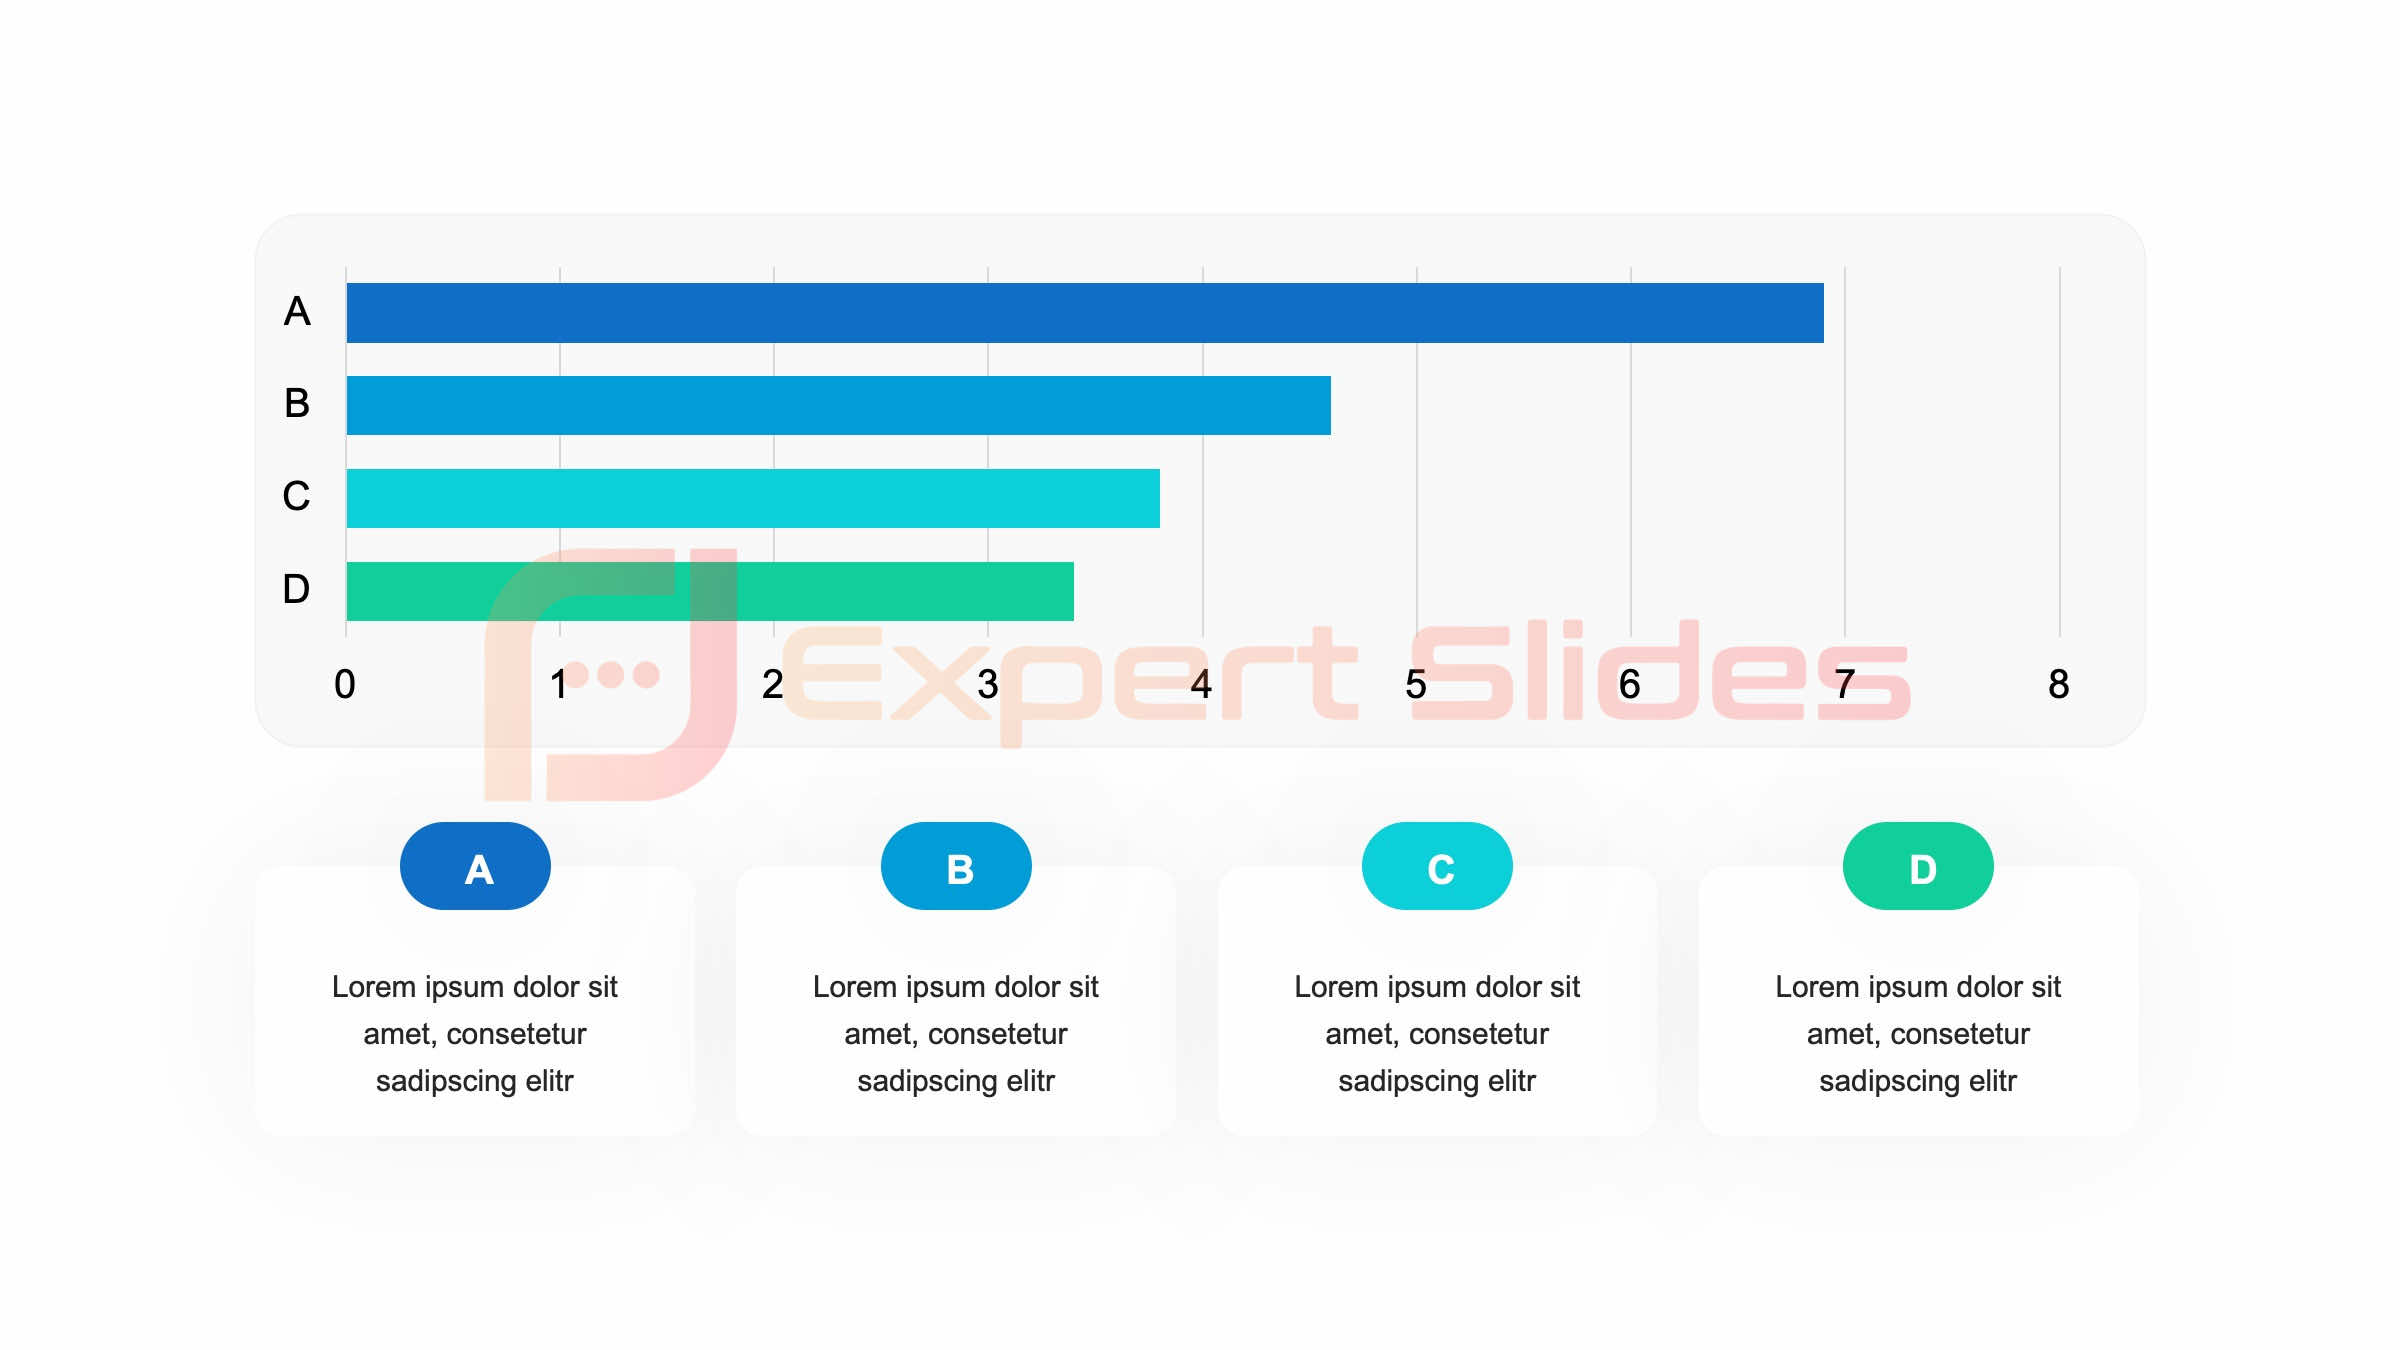
Unlocking Data Insights
By presenting data in a clear and concise manner, bar charts facilitate the discovery of hidden patterns and trends, enabling users to make informed decisions and drive business growth.
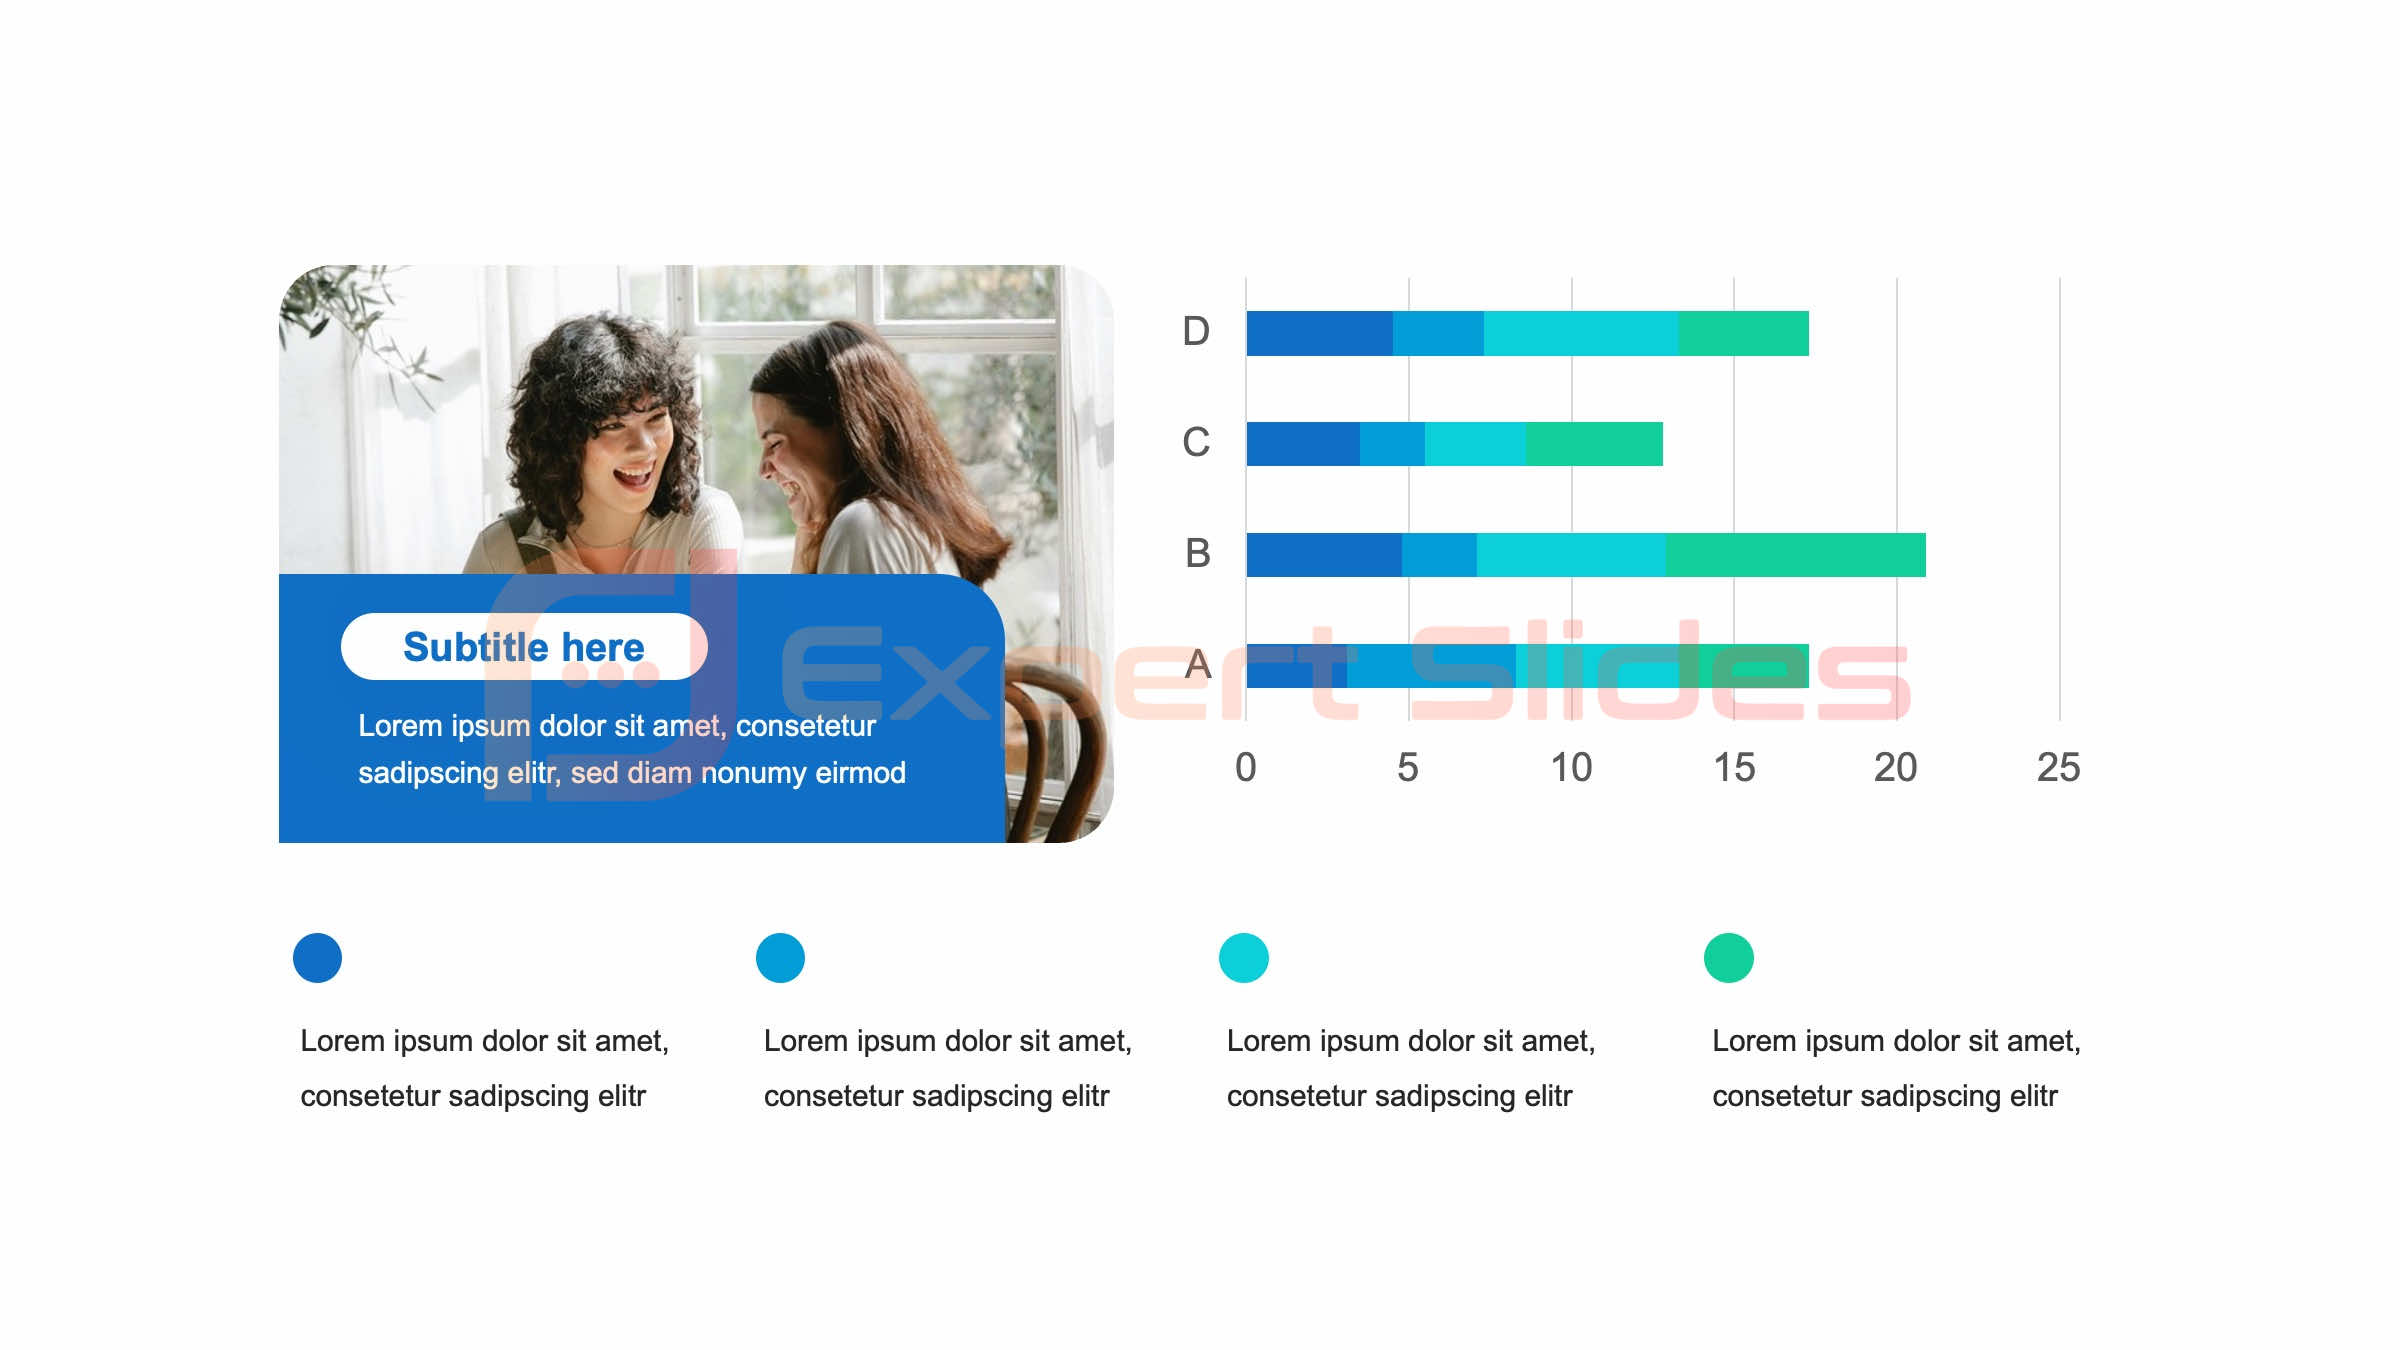
Infographics: Bringing Data to Life with Creative Design
 Infographics are a powerful tool for bringing data to life with creative design. By combining text, images, and graphics, infographics can transform complex data into visually appealing and easy-to-understand visuals that are both informative and engaging. For example, an infographic can be used to present survey results in a visually appealing format, using icons, charts, and illustrations to convey key insights and trends.
Additionally, infographics can be customized with creative design elements such as color schemes, typography, and layout to make the data more visually appealing and memorable. By leveraging creative design techniques, infographics have the power to turn boring data into brilliant visuals that captivate the audience and make complex information more accessible.
Interactive Dashboards: Making Data Presentation Dynamic and User-Friendly
| Example | Engagement Level | Effectiveness |
|---|---|---|
| Bar Chart | High | High |
| Pie Chart | Medium | Low |
| Infographic | High | High |
| Data Visualization | High | High |
Interactive dashboards are a game-changer in the world of data presentation, making it dynamic and user-friendly. By allowing users to interact with the data through filters, sliders, and drill-down capabilities, interactive dashboards enable audiences to explore and analyze data in a personalized and intuitive manner. For example, a sales dashboard can be designed to allow users to filter data by region, product category, or time period, enabling them to gain deeper insights and make informed decisions.
Additionally, interactive dashboards can be enhanced with dynamic visualizations such as maps, charts, and graphs that update in real-time as users interact with the data. By making data presentation dynamic and user-friendly, interactive dashboards have the power to transform boring statistics into brilliant visuals that engage and empower the audience.
Storytelling with Data: Crafting Compelling Narratives through Visualization
Storytelling with data is a powerful technique for crafting compelling narratives through visualization. By combining data with storytelling elements such as characters, plot, and conflict, data visualization can be used to create a narrative that captivates the audience and conveys key insights in a memorable and impactful way. For example, a data visualization can be used to tell the story of a company’s growth over time, using visual elements such as timelines, milestones, and achievements to illustrate key turning points and successes.
Additionally, storytelling with data can be enhanced with creative techniques such as animation, interactivity, and multimedia to further engage the audience and bring the narrative to life. By crafting compelling narratives through visualization, storytelling with data has the power to turn boring statistics into brilliant stories that resonate with the audience and drive meaningful action.
Data Visualization Tools: Enhancing Presentation with Advanced Technology
 Creating Interactive Visualizations
For example, a business analyst can use Tableau to create interactive dashboards that allow users to explore sales performance by region, product category, or customer segment in real-time.
Advanced Features for Deeper Insights
Additionally, data visualization tools offer advanced features such as predictive analytics, machine learning, and natural language processing that enable presenters to uncover deeper insights and trends within the data.
Transforming Data into Brilliant Visuals
By enhancing presentation with advanced technology, data visualization tools have the power to transform boring statistics into brilliant visuals that are both insightful and impactful.
Data Animation: Adding Movement and Impact to Statistical Information
Data animation is a powerful technique for adding movement and impact to statistical information. By using animation techniques such as transitions, effects, and motion graphics, data presenters can bring static charts and graphs to life in a dynamic and engaging manner. For example, a data animation can be used to visualize the growth of a company’s revenue over time, using animated elements such as line charts, bar graphs, and pie charts to illustrate key trends and fluctuations.
Additionally, data animation can be enhanced with interactive elements such as tooltips, hover effects, and click-through capabilities that enable users to explore the data in a personalized and intuitive manner. By adding movement and impact to statistical information, data animation has the power to turn boring statistics into brilliant visuals that captivate the audience and make complex information more accessible.
Data Art: Turning Numbers and Figures into Aesthetic Masterpieces
 Data art is a creative approach to turning numbers and figures into aesthetic masterpieces. By combining artistic elements such as color theory, composition, and visual storytelling with statistical information, data art can transform boring data into visually stunning visuals that are both informative and visually appealing. For example, a data artist can use abstract shapes, patterns, and textures to represent complex datasets in a visually striking and memorable way.
Additionally, data art can be customized with creative techniques such as mixed media, collage, and digital illustration to create unique and captivating visuals that resonate with the audience. By turning numbers and figures into aesthetic masterpieces, data art has the power to elevate data presentation from mundane to magnificent, making it easier for audiences to understand and interpret complex information. In conclusion, data presentation examples can be transformed from boring to brilliant by leveraging various techniques such as bar charts, infographics, interactive dashboards, storytelling with data, data visualization tools, data animation, and data art.
By utilizing these techniques effectively, presenters can create visually appealing visuals that are both informative and engaging, making it easier for audiences to understand complex information in a memorable and impactful way. Whether it’s through dynamic visualizations or creative design elements, there are countless ways to elevate data presentation from mundane to magnificent, turning boring statistics into brilliant visuals that captivate the audience and drive meaningful action.
FAQs
What are some common data presentation examples?
Some common data presentation examples include bar graphs, line graphs, pie charts, tables, infographics, and dashboards.
How can data presentation be improved from boring to brilliant?
Data presentation can be improved from boring to brilliant by using visually appealing design elements, incorporating storytelling techniques, using interactive features, and focusing on the most important data points.
What are some tips for creating effective data presentations?
Some tips for creating effective data presentations include choosing the right type of visualization for the data, simplifying complex information, using consistent and clear labeling, and incorporating visual hierarchy to guide the viewer’s attention.
What are some tools for creating visually appealing data presentations?
Some tools for creating visually appealing data presentations include Microsoft Excel, Tableau, Google Data Studio, Adobe Illustrator, and Canva.
How can data presentations be made more engaging for the audience?
Data presentations can be made more engaging for the audience by incorporating interactive elements, using storytelling techniques to create a narrative, and focusing on the practical implications of the data.


