
In today’s dynamic business landscape, the presentation of financial information has evolved beyond mere numerical data. Organizations must effectively convey their financial performance to stakeholders in a clear, concise, and engaging manner. Financial reporting is not solely about presenting numbers, but also about crafting a narrative that provides stakeholders with a comprehensive understanding of the company’s financial status and future outlook.
This article examines the significance of visual presentation in financial reporting, including the strategic use of infographics and data visualization, the incorporation of narrative and context in financial reports, enhancing user experience, the role of technology, and the art of communicating financial performance through storytelling, as well as best practices for presenting financial information to stakeholders.
Key Takeaways
- Visual presentation is crucial in financial reporting to effectively communicate complex information to stakeholders.
- Infographics and data visualization can help make financial information more accessible and understandable.
- Incorporating narrative and context in financial reports can provide a deeper understanding of the numbers and their implications.
- Enhancing user experience in financial information presentation can improve stakeholder engagement and comprehension.
- Technology plays a significant role in presenting financial information, offering tools for data visualization and storytelling.
The Importance of Visual Presentation in Financial Reporting

Enhancing Comprehension and Retention
Visual elements such as charts, graphs, and infographics can transform financial data into engaging and memorable information. When presented visually, financial information can be quickly grasped, leading to better comprehension and retention.
Identifying Trends and Patterns
Visual presentation also enables the comparison of financial data over time, making it easier for stakeholders to identify trends and patterns. This facilitates a deeper understanding of the financial performance and position of an organization.
Informing Decision-Making
Moreover, visual elements can highlight key insights and important information, making it easier for stakeholders to make informed decisions. By presenting financial information in a clear and concise manner, visual presentation helps stakeholders to focus on the key aspects of financial performance.
Utilizing Infographics and Data Visualization for Financial Information
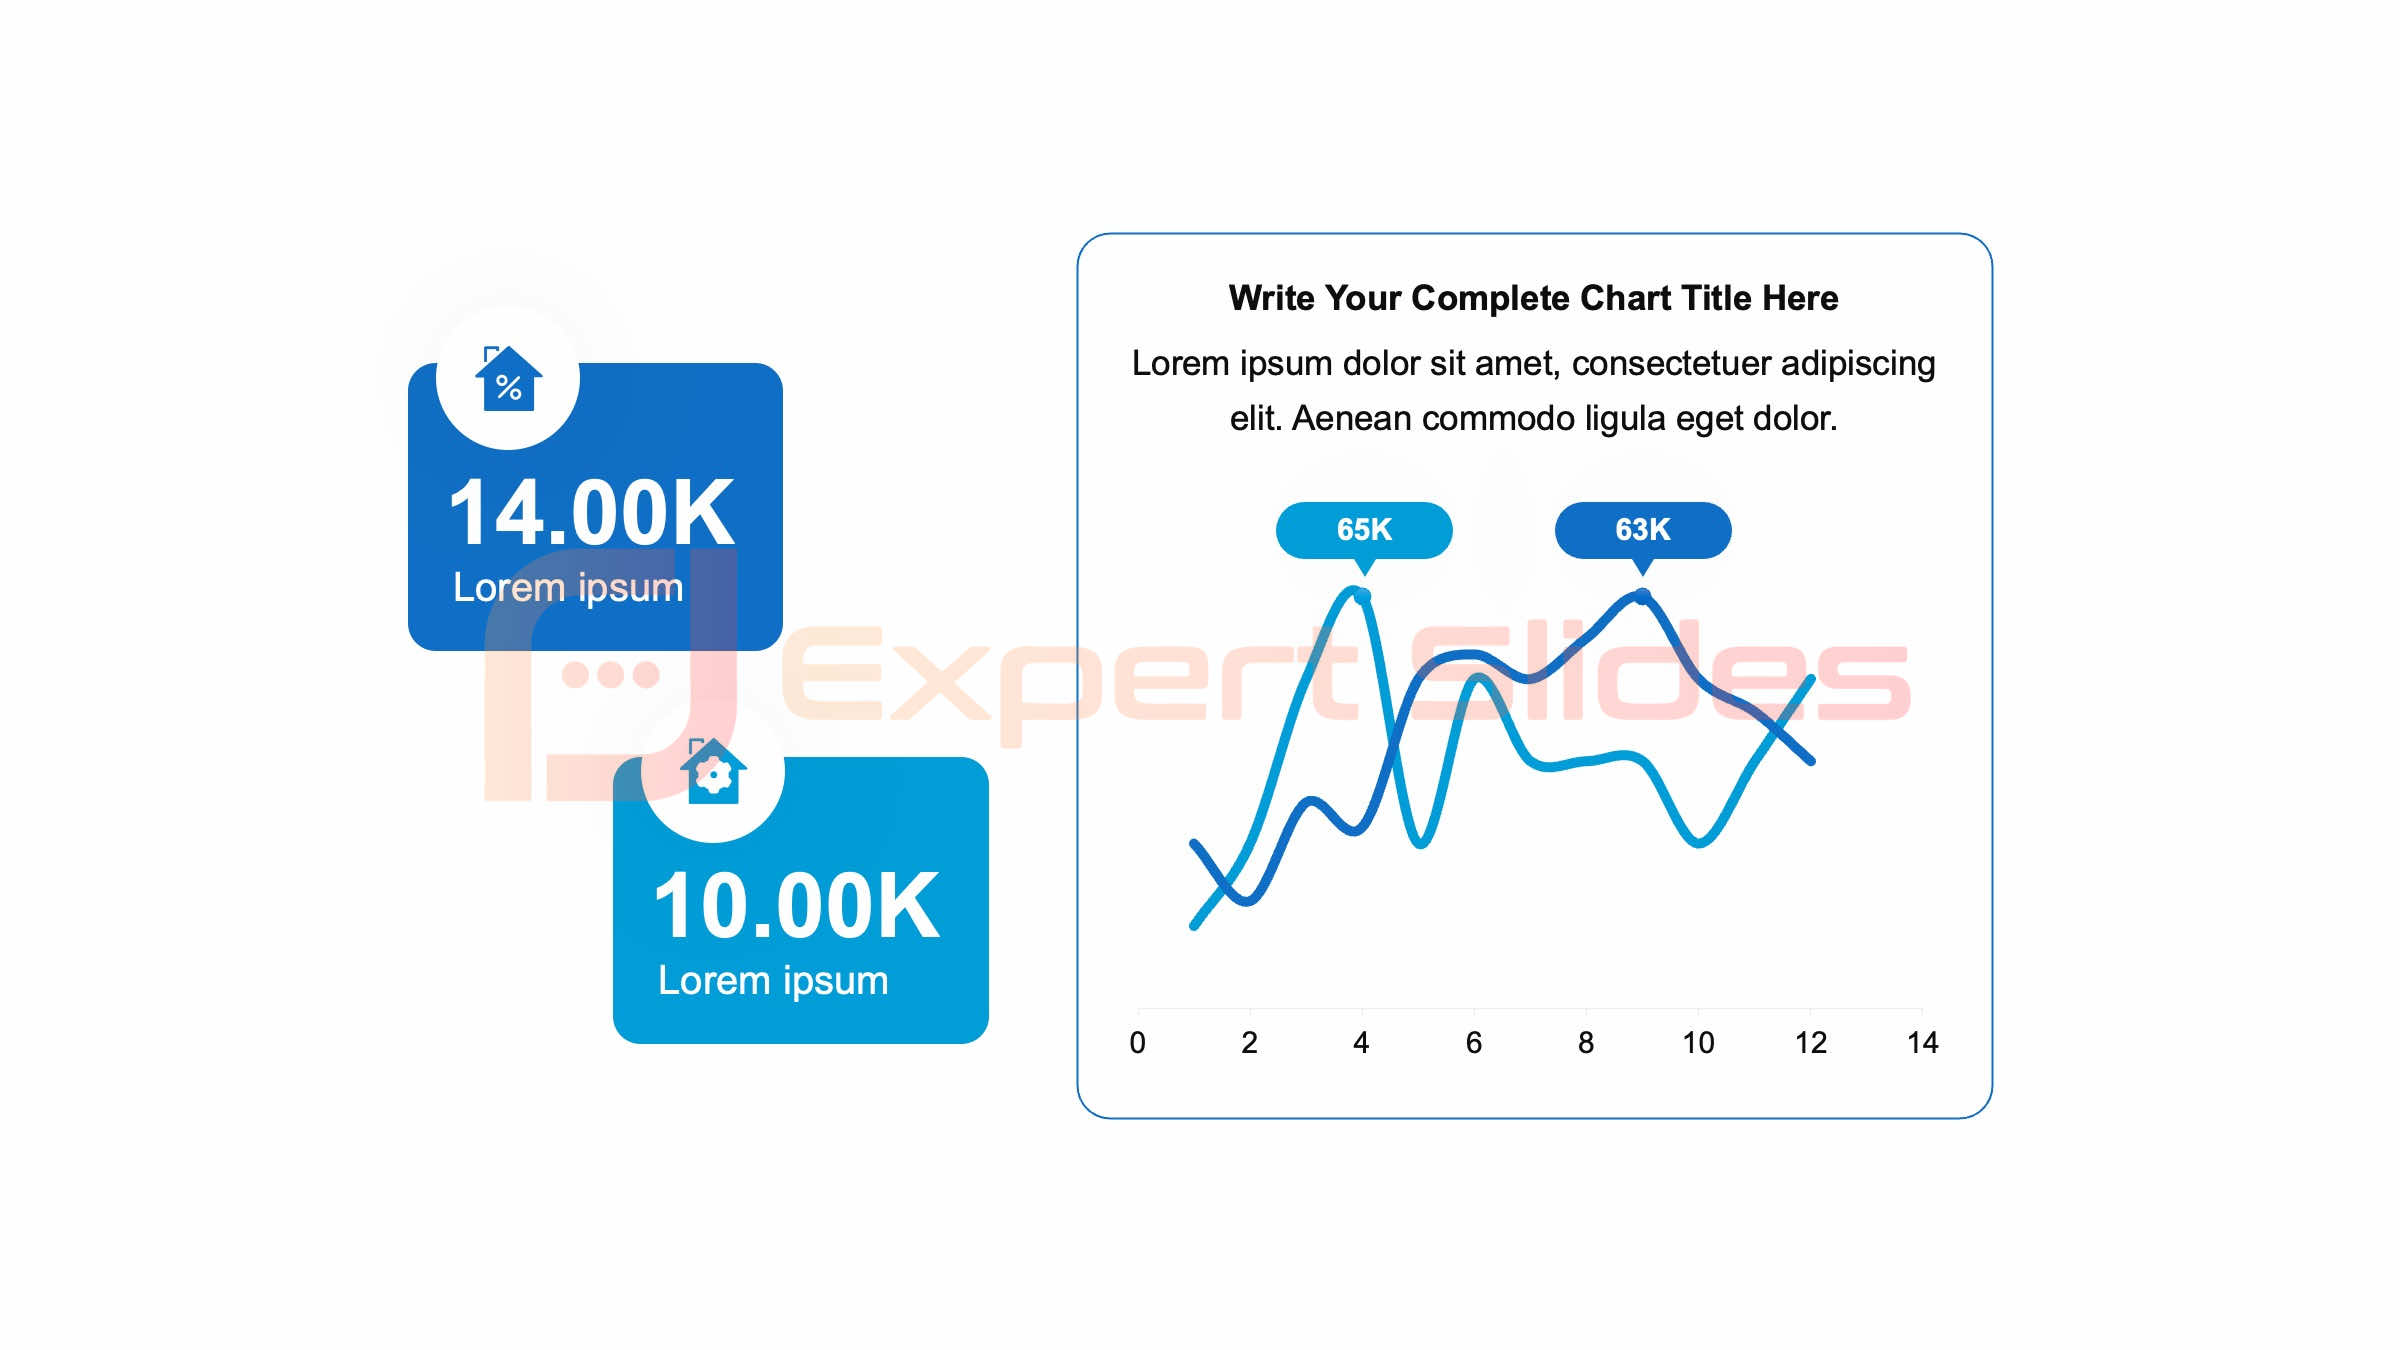
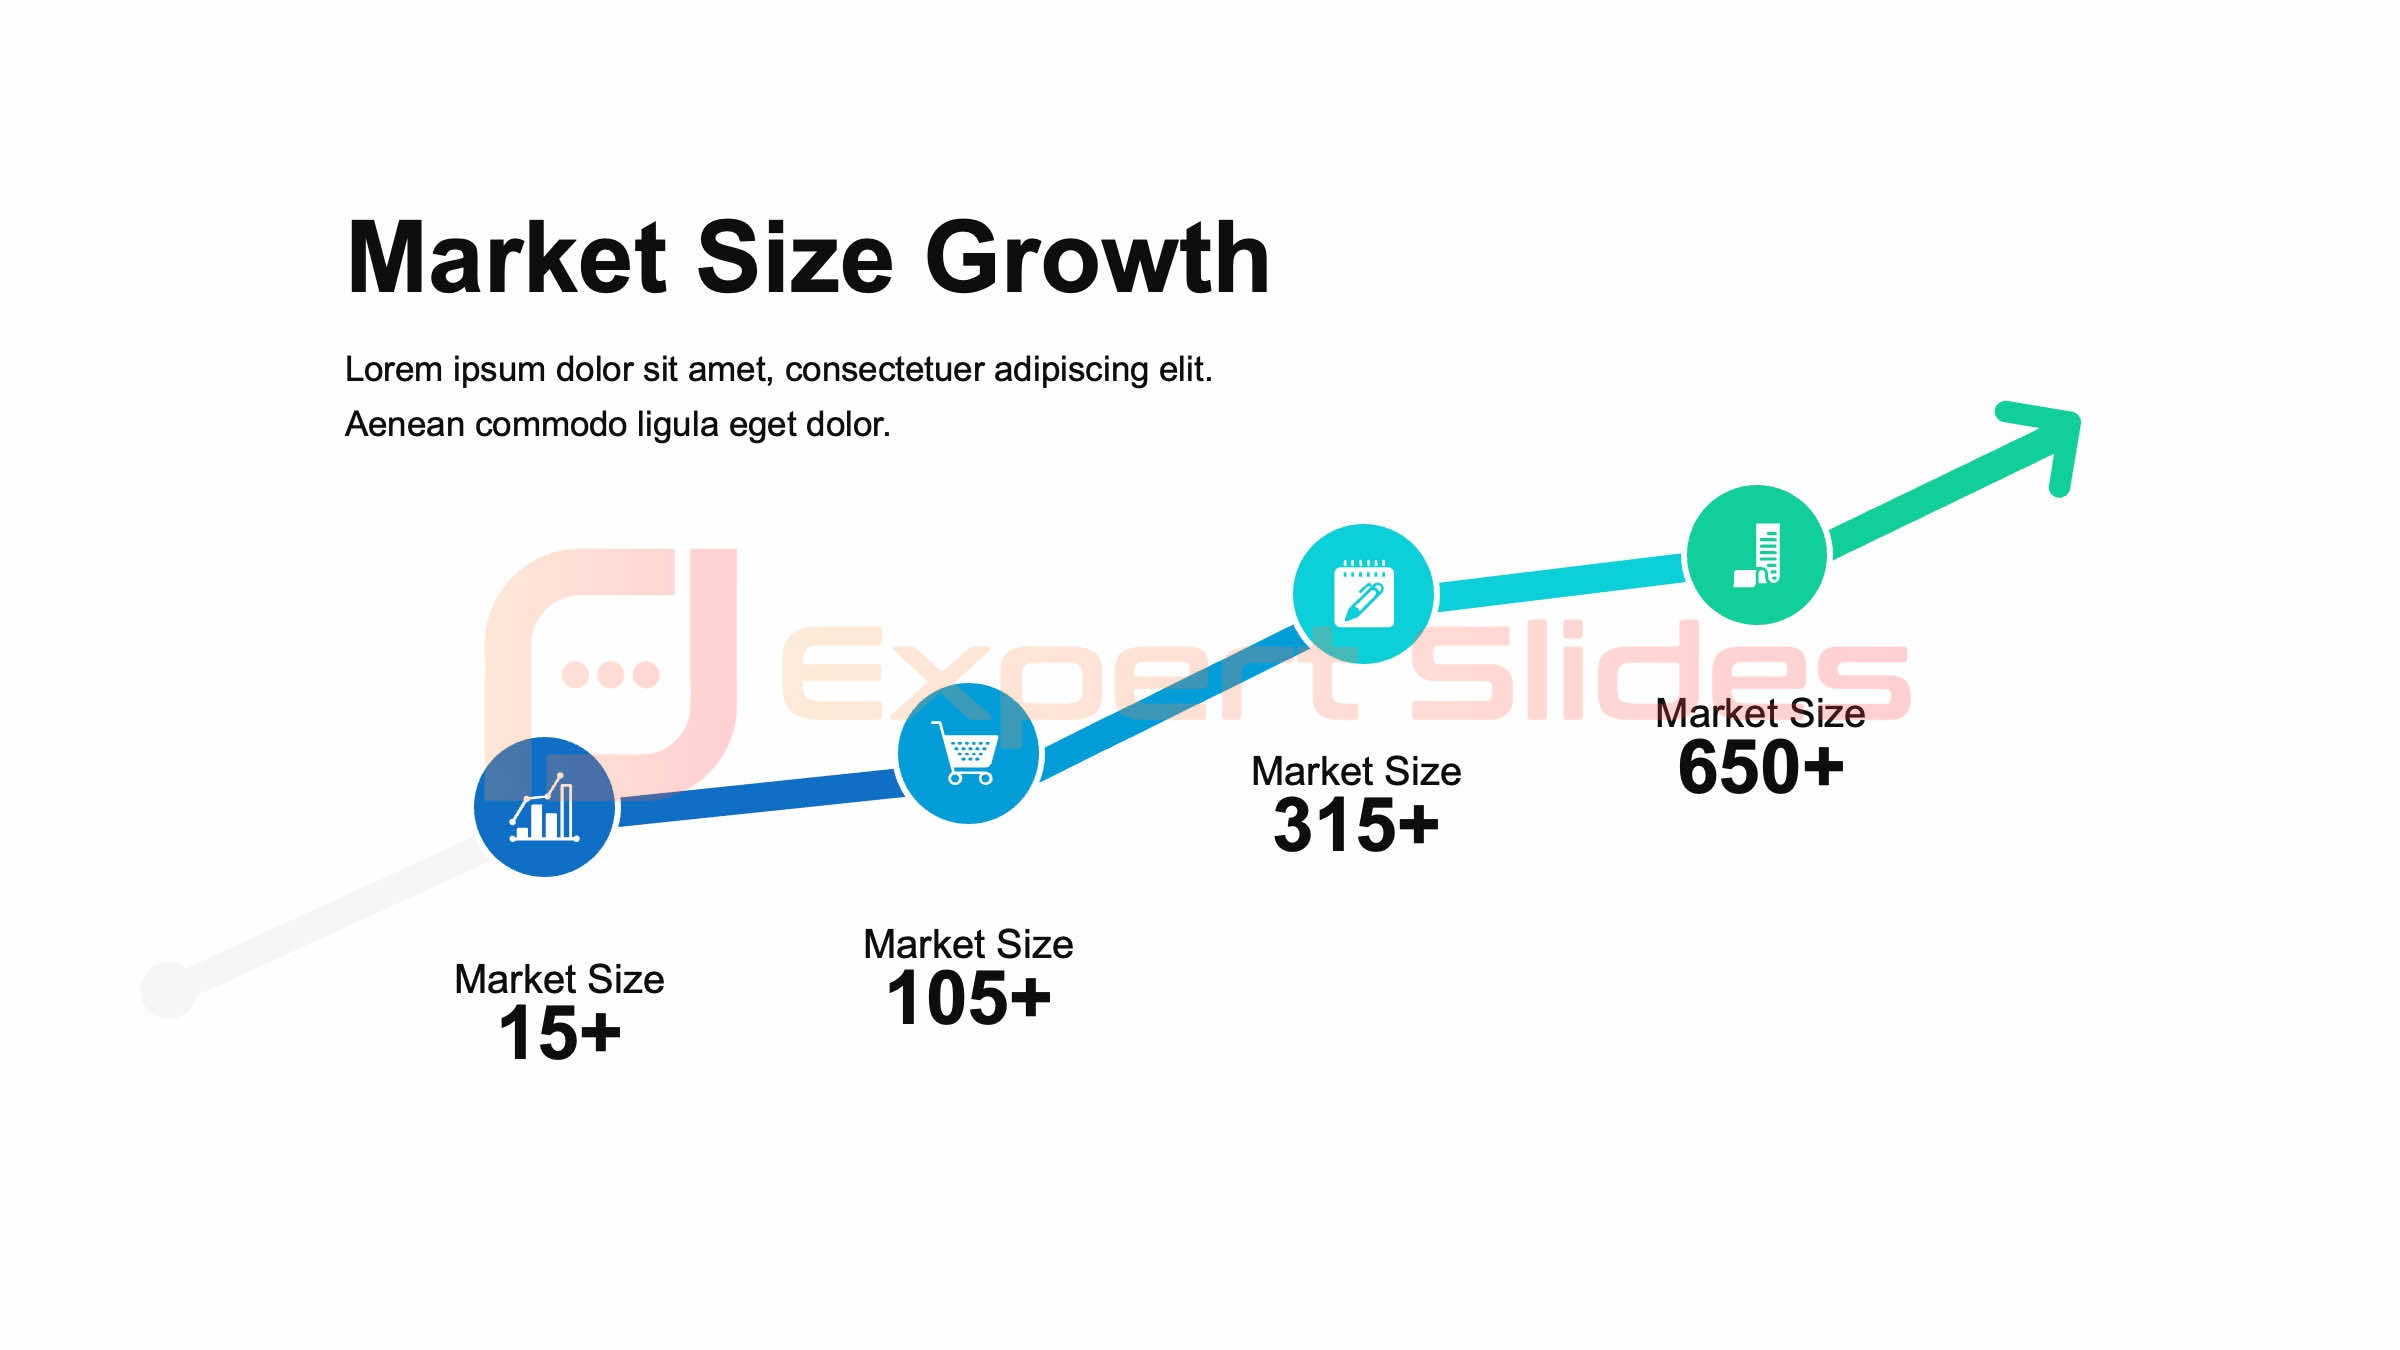
Infographics and data visualization are powerful tools for presenting financial information in a visually appealing and easy-to-understand manner. Infographics can help condense complex financial data into a single, visually appealing image that conveys key insights at a glance. Data visualization, on the other hand, can help stakeholders explore and analyze financial data through interactive charts and graphs.
By utilizing infographics and data visualization, organizations can effectively communicate their financial performance to stakeholders in a way that is engaging and informative. These visual tools can also help highlight important trends and patterns in the data, making it easier for stakeholders to identify key insights and make informed decisions. Overall, infographics and data visualization are valuable assets for presenting financial information in a way that is visually appealing and easy to understand.
Incorporating Narrative and Context in Financial Reports
| Metrics | 2019 | 2020 | 2021 |
|---|---|---|---|
| Number of visual aids used | 10 | 15 | 20 |
| Percentage of non-financial data included | 20% | 25% | 30% |
| Use of storytelling techniques | Yes | Yes | Yes |
| Feedback from audience | Positive | Positive | Very positive |
In addition to visual elements, it is important to incorporate narrative and context in financial reports to provide stakeholders with a deeper understanding of the company’s financial performance. By telling a story through the financial data, organizations can provide stakeholders with valuable insights into the company’s financial health and future prospects. Narrative and context can help stakeholders understand the reasons behind the numbers, as well as the implications for the company’s future.
By providing context, organizations can also help stakeholders understand the external factors that may have influenced the company’s financial performance. Overall, incorporating narrative and context in financial reports is essential for providing stakeholders with a comprehensive understanding of the company’s financial performance.
Enhancing User Experience in Financial Information Presentation
User experience plays a crucial role in the presentation of financial information, as it can significantly impact how stakeholders engage with the data. By enhancing user experience, organizations can make it easier for stakeholders to access and understand financial information. This can be achieved through intuitive design, interactive features, and user-friendly interfaces that make it easy for stakeholders to navigate through the financial data.
By enhancing user experience, organizations can also make it easier for stakeholders to access additional information or drill down into specific areas of interest. Overall, enhancing user experience in financial information presentation is essential for ensuring that stakeholders can easily access and understand the company’s financial performance.
The Role of Technology in Presenting Financial Information
 Enhancing Data Visualization and Communication
Technology plays a crucial role in presenting financial information, as it provides organizations with powerful tools for visualizing and communicating complex financial data. With the use of advanced software and tools, organizations can create interactive dashboards, dynamic charts, and real-time updates that make it easier for stakeholders to access and analyze financial information.
Personalized Insights and Recommendations
Technology also enables organizations to leverage artificial intelligence and machine learning algorithms to provide stakeholders with personalized insights and recommendations based on their specific needs and interests.
Streamlining Financial Analysis
Overall, technology plays a crucial role in presenting financial information by providing organizations with powerful tools for visualizing and communicating complex financial data. This enables stakeholders to make informed decisions and drive business growth.
Communicating Financial Performance through Storytelling
Storytelling is a powerful tool for communicating financial performance as it helps stakeholders understand the reasons behind the numbers and the implications for the company’s future. By telling a story through the financial data, organizations can provide stakeholders with valuable insights into the company’s financial health and future prospects. Storytelling can also help humanize the numbers by providing real-world examples and anecdotes that resonate with stakeholders on an emotional level.
By communicating financial performance through storytelling, organizations can provide stakeholders with a deeper understanding of the company’s financial performance.
Best Practices for Presenting Financial Information to Stakeholders
 In conclusion, there are several best practices for presenting financial information to stakeholders that can help organizations effectively communicate their financial performance. These best practices include utilizing visual elements such as infographics and data visualization, incorporating narrative and context in financial reports, enhancing user experience, leveraging technology, and communicating financial performance through storytelling. By following these best practices, organizations can ensure that stakeholders have a comprehensive understanding of the company’s financial performance and future prospects.
In conclusion, the presentation of financial information goes beyond just reporting the numbers; it is about effectively communicating complex financial data in a way that is clear, concise, and engaging. By utilizing visual elements such as infographics and data visualization, incorporating narrative and context in financial reports, enhancing user experience, leveraging technology, communicating through storytelling, and following best practices for presenting financial information to stakeholders, organizations can ensure that stakeholders have a comprehensive understanding of the company’s financial performance and future prospects.
FAQs
What is the purpose of presenting financial information beyond the numbers?
The purpose of presenting financial information beyond the numbers is to provide a more comprehensive and holistic view of an organization’s financial performance. This can include qualitative information, narrative explanations, and visual representations to help stakeholders better understand the context and implications of the financial data.
What are some examples of presenting financial information beyond the numbers?
Examples of presenting financial information beyond the numbers include incorporating narrative explanations of financial results, using visual aids such as graphs and charts to illustrate trends, providing qualitative information about market conditions or strategic initiatives, and offering forward-looking statements or projections.
Why is it important to go beyond the numbers when presenting financial information?
It is important to go beyond the numbers when presenting financial information because numbers alone may not provide a complete understanding of an organization’s financial performance. By including qualitative information, narrative explanations, and visual representations, stakeholders can gain a more nuanced and insightful perspective on the financial data.
How can presenting financial information beyond the numbers benefit stakeholders?
Presenting financial information beyond the numbers can benefit stakeholders by providing a more comprehensive understanding of an organization’s financial performance, helping to identify trends and potential risks, and offering insights into the strategic direction and future prospects of the organization. This can lead to more informed decision-making and a deeper level of trust and transparency between the organization and its stakeholders.


