
Author: POWERPOINT UNIVERSITY
If you want to make a striking, modern slide that communicates percentage data with impact, this step‑by‑step guide will walk you through creating an animated 3D pie‑chart design in PowerPoint. I’ll show you how to build a floating platform, assemble the 3D pie pieces using shapes, style everything with gradients and lighting, add 3D text, and finally animate the whole composition so it presents smoothly. The techniques used here are fully editable and flexible — perfect for dashboards, marketing reports, traffic metrics, product usage slides, or any place you want to present percentages with a bit of flair.
Table of Contents
- Introduction
- What You’ll Need
- Design Concept & Use Cases
- Step‑by‑Step Build Instructions
- 1. Set up the Slide & Background
- 2. Draw the Hollow Circle (Pie Base)
- 3. Create Pie Segments with Rounded Rectangles
- 4. Convert Shapes to 3D (Isometric Top Up)
- 5. Build the Floating Platform
- 6. Add Shadow / Floating Effect
- 7. Add 3D Text and Labels
- 8. Add Lines and Details
- 9. Animate the Slide
- Design Tips & Best Practices
- Accessibility & Presentation Considerations
- Alternatives & Variations
- Troubleshooting Common Issues
- FAQ
- Conclusion
Introduction
This tutorial reproduces a practical, design‑forward approach to building a 3D pie chart using native PowerPoint shapes, 3D rotation, and formatting tools. Rather than using the built‑in chart object, we construct the pie slices manually so you can control the thickness, angle, lighting, and animation for a professional, infographic‑style asset. You’ll learn how to make the pie look three dimensional (with depth), place it on a diamond‑shaped platform that appears to float, and animate elements so they appear in sequence for a more engaging reveal.
What You’ll Need
Before we begin, make sure you have:
- Microsoft PowerPoint (desktop version recommended — some 3D options and animation panes work best there).
- A blank slide or copy of your presentation where you want the pie chart to appear.
- Basic familiarity with PowerPoint’s Insert & Shape tools, Format Shape pane, and the Animations tab.
- Time to experiment with gradients, lighting, and depth — these are what make the 3D look believable.
Design Concept & Use Cases
The core idea is simple: build each pie piece as a rounded rectangle (or similar shape) and layer these inside a hollow circle. Then apply a consistent 3D rotation (isometric top up) to all pieces and set an appropriate depth value to create thickness. Place the pie on a diamond-shaped platform and add a soft-edged duplicate behind the platform to simulate a shadow, giving the impression the pie is floating.
When to use this approach:
- Highlight usage percentages such as “23k visitors” or “42% active users”.
- Create dashboard slides where visual hierarchy and aesthetics are important.
- Design marketing or investor presentations where visuals must be both informative and polished.
Step‑by‑Step Build Instructions
1. Set up the Slide & Background
Start with a new slide. I prefer a gradient fill for the background to add depth without distracting from the pie. You can pick any two related colors (for example, dark blue to lighter blue) and apply a direction to the gradient that supports the composition. Keep the gradient subtle so foreground elements remain readable.
- Right‑click the slide background > Format Background > Gradient fill.
- Choose 2–3 stops and set colors; adjust the angle to suit the layout.
- Set the slide’s layout to Blank for full control.

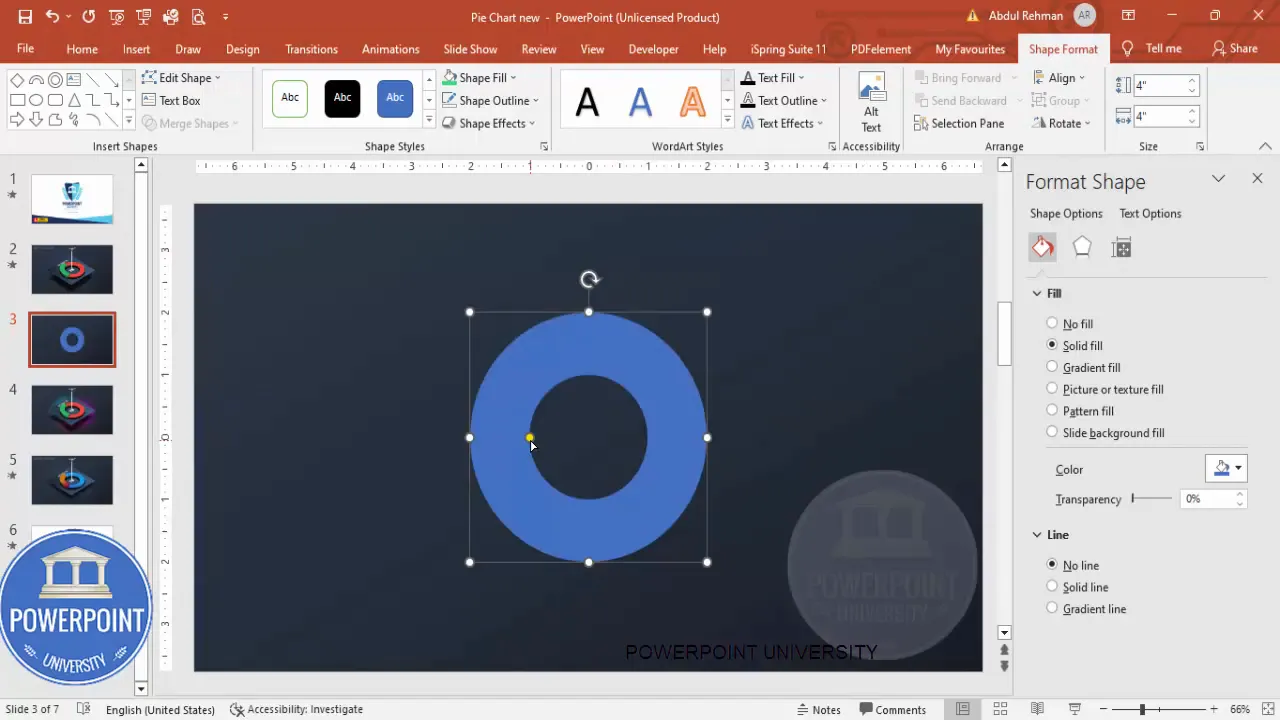
2. Draw the Hollow Circle (Pie Base)
The hollow circle becomes the visible donut ring where the pie pieces sit. PowerPoint’s “Circle Hollow” shape is ideal because it creates a ring with an inner hole.
- Insert > Shapes > select the Hollow Circle (donut) or Circle Hollow.
- Draw the shape roughly in the center of the slide.
- Set Shape Outline to No Outline.
- In the Format Shape pane, set the size (for our example I make the height and width 4″ each — you can change this to suit your slide).
- Use Align > Align Center and Align Middle to position it exactly.
Tip: If you need a specific thickness for the donut, you can edit the inner radius by dragging the orange handle on the hollow circle.
3. Create Pie Segments with Rounded Rectangles
Instead of using PowerPoint’s chart object, we’ll build slices manually. Use rounded rectangles (or the Block Arc/Rectangle options) sized to match the donut ring’s outer diameter. Each rectangle will become a visible pie slice once layered and rotated into place.
- Insert > Shapes > Rounded Rectangle (or Block Rectangle) and draw a rectangle sized identically to the hollow circle (use 4″ x 4″ for consistency).
- Choose a fill color for the first slice (e.g., a saturated red).
- Set Shape Outline to No Outline.
- Place the rectangle exactly over the hollow circle so it visually covers the ring area.
- Duplicate the rectangle for each additional slice and change each duplicate’s fill color (e.g., green, blue, etc.).
Note: At this stage the rectangles will overlap. We will set 3D rotation for each so they appear as concentric slices and align with the ring.
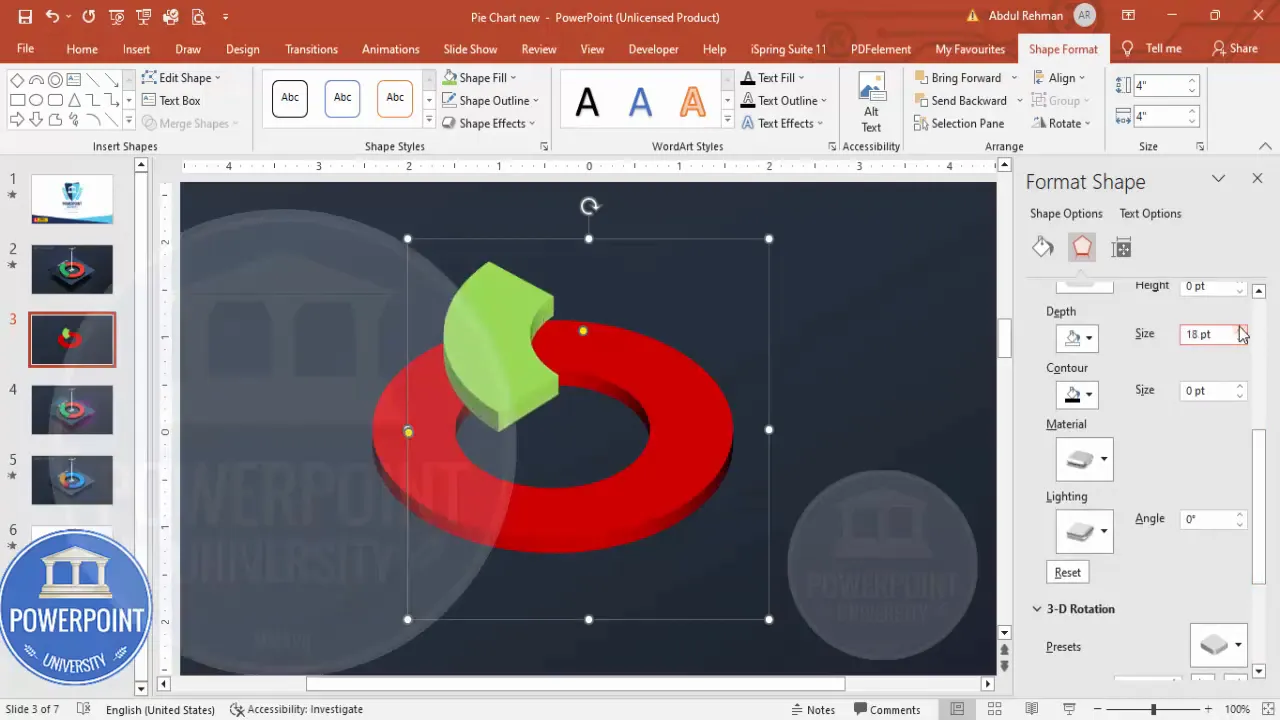
4. Convert Shapes to 3D (Isometric Top Up)
This is the crucial step that turns flat shapes into 3D slices. We apply the same 3D rotation preset to every shape so they share a consistent perspective, then increase their depth to give thickness. After that, align the shapes so they stack perfectly within the donut ring.
- Select the first rectangle (pie slice).
- Format > Shape Effects > 3‑D Rotation > choose the Isometric Top Up (Parallel) preset.
- Format > Shape Effects > 3‑D Format > Increase the Depth value — start low (~10–20) and increase until the slice appears suitably thick. In the example, the second slice uses depth ~20 or 21 for a more pronounced look.
- Adjust Lighting and Material in 3‑D Format to fine‑tune highlights and shadows (experiment with softer or harsher lighting depending on your color scheme).
- Repeat for each slice so they all share the same rotation angle but can differ slightly in depth if you want deliberate layering hierarchy.
- To rotate or fine‑tune alignment, use the 3‑D Rotation options rather than the free rotate handle. Rotating using the free rotate handle will break alignment; use the 3‑D Rotation dialog for consistent results.
Why use Isometric Top Up? It gives a clean, professional perspective for icons and charts — the face of the pie appears slightly tilted towards the viewer while remaining readable.
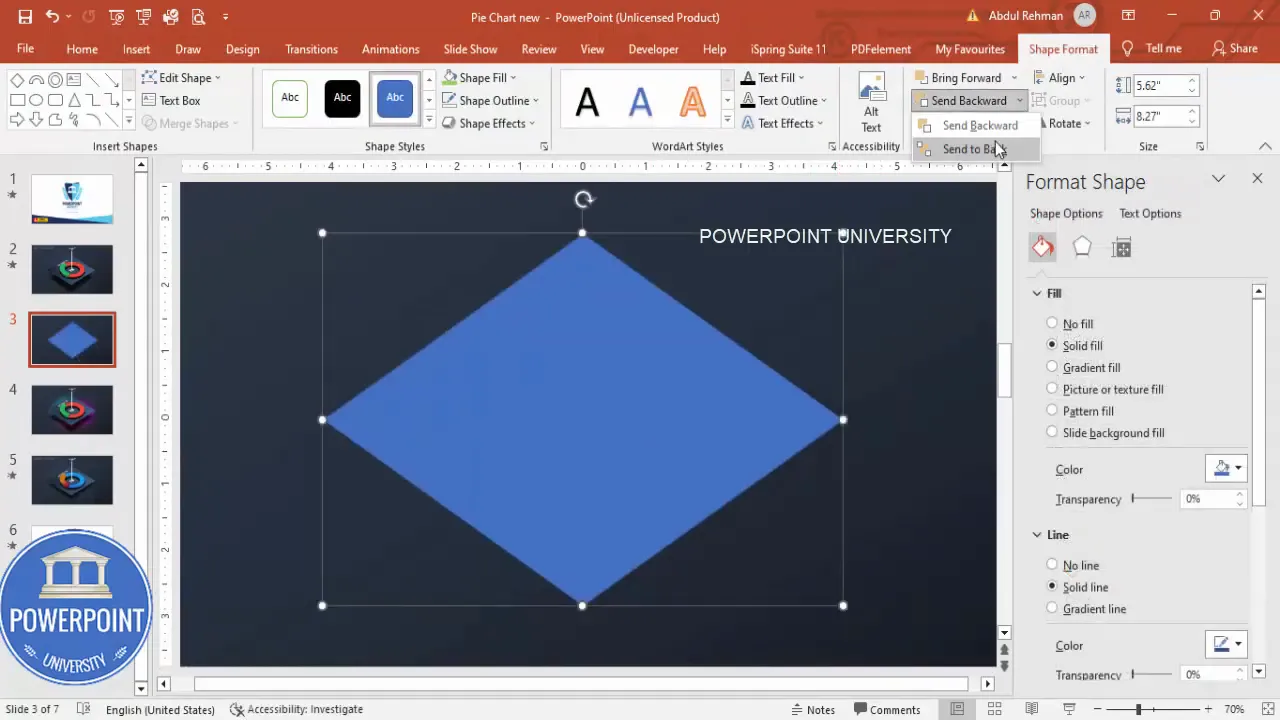
5. Build the Floating Platform
To make the pie appear elevated, create a diamond‑shaped platform underneath it. The platform anchors the visual and provides a surface on which the pie appears to sit.
- Insert > Shapes > Diamond shape (or use a rotated square).
- Draw the diamond shape and send it to back (Right click > Send to Back) so the pie sits above it.
- Remove shape outline (No Outline).
- Apply a gradient fill — choose two complementary colors (e.g., darker blue at the top to lighter blue at bottom) and set a direction so the highlight is aligned with your pie’s light source.
The diamond is a simple but effective choice because it reads as a stylized platform from an isometric perspective.
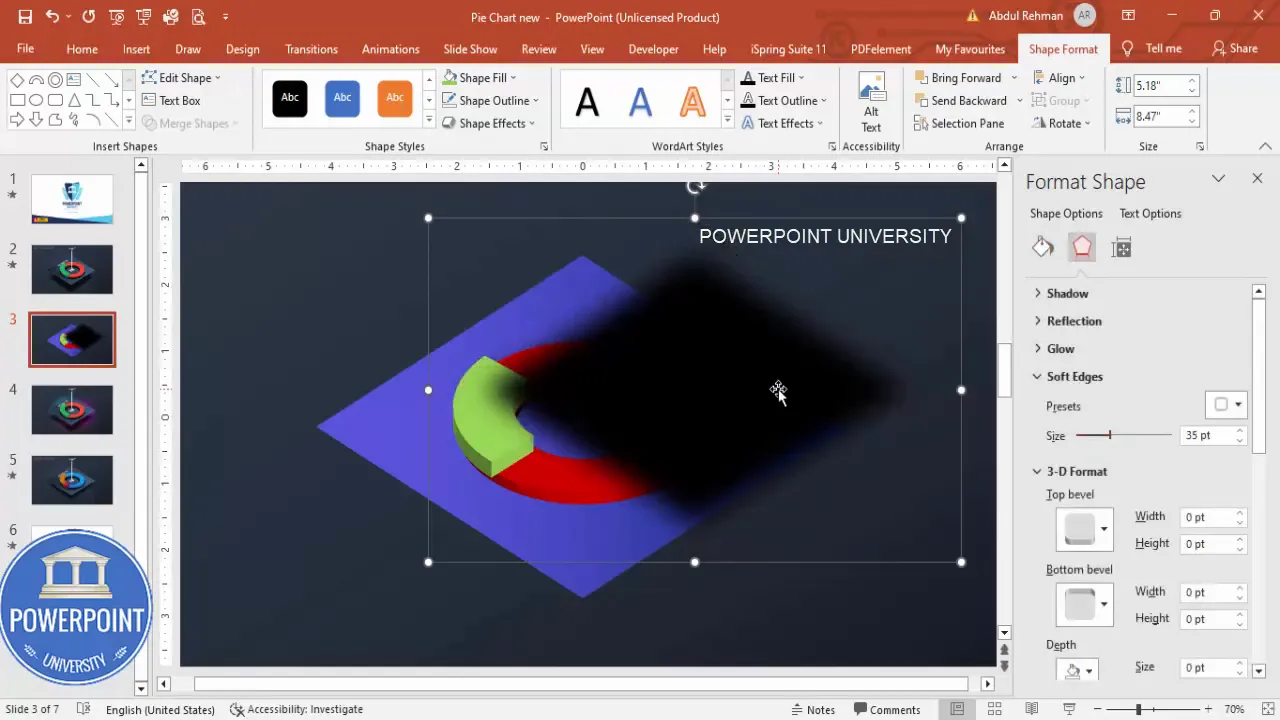
6. Add Shadow / Floating Effect
To sell the floating illusion, duplicate the diamond and convert the duplicate into a soft, dark blur that sits behind and slightly lower than the original platform. This duplicate acts as a cast shadow.
- Press Ctrl+D to duplicate the diamond.
- Fill the duplicate with a solid black or dark gray color.
- Format > Soft Edges — increase the soft edges value to create a blurred shadow. Alternatively, use Format > Shadow options and set a large blur radius and low transparency.
- Move the shadow duplicate slightly down and back (use Send to Back) so it peeks out beneath the platform and gives depth.
Small choices matter: subtle soft edges and low transparency produce the most realistic shadow. Huge, harsh shadows can make the composition look cartoonish.
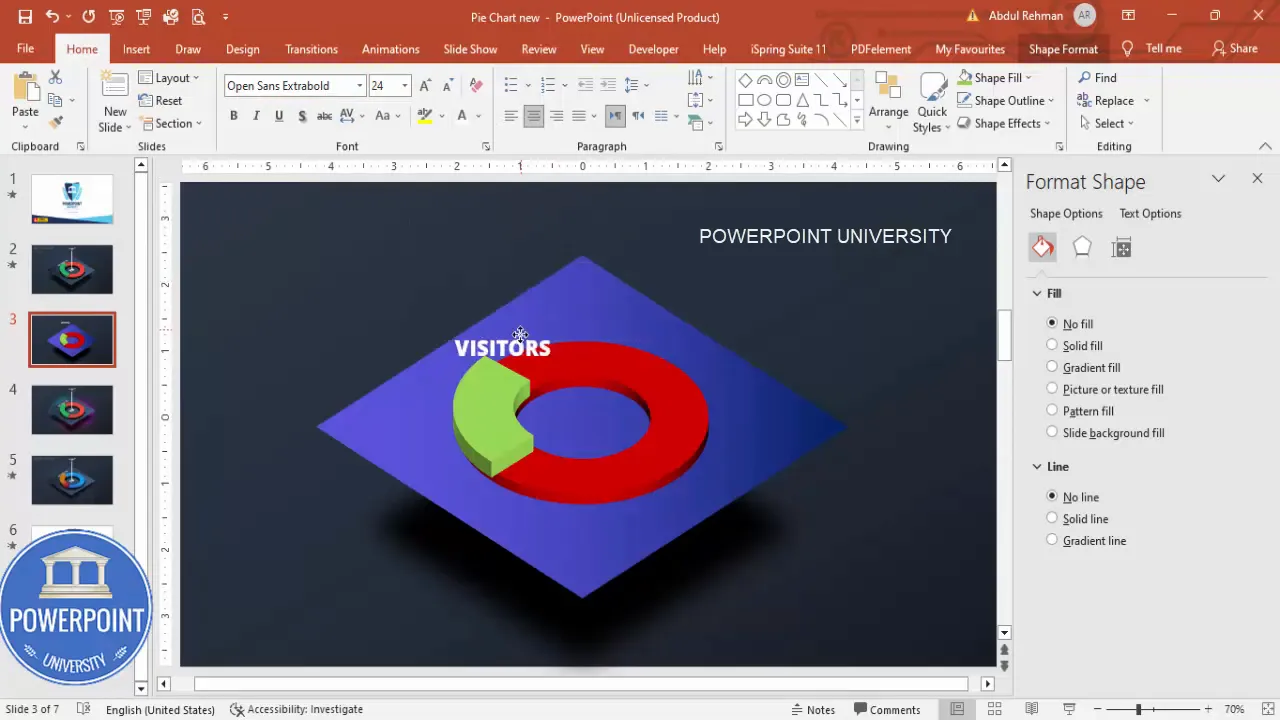
7. Add 3D Text and Labels
Good data slides have clear labels: add a headline like “Visitors,” and a large numeric value to show totals or percentages. To match the 3D look, also apply a 3D rotation to the main number so it appears part of the same scene.
- Insert > Text Box and type the label (e.g., Visitors).
- Format the label font: choose a clean, bold sans‑serif (I used Open Sans Extra Bold in the example) and set color to white for good contrast.
- Add another Text Box for the numeric value (e.g., “23,000”).
- With the numeric text box selected, open Format > Text Options > Text Effects > 3‑D Rotation and select the same Isometric Top Up preset so the text sits in the same perspective as the pie pieces.
- Scale and center the numeric value over the pie or on the platform as you prefer.
Key distinction: when formatting text, use Text Options in the Format pane; for shapes, use Shape Options. These are separate panels and applying shape effects to text won’t produce the desired result.
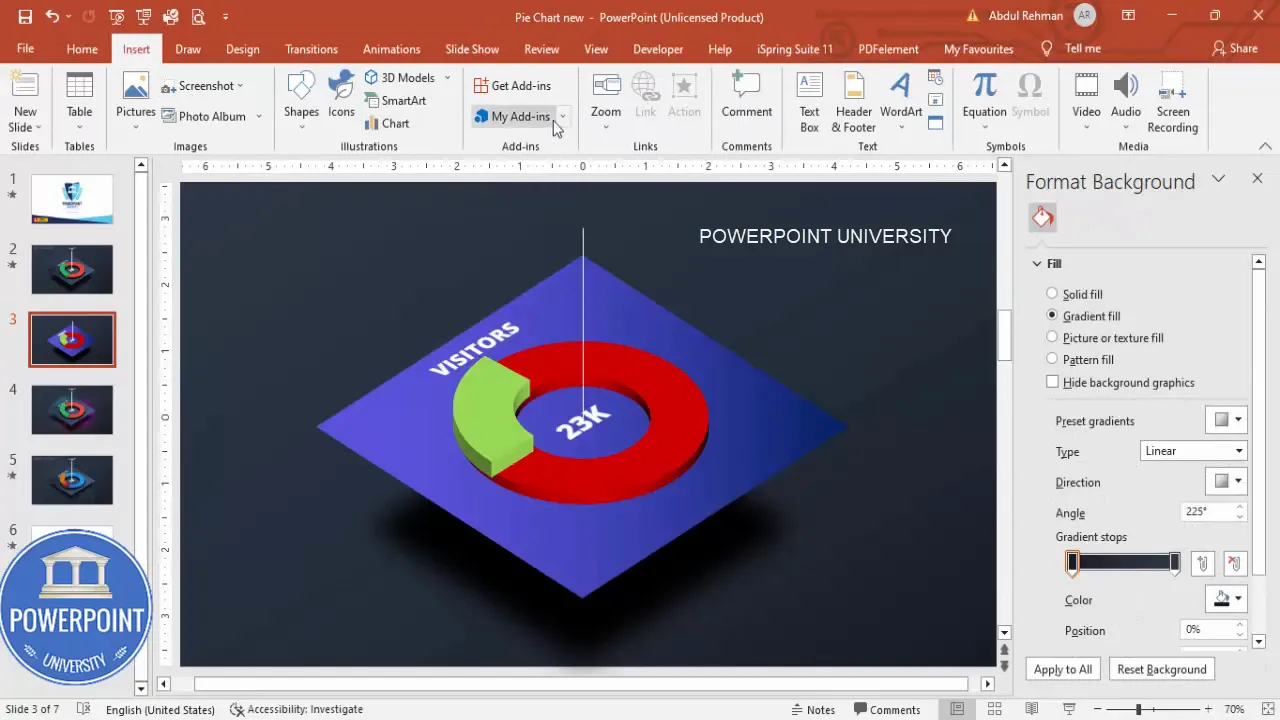
8. Add Lines and Details
Small lines, dividers, and a short body of descriptive text can enhance clarity. A thin vertical line next to your textual explanation separates the visual from the explanation and gives a sophisticated layout.
- Insert > Shapes > Line and draw a thin vertical line next to your label block.
- Set the line color to white (or a color that contrasts with the background) and increase width slightly if needed.
- Add a small paragraph of descriptive text (font size 10–14 depending on slide scale) and format it to center or left align as desired.
Always ensure text contrast is sufficient. If the background is busy, use a semi‑transparent rectangle behind the text or increase the font weight to maintain legibility.
Create Slides in Seconds with ExpertSlides AI |
|
Generate AI Presentations today: |
| TRY NOW! |
9. Animate the Slide
Animation sequences help you guide the audience’s attention. The idea is to reveal the platform first, then the pie slices, then the numeric label and supporting text, using subtle, professional entrance effects.
- Open the Animations tab and enable the Animation Pane so you can see and manage sequencing.
- Select the platform (main diamond) and add an entrance effect — I use Zoom from the More Entrance Effects menu (choose Basic Zoom under More Intense depending on your PowerPoint version).
- Adjust duration to taste (0.4–0.6s for a snappy entrance) and set it to Start: On Click or With Previous depending on presentation flow.
- Select the pie shapes and add either Wipe or Stretch animations. For wipe, set the direction and for stretch choose From Bottom to reinforce the 3D effect. Set these to Start: After Previous so they appear automatically after the platform.
- Add the numeric value animation — I like Zoom (Basic Zoom) set to From Outside so it scales into view; set to After Previous.
- Finally, animate the descriptive text with a subtle Fly In from top, set to After Previous and timed slightly later to allow the viewer to absorb the visual first.
Sequence example that worked well in the demo:
- Platform: Zoom (On Click or With Previous)
- Main Pie Slice: Wipe / Stretch (After Previous)
- Other Slices: Wipe / Stretch (staggered, After Previous)
- Numeric Value: Zoom (After Previous)
- Details: Fly In from Top (After Previous)
Design Tips & Best Practices
To ensure your slide is professional, consistent, and accessible, follow these design rules and recommendations:
Color & Contrast
- Use a limited palette: 3–5 colors maximum for slices so the chart remains readable.
- Prefer high contrast between foreground (slices, text) and background. White or very light text over dark gradients works well.
- When selecting gradients, make sure they don’t clash with slice colors. Test the slide from a distance to catch color clashes.
Consistency & Alignment
- Align all shapes using PowerPoint’s Align tools — Center and Middle alignment ensures everything is perfectly positioned.
- Keep the same 3D rotation preset across all shapes and text so the perspective reads as a single scene.
- If you scale the pie, scale all related elements proportionally so relationships remain consistent.
Typography
- Choose bold, readable sans‑serif fonts for main numbers (Open Sans, Montserrat, Lato, etc.).
- Use different weights (bold for numbers, regular for explanatory text) to build visual hierarchy.
- Keep supporting text minimal — a single sentence or two.
Animation Restraint
- Animation should guide attention, not distract. Keep durations short and transitions subtle.
- Use the Animation Pane to control timing precisely and stagger elements by 0.1–0.3 seconds for a polished staggered reveal.
Accessibility & Presentation Considerations
While stylized infographics look great, they must still be accessible and clear for your audience.
- Provide textual equivalents: if this slide is used in handouts or as part of a report, include the numeric data in a text block or footnote so screen readers and printed copies retain the information.
- Avoid color as the sole identifier for slices if you’ll be sharing static slides. Add small data labels or a legend.
- Use sufficient font sizes: large numbers should be legible from a distance (think 36–72pt depending on slide size).
Alternatives & Variations
This manual-shape assembly approach gives complete control, but there are other ways to visualize percentage data in PowerPoint. Consider these alternatives depending on your needs:
- Built‑in Donut Chart: Insert a donut chart and format the 2D chart to mimic depth with shadows and beveled effects. This is data‑driven (linked to a sheet) so it’s better when numbers change frequently.
- Layered 3D Shapes: For multiple pies on a single slide, create a small set of these 3D donuts and scale them down while keeping consistent perspective.
- Icon & Percentage: When space is tight, use a large numeric percentage over a subtle icon or flat donut for a lightweight option.
Troubleshooting: Common Issues & Fixes
If something looks off, here are likely causes and fixes.
Misaligned Slices
- Problem: Slices don’t stack perfectly inside the hollow circle.
- Fix: Check that all shapes share the same width & height. Use Align & Center / Middle. If small misalignments persist, nudge shapes using arrow keys.
3D Rotation Looks Wrong
- Problem: One or more slices don’t match the others when rotated.
- Fix: Ensure you apply the same Isometric Top Up preset and identical rotation values. Don’t rotate using the free rotate handle; use the 3D Rotation options for consistency.
Text Effects Not Applying
- Problem: Applying 3D rotation to text appears to have no effect.
- Fix: Use Text Options in the Format pane (not Shape Options). Text and shapes are separate and require separate format settings.
Animation Looks Choppy
- Problem: Animations appear slow or jittery during playback.
- Fix: Reduce animation durations, avoid overusing intensity effects, and test in Slide Show mode rather than the editor. If your presentation machine is underpowered, simplify transitions.
FAQ
Q: Can I make the pie segments show actual data (like 20%, 30%) instead of drawing approximate rectangles?
A: Yes — but this manual technique is primarily visual. If you need data accuracy linked to a spreadsheet, use PowerPoint’s built‑in Pie or Donut chart and then style it. To keep the 3D aesthetic while using data-driven charts, insert a donut chart, reduce the hole size, and mimic depth with shadows and duplicated shapes behind the slices.
Q: Will this 3D rotation and depth export correctly if I save as a PDF?
A: The 3D rotation and shape formatting are vector-based and should export cleanly to PDF. However, some animation nuances will not transfer to PDF; animations work only in PowerPoint playback (or when converted to video). If you need a static version for print or PDF, position and format everything for the final frame and export that slide as an image or PDF.
Q: How do I make the platform color match my brand palette?
A: Use the Format Shape > Fill > Gradient options and manually input your brand color hex codes. Adjust gradient stops and direction until the highlight and shadow read naturally. For brand consistency, limit the slide to 1–2 primary brand colors and 1–2 accent colors for slices.
Q: Can I reuse this design across multiple slides without rebuilding it?
A: Absolutely. Once you’ve built the composition, select all elements and press Ctrl+D to duplicate within the same presentation. For cross‑file reuse, save the slide as a separate PPTX and copy it into other presentations. You can also save the slide as a custom template slide in the Slide Master for repeated use.
Q: Are there any performance concerns when using many 3D shapes and animations?
A: Yes — complex 3D formatting and many simultaneous animations can impact presentation performance on older machines. To mitigate this, reduce total shape count, avoid excessive soft edges or blur values, and limit animation to essential elements. Test the presentation on the target machine beforehand.
Q: How do I make the pie slices have precise wedge angles (e.g., exactly 15%, 35%)?
A: If you require mathematically precise wedge angles, use a pie or donut chart that reads data from the built‑in data table. The shape method is better for stylized visuals and manual aesthetics. For precise angles and an isometric look, create the pie in PowerPoint as a standard pie chart, then overlay thin 3D arcs as decorative rims to imitate depth.
Practical Examples & Use Cases
Here are a few ways you might use the animated 3D pie chart design in real presentations:
- Monthly Website Traffic Slide: Show total visitors with the large numeric value and break down device usage (desktop/tablet/mobile) as pie slices.
- Product Uptake Slide: Display feature usage percentages (e.g., percentage of users who enabled Feature A) while animating slices to reflect their contribution.
- Investor Dashboard: Use a series of smaller 3D pies (consistent perspective) to illustrate revenue mix across product lines.
- Marketing KPI Snapshot: Highlight conversion rate as a main figure and show channel mix as slices for quick visual comparison.
Step Checklist Before Presenting
Use this checklist to ensure your 3D pie slide is presentation‑ready:
- All shapes aligned and centered using Align tools.
- Uniform 3D rotation and matching perspective across shapes.
- Depth values tuned for realistic thickness.
- Gradient lighting consistent with the intended light source.
- Text contrast and font sizes checked for legibility on the presentation screen.
- Animations tested in Slide Show mode with proper timing (On Click / After Previous as needed).
- Static backup slide saved in case animation playback is unavailable.
Troubleshooting Quick Reference
- PowerPoint UI missing 3D options: Ensure you are using a modern desktop build of PowerPoint with full formatting capabilities. Web or mobile versions sometimes lack advanced 3D controls.
- Shapes look rasterized: Avoid heavy image effects on vector shapes; use subtle gradients and low soft edges for better crispness.
- Animations not firing: Check that you set Start to After Previous or On Click as required and that the Animation Pane is visible to confirm sequencing.
Conclusion
This method gives you a flexible, highly editable way to craft beautiful, animated 3D pie visuals in PowerPoint without leaving the app or relying on external graphics. By using simple shapes, consistent isometric rotation, careful depth and lighting choices, and subtle animations, you can elevate a routine data slide into a memorable visual that communicates both numbers and narrative. Remember to keep your design restrained, style texts for clarity, and test performance on the machine you’ll present from.
If you want to expand on this, try creating multiple 3D pies with consistent perspective across the slide to compare different metrics side by side. Or combine a 3D pie with a timeline or small multiples for richer storytelling.
Final Notes
Design is iterative — don’t be afraid to tweak colors, depth, or animation timing until everything feels balanced. The techniques shown here are intentionally modular: you can swap out shapes, change the platform style, and adapt the animation sequence to match your presentation’s tone.
Happy designing — and remember: small details like consistent lighting, soft shadows, and aligned 3D rotation make a huge difference in how professional your slide feels.
Check out the full video: Create Animated 3D Pie Chart Design Slide in PowerPoint | Tutorial 1012 | Free Template


