

If you want a polished, clickable, and animated 9 options infographic Slide for your next presentation, you’re in the right place. I’m POWERPOINT UNIVERSITY, and in this tutorial I’ll walk you through every step to build a clean, professional 9 options infographic Slide in PowerPoint — from drawing the base hexagon to adding icons, colors, grouping, and animations that respond to clicks. Follow along and use the downloadable template if you want to jump straight to the finished file.
This article is written in an easy-to-follow, step-by-step style so you can recreate the Slide exactly or adapt the technique to your own visual system. I’ll include helpful screenshots keyed to specific moments, practical tips, keyboard shortcuts, and a FAQ section to troubleshoot common issues.
Keyphrase: Throughout this article I’ll use the phrase 9 options infographic Slide so you can quickly find and reproduce this layout. Keep an eye out for screenshots and exact steps you can replicate.
Table of Contents
- Introduction: What you’ll learn
- Before you start: Files, fonts, and settings
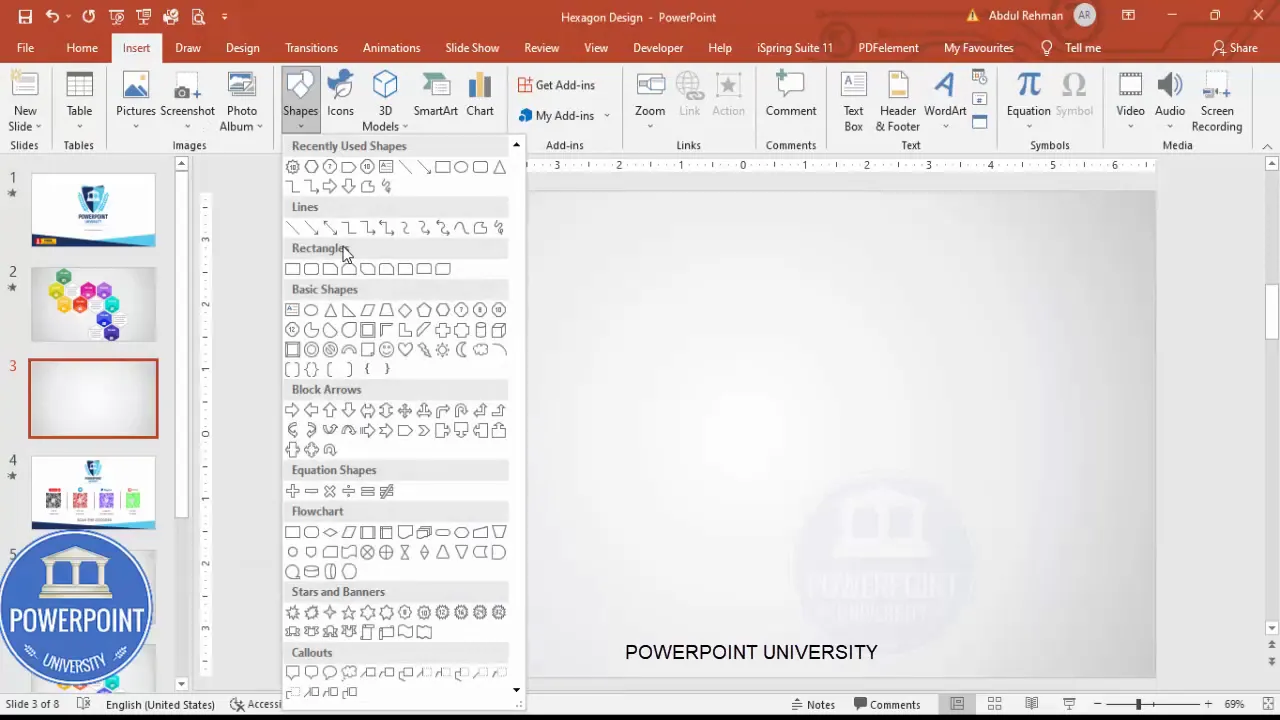
- Step 1 — Set up the slide background
- Step 2 — Draw and size the hexagon
- Step 3 — Create the intersected color shape
- Step 4 — Add white inner hex and outline
- Step 5 — Duplicate and arrange nine options
- Step 6 — Choose and apply a color scheme
- Step 7 — Add titles, numbers, and descriptive text
- Step 8 — Add icons for visual clarity
- Step 9 — Group each option for easy editing
- Step 10 — Add animations and fine-tune timing
- Design tips, shortcuts, and accessibility notes
- Common mistakes and troubleshooting
- Use cases and export options
- FAQ
- Conclusion and next steps
Introduction: What you’ll learn
By the end of this tutorial you’ll be able to design a professional 9 options infographic Slide that:
- Uses custom-shaped hexagon tiles as option containers.
- Applies layered fills and intersect shapes to create depth.
- Includes a white inner hexagon with a subtle outline for content space.
- Arranges nine options around a central point with balanced spacing.
- Adds titles, numbers or icons, and short descriptions for each option.
- Applies grouped animations so the tile and content appear smoothly, on click or automatically.
This design works well for agendas, product features, processes, multi-step plans, or comparison slides. The techniques are reusable and easy to customize for brand colors, different shapes, or fewer/more options.
Before you start: Files, fonts, and settings
Preparation saves time. Before you build the 9 options infographic Slide, make sure you have the following:
- PowerPoint 2016 or later (the Merge Shapes and Icons features used here require modern versions).
- A clean slide with a light gradient background or your brand background.
- The Open Sans or a similar clean sans-serif font installed (or choose your brand font). In this tutorial I used Open Sans Semibold for titles and Open Sans for body text.
- Optional: the free template available for download if you prefer to start from the finished layout.
Set your slide view to 100% or zoom so you can control precise object placement. I use keyboard shortcuts extensively — I’ll call these out as we go.
Step 1 — Set up the slide background
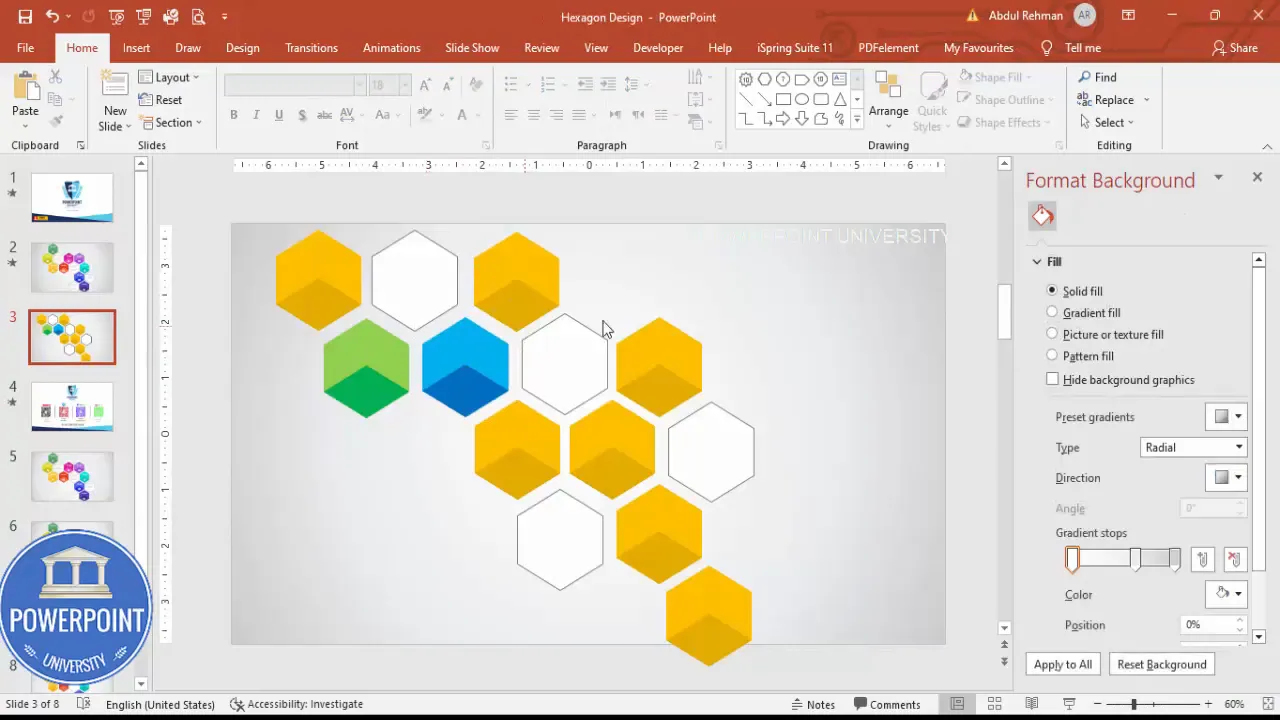
The background sets the tone. I recommend a subtle, light gradient fill so the colored hexagons pop without overwhelming the content.
- Insert a new blank slide.
- Right-click the slide background > Format Background.
- Choose Gradient fill and select a subtle two-color gradient (for example, very light gray to near-white, or a soft brand tint).
Keep the background subtle so the 9 options infographic Slide reads well on any projector or screen and remains print-friendly.

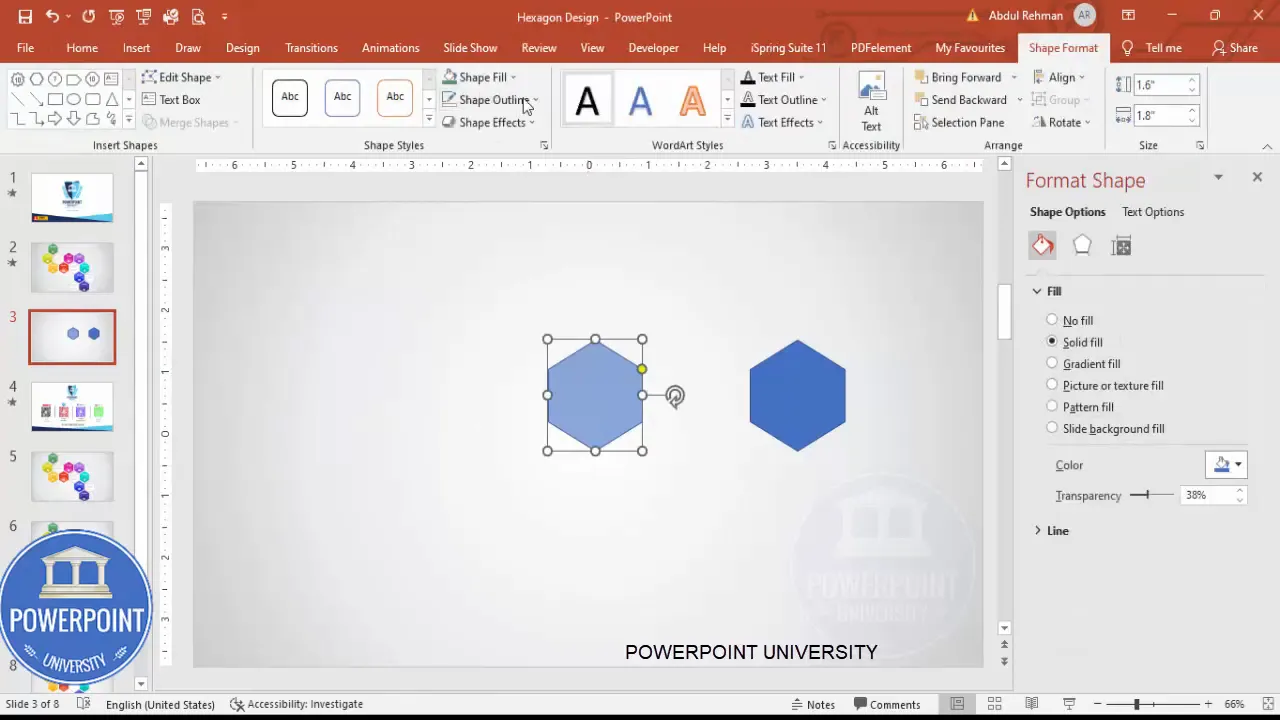
Step 3 — Create the intersected color shape
This step creates a two-tone look: a colored facet over the hexagon that gives depth and makes the tile more visually interesting.
- Duplicate the hexagon: select it and press Ctrl+D to create a copy and keep it aside.
- Select the visible hexagon, right-click > Format Shape. Set Fill transparency to around 60% so you can use it as a cutting guide; set Shape Outline to No Outline.
- Duplicate the semi-transparent version and position the duplicate so its bottom edge overlaps the base hexagon where you want the colored facet to appear. Zoom in to align precisely.
- Select both the base hexagon and the overlapping duplicate while holding Shift, go to Shape Format > Merge Shapes > Intersect. This produces a new shape representing the overlapping portion.
- Place the intersected shape on top and fill it with a distinct color (for example, orange). Remove transparency for the final look.
This intersect technique is a simple way to add an angled facet or highlight to your tile, which creates a subtle 3D impression without gradient fills or shadows.
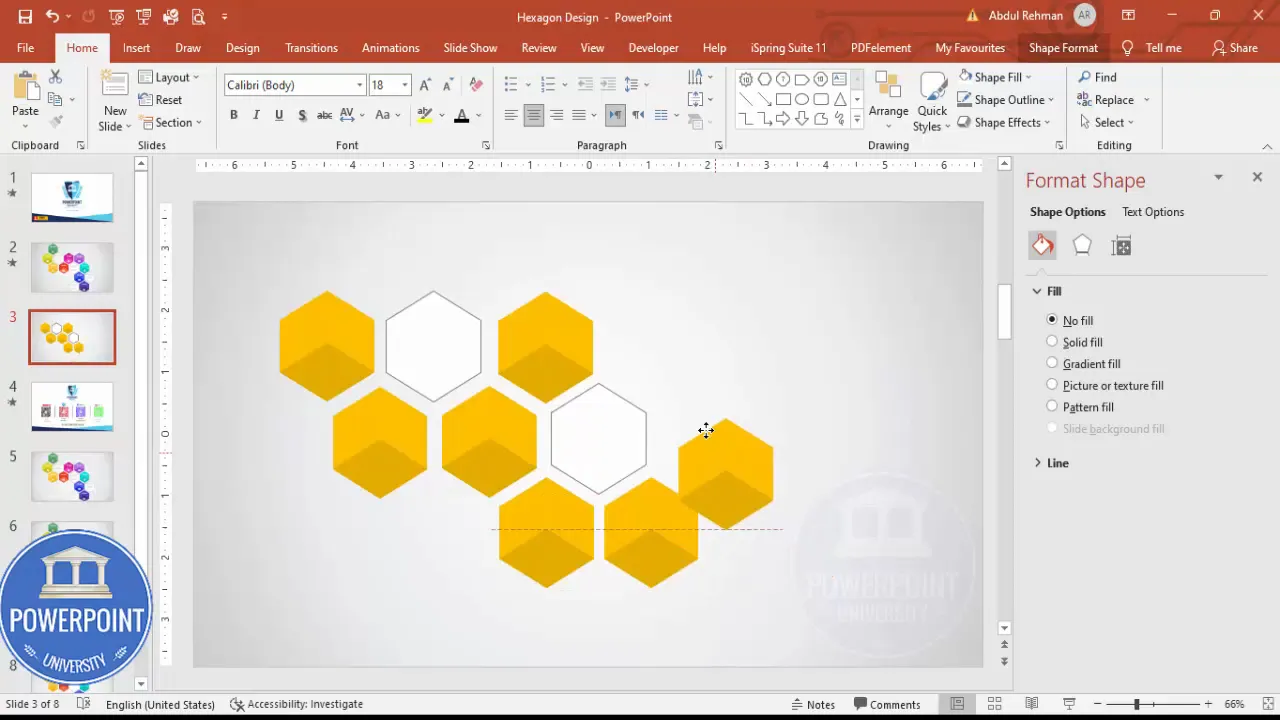
Step 4 — Add white inner hex and outline
For the content area inside each tile, add a white inner hexagon with a light outline. This creates readable space for numbers, icons, and short text.
- Select one of your hexagon groups, press Ctrl+C and Ctrl+V to paste a copy.
- Fill the pasted shape with white and set Shape Outline to a subtle gray (this provides visual separation from the colored facet.)
- Place this white hexagon above the colored group so it appears centered and creates a content pad within the tile.
Tip: Use precise alignment options (Format > Align > Align Center/Align Middle) to ensure the white hex is perfectly centered over the colored group.
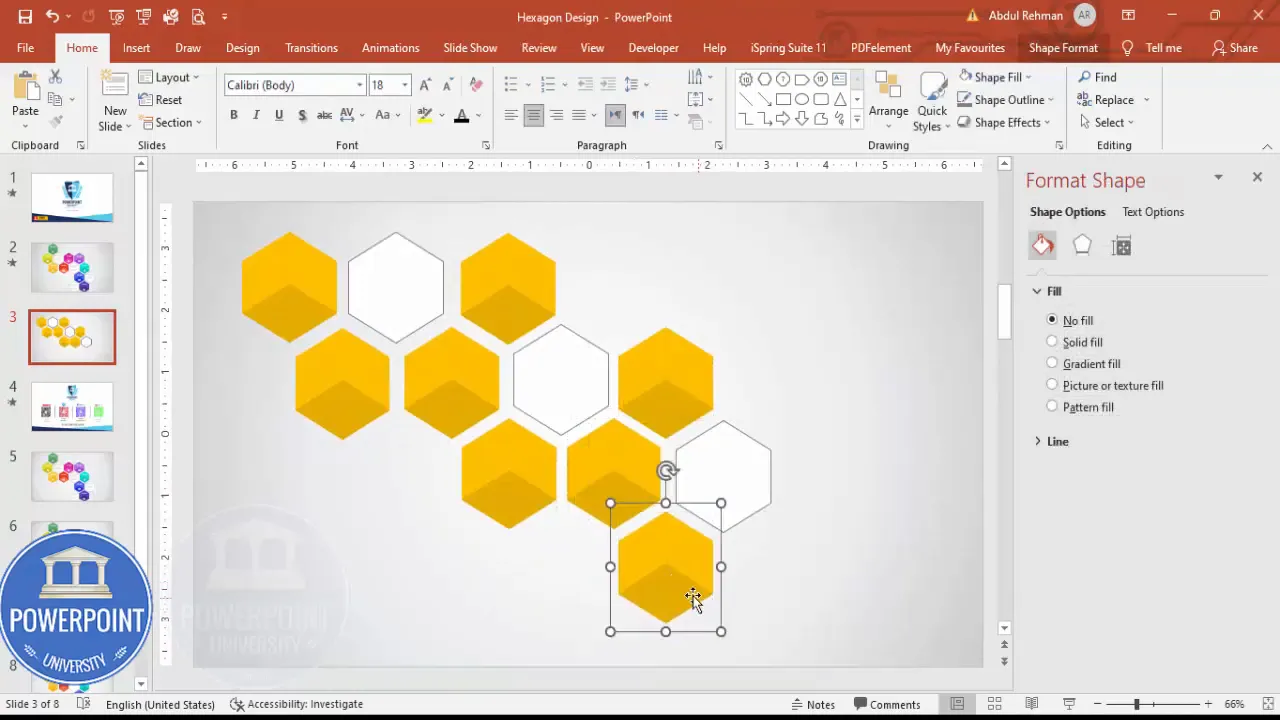
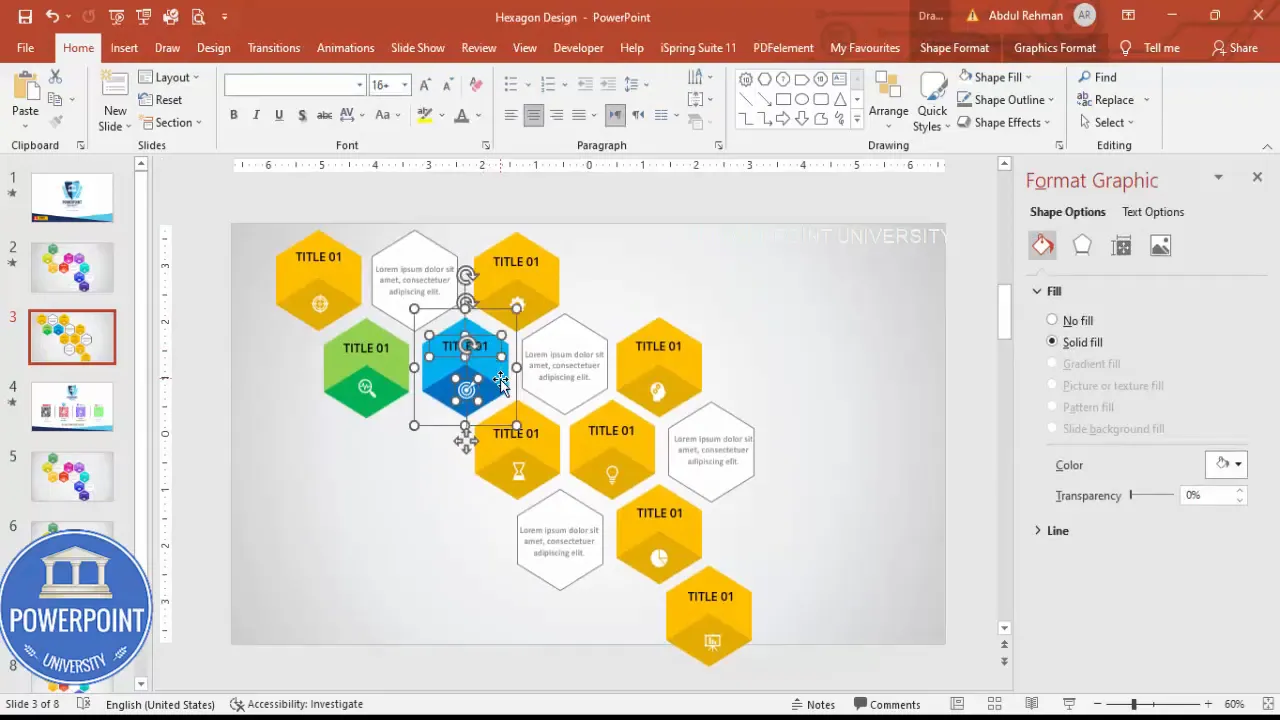
Step 5 — Duplicate and arrange nine options
Once you have one completed tile (colored facet + white inner hex), create the full set of nine options and arrange them into the grid or radial layout you prefer.
- Select the grouped tile and press Ctrl+D repeatedly to create duplicates. Create nine in total.
- Arrange tiles around a central focal point. I used a roughly circular arrangement with a grid-aligned spacing so the entire composition reads balanced.
- If spacing looks cramped, select all tiles (Ctrl+A), and move them slightly up or down to create more space. Fine-tune individual positions as needed.
Visual balance is important. Use equal distances and alignment tools to keep the composition tidy. You can also create a master pattern (e.g., a central tile surrounded by eight on a ring) depending on your messaging.
Step 6 — Choose and apply a color scheme
Color choice will make or break the 9 options infographic Slide. Pick a palette that supports hierarchy and accessibility.
- Option A: Monochromatic — choose one hue and use lighter and darker variants for each tile.
- Option B: Analogous — pick adjacent colors on the color wheel for harmony.
- Option C: Accent-based — use a neutral background with vibrant accent colors for each tile.
How I apply colors in the example:
- Use a darker tone for the intersection facet and a lighter tone for the rest of the tile to create contrast.
- For the white inner hex, keep it white or off-white and apply a subtle outline to maintain readability against bright backgrounds.
- Stick to 2–3 core hues to avoid a garish palette. If you need nine distinct colors, keep them muted and balanced.
Color application workflow
- Select a tile group, click Shape Fill, and choose your color.
- For the intersect facet, choose a slightly darker shade than the tile base.
- Once you’ve defined the palette, apply the colors to each tile consistently so the 9 options infographic Slide reads cohesive.
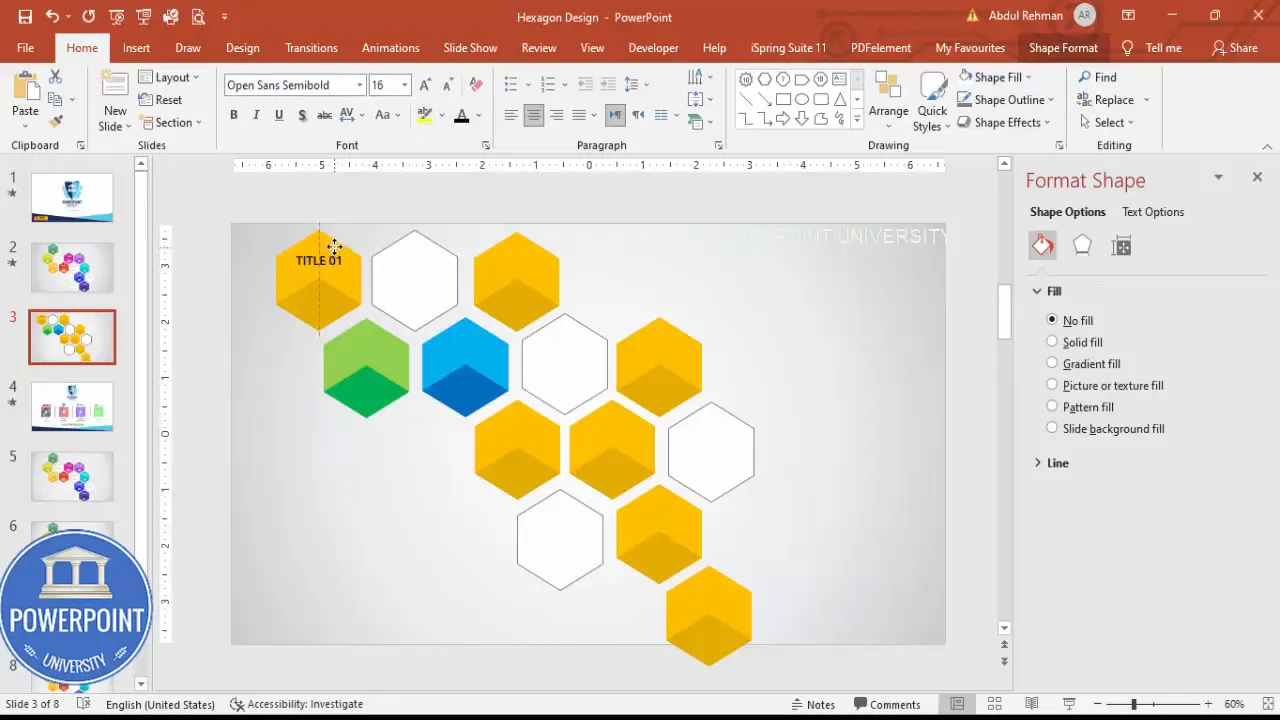
Step 7 — Add titles, numbers, and descriptive text
Each option needs a concise label and optionally a number or icon. Use a clear hierarchy: title (Open Sans Semibold), small number or icon, then a short description.
- Insert a text box (Insert > Text Box) and type a short title, e.g., “Title 01”.
- Set the font to Open Sans Semibold, reduce size to match the tile scale, and center align the text within the white hex.
- Duplicate the text box with Ctrl+D for each tile and change the text to Title 02, Title 03, etc., or replace numbers with icons if you prefer.
- For the descriptive text, insert another text box inside the white area and use a smaller gray font for a short explanatory line.
Keep descriptions to one or two short sentences at most so the 9 options infographic Slide remains scannable. Long paragraphs belong in speaker notes or handouts.
Create Slides in Seconds with ExpertSlides AI |
|
Generate AI Presentations today: |
| TRY NOW! |
Step 8 — Add icons for visual clarity
Icons are powerful: they speed comprehension and reinforce meaning. PowerPoint’s built-in Icons menu is a handy source of clean SVG icons.
- Go to Insert > Icons.
- Choose nine icons that reflect each option’s topic. Select icons thoughtfully — they should be simple and match the style (line, filled, or glyph).
- Place each icon inside the white hex, size them to about 0.4″ to maintain balance with the title.
- Set icon color to white if placed on a colored tile, or to a single accent color for stylistic unity.
Icons improve scan-ability and are particularly useful when the slide will be viewed quickly or on mobile devices.

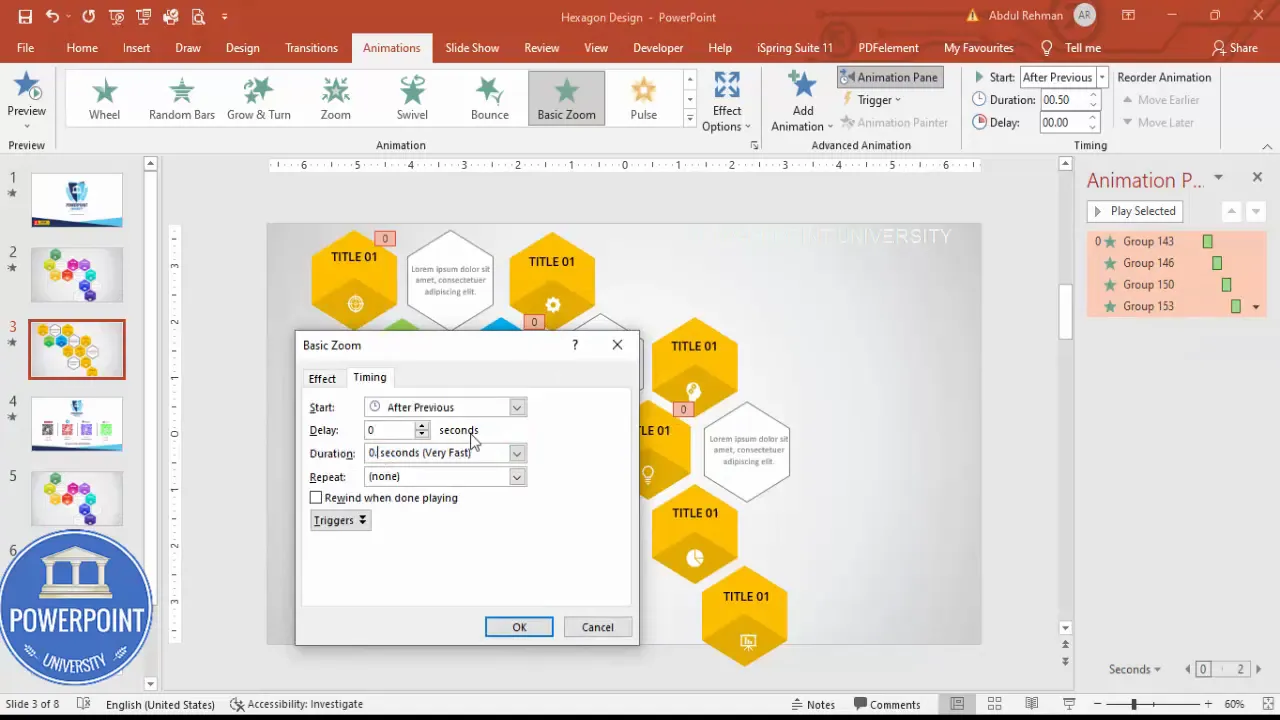
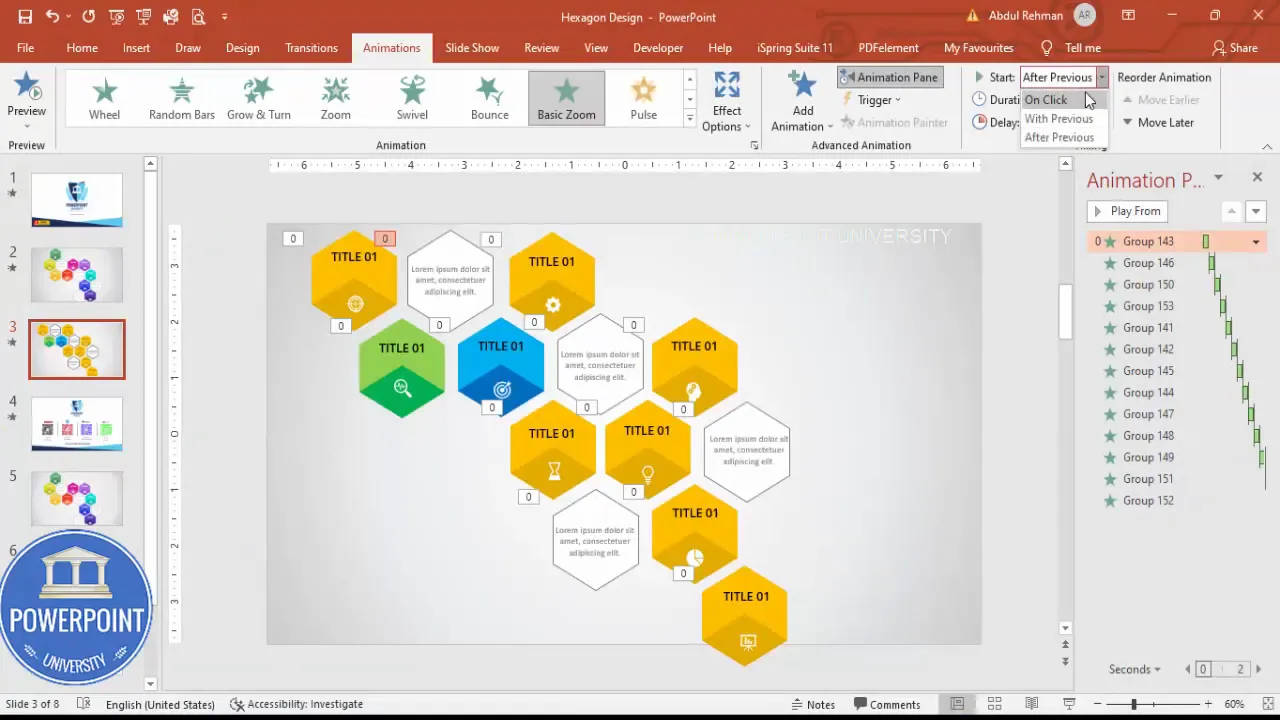
Step 10 — Add animations and fine-tune timing
Animations make the 9 options infographic Slide interactive and help control the audience’s focus. The goal is subtlety and speed: short zooms or fades that don’t distract from the message.
- Open Animations > Animation Pane to manage sequences.
- Select the white inner boxes first (or the grouped tile) and choose Add Animation > More Entrance Effects > Basic Zoom (or Zoom Out).
- Set the animation to After Previous for automatic sequences, or On Click to reveal items when you want to discuss them.
- Adjust the speed. I set Timings to 0.3 seconds so the tiles appear fast and snappy. Select the animation > Right-click > Effect Options > Timings > Set to 0.3s.
- For the colored tile layer, use the opposite zoom direction (Zoom In) so the content feels like it pops forward while the background layer zooms out or in for contrast.
- Test the sequence in Slide Show mode and refine delays so it matches your speaking cadence.
Animation Tips:
- Use consistent entrance effects across tiles to avoid a chaotic appearance.
- A short duration (0.2–0.4s) helps keep transitions feeling modern and responsive.
- If you want only four options to appear first and then reveal the rest, animate the first group with a different trigger (e.g., first four On Click and the remaining five After Previous).
Design tips, shortcuts, and accessibility notes
Small details elevate a Slide from amateur to professional. Here are practical tips and keyboard shortcuts to speed up your process and ensure the 9 options infographic Slide is accessible to all viewers.
Essential keyboard shortcuts
- Ctrl+D — Duplicate selected object(s).
- Ctrl+G — Group selected objects.
- Ctrl+A — Select all objects on the slide (useful for moving entire layouts).
- Alt + Arrow Keys — Nudge object rotation/adjustment handles depending on context.
- Shift + Drag — Constrain movement to one axis for precise alignment.
Layout and alignment
- Use Format > Align to distribute tiles evenly and center content inside tiles.
- Turn on Guides (View > Guides) to align the ring of tiles visually around a center point.
- If you need exact spacing, use the Grid and Snap settings (View > Grid and Guides).
Accessibility and readability
- Contrast: ensure text color contrasts sufficiently with tile or background. Aim for a WCAG AA contrast ratio where possible.
- Font size: keep titles large enough to read from a distance (minimum ~18–24 pt depending on slide size and projection).
- Alt text: when exporting or sharing slides as images, include alt text for each image in deliverables and handouts.
- Animations: provide content that’s accessible without relying on fast-paced animations; duplicate key information in speaker notes or handouts.
Pseudo-table: Quick reference (size, animation, icon size)
- Tile size: Base hexagon ~1.6″ height × 1.8″ width
- Icon size: ~0.4″ (adjust visually)
- Title font: Open Sans Semibold
- Body font: Open Sans regular, gray
- Animation: Basic Zoom, Timings = 0.3s
Common mistakes and troubleshooting
Here are the most common problems people run into when building a 9 options infographic Slide and how to fix them.
1. Shapes aren’t aligning precisely
- Fix: Use Format > Align options. Select multiple shapes and choose Align Top/Bottom and Distribute Horizontally/Vertically.
- Tip: Turn on Snap to Grid and adjust grid spacing for fine control.
2. Merge Shapes > Intersect doesn’t produce expected shape
- Fix: Ensure the shapes overlap properly and that you have selected both shapes before applying Merge Shapes > Intersect.
- If either shape has effects like shadow or glow, remove them before merging.
3. Icons look pixelated or too small after scaling
- Fix: Use vector icons from Insert > Icons (these scale cleanly). If you use PNGs, start with high-resolution files.
4. Animations are out of sequence or too slow
- Fix: Open the Animation Pane and reorder animations by dragging them into the correct order. Use Timings to set each animation to 0.3s for consistency.
- Tip: Use Start = On Click vs After Previous to control flow.
Use cases and export options
The 9 options infographic Slide is versatile. Here are common scenarios where it shines and how to export the Slide for different uses.
When to use a 9 options infographic Slide
- Product feature breakdown (one tile per feature).
- Service offerings (grouped by category).
- Process steps for short presentations or training modules.
- Executive summaries or roadmaps where each tile represents a strategic initiative.
- Comparative frameworks where each tile shows a competitor or option.
Exporting options
- Export as PPTX and preserve all groups and animations for editing/share with colleagues.
- Export as PNG/JPEG for handouts or embed in PDFs. Use File > Export > Change File Type > PNG/JPG. Choose “All Slides” or “Current Slide” depending on needs.
- Export as a single slide video or GIF if you want an embeddable animated asset for websites or emails.
FAQ
Q: Can I use shapes other than hexagons for the 9 options infographic Slide?
A: Yes. The workflow is shape-agnostic. You can use circles, rounded rectangles, or custom shapes. If you use circles, the Merge Shapes > Intersect approach still works for creating facets; simply resize and align as needed.
Q: What if I don’t have the Merge Shapes option in my PowerPoint?
A: Merge Shapes is available in modern versions of Office (Office 2016+ and Microsoft 365). If you don’t have it, you can simulate the effect by carefully layering shapes and using color fills or by creating the facets in an external vector editor (like Illustrator) and importing them as SVGs.
Q: How do I make the 9 options infographic Slide responsive to different slide sizes?
A: Design in the final slide size if possible. If you need to change slide dimensions later, try to do so before placing many objects. If you must resize, select all objects and scale proportionally. Use Slide Master to maintain consistent spacing across multiple slides.
Q: Can I replace numbers with icons or images?
A: Absolutely. Instead of numeric labels, use icons that represent each option. Icons are often more immediately interpretable than numbers. Keep icon style consistent (line vs filled) for visual cohesion.
Q: How many times should I use the keyphrase 9 options infographic Slide in my slide deck or handout?
A: For SEO in written content, aim to include the phrase naturally across headings and within the body. For slide decks, use it sparingly in the title slide and accompanying materials. In this article I use it extensively to help you find and recreate this exact design.
Conclusion and next steps
Designing a compelling 9 options infographic Slide in PowerPoint is a valuable skill for anyone who presents complex information in a simple, memorable format. Using a hexagon tile, layered intersected facets, white inner pads, icons, and consistent animations you can build a slide that’s both beautiful and functional.
Quick recap: build one tile, copy it nine times, apply colors and icons, group each option, and finish with tasteful animations. Keep your descriptions short and your colors consistent for the best results.
If you want to speed things up, download the template I used — it already contains grouped tiles and animations so you can just swap colors, icons, and text. Start by customizing brand colors and titles, then refine animations to match your speaking notes.
Now go create a clean, clickable, and animated 9 options infographic Slide that communicates clearly and looks great. If you have questions, see the FAQ above or revisit the troubleshooting section for fixes to common issues. Happy designing!
Check out the full video: Create 9 Options Infographic Slide in PowerPoint. Tutorial No.: 996


