
PowerPoint is an incredibly versatile tool for creating engaging presentations, but did you know it can also help you design eye-catching infographics? In this comprehensive tutorial, we’ll explore how to create a modern animated infographic — specifically, an isometric roadmap infographic — directly in PowerPoint. This infographic features a small square that follows an isometric road path, complemented by 3D floating numbers for an impressive visual effect.
This article will walk you through each step of the process, from drawing the roadmap to animating elements, ensuring you can replicate this effect in your own presentations. Whether you’re a beginner or an advanced PowerPoint user, you’ll find practical tips and tricks to elevate your slide design skills.
Table of Contents
- Getting Started: Setting Up Your Slide
- Creating the Isometric Roadmap
- Designing Colorful 3D Cubes
- Adding 3D Floating Numbers
- Animating the Floating Numbers
- Animating the Square to Follow the Roadmap
- Enhancing Your Slide with Clickable Zooms
- Frequently Asked Questions (FAQ)
- Conclusion
Getting Started: Setting Up Your Slide
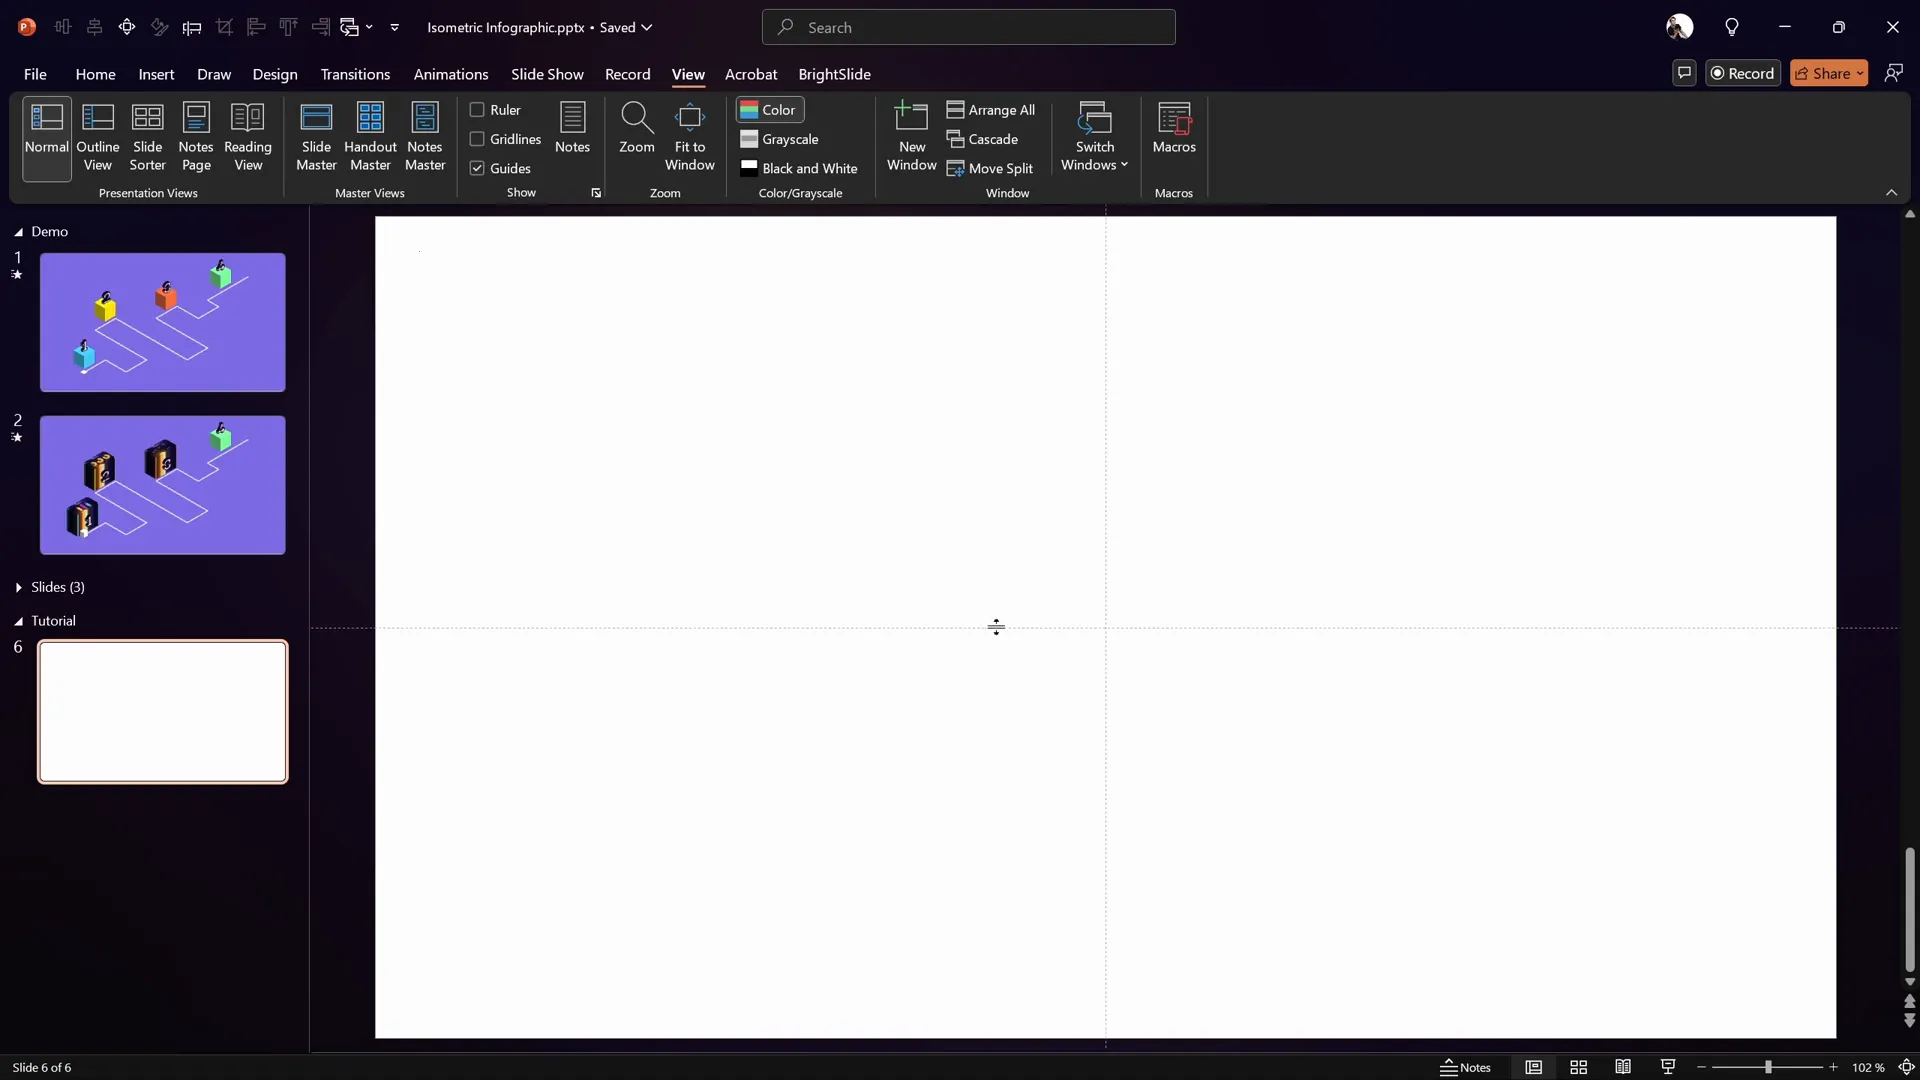
Before diving into the design, it’s important to set up your PowerPoint slide for precision and ease of use. Here’s how to prepare your workspace:
- Start with a fresh slide: Open a new blank slide with a white background to begin with a clean canvas.
- Enable guides and gridlines: Turn on the guides and gridlines to help you align your shapes precisely. These visual aids make it easier to create straight lines and consistent spacing.
- Set the slide background color: Choose a solid color background for your slide to enhance contrast with your infographic elements. In this tutorial, a beautiful purple shade is used (
#6B4C9A), but feel free to pick a color that matches your brand or theme.
These initial steps ensure that your infographic will be neat, balanced, and visually appealing. Now let’s move on to creating the key element of this infographic: the isometric roadmap.
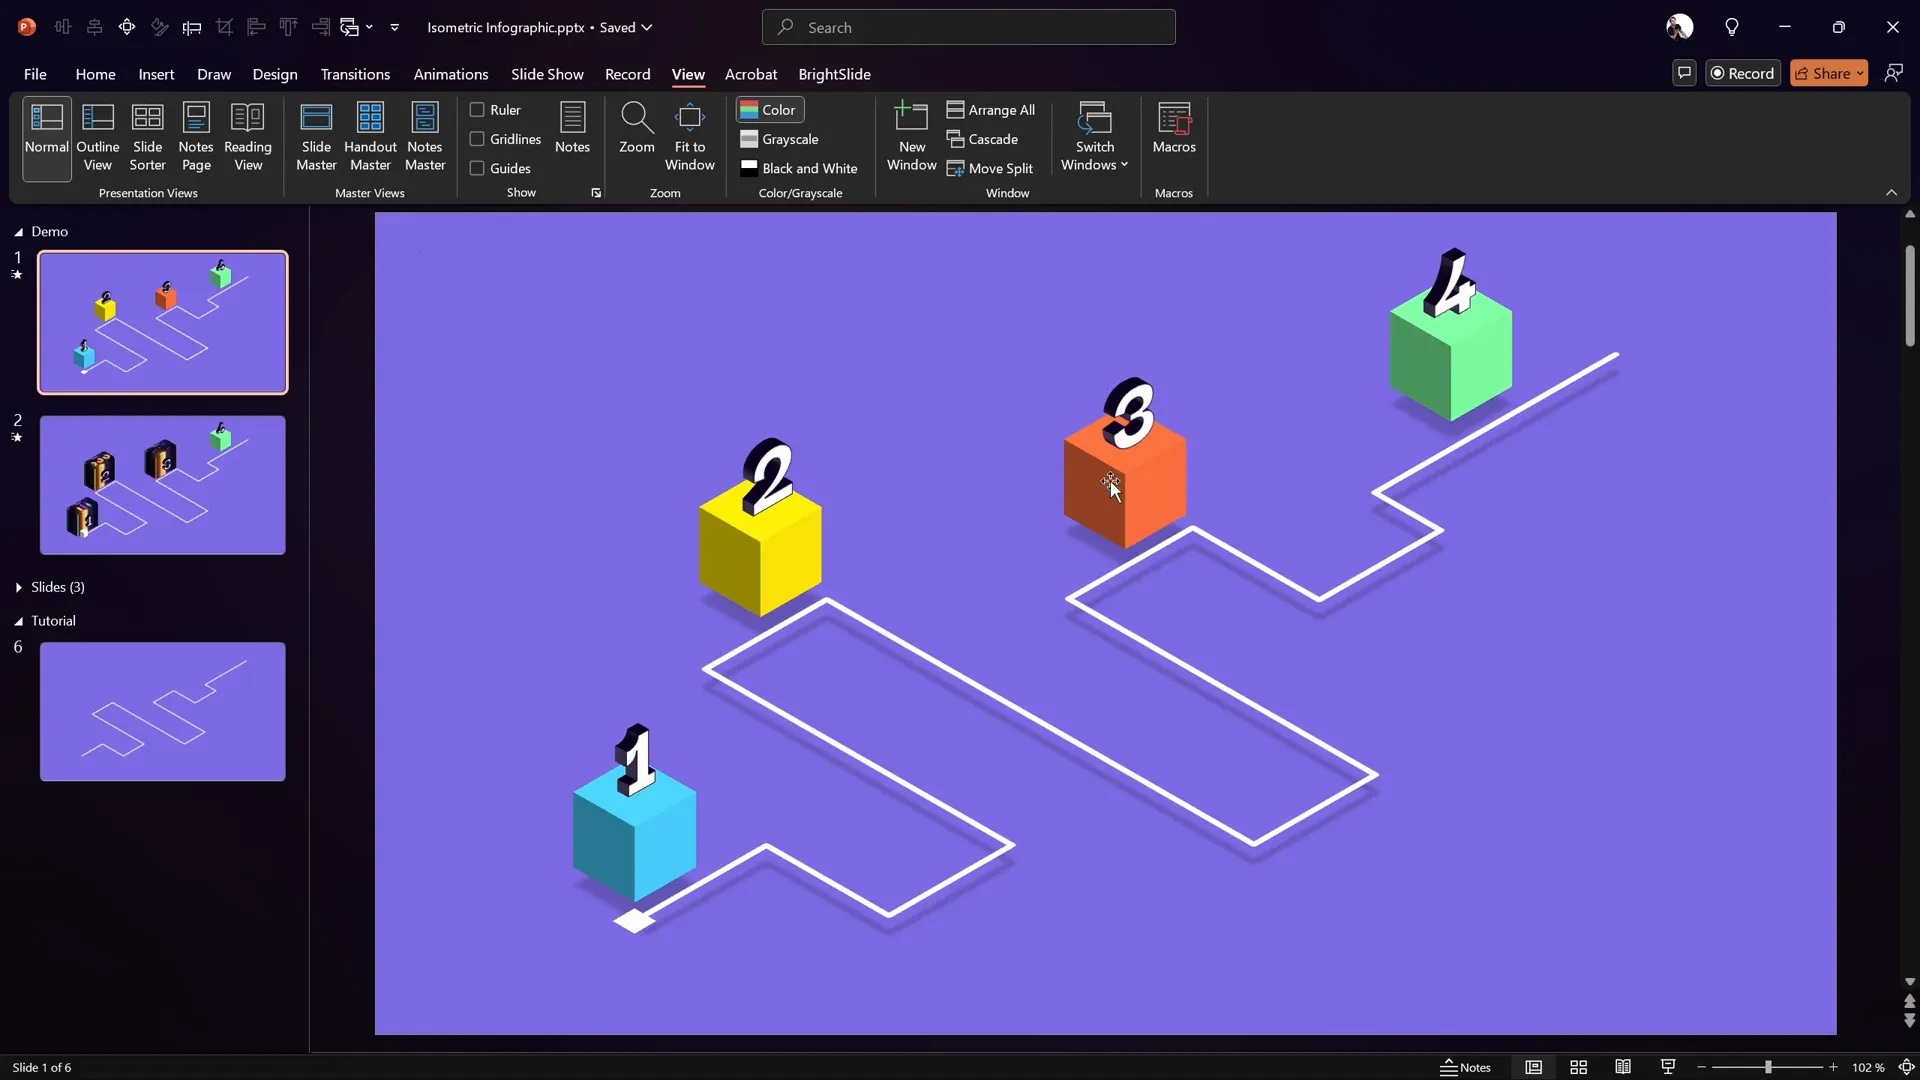
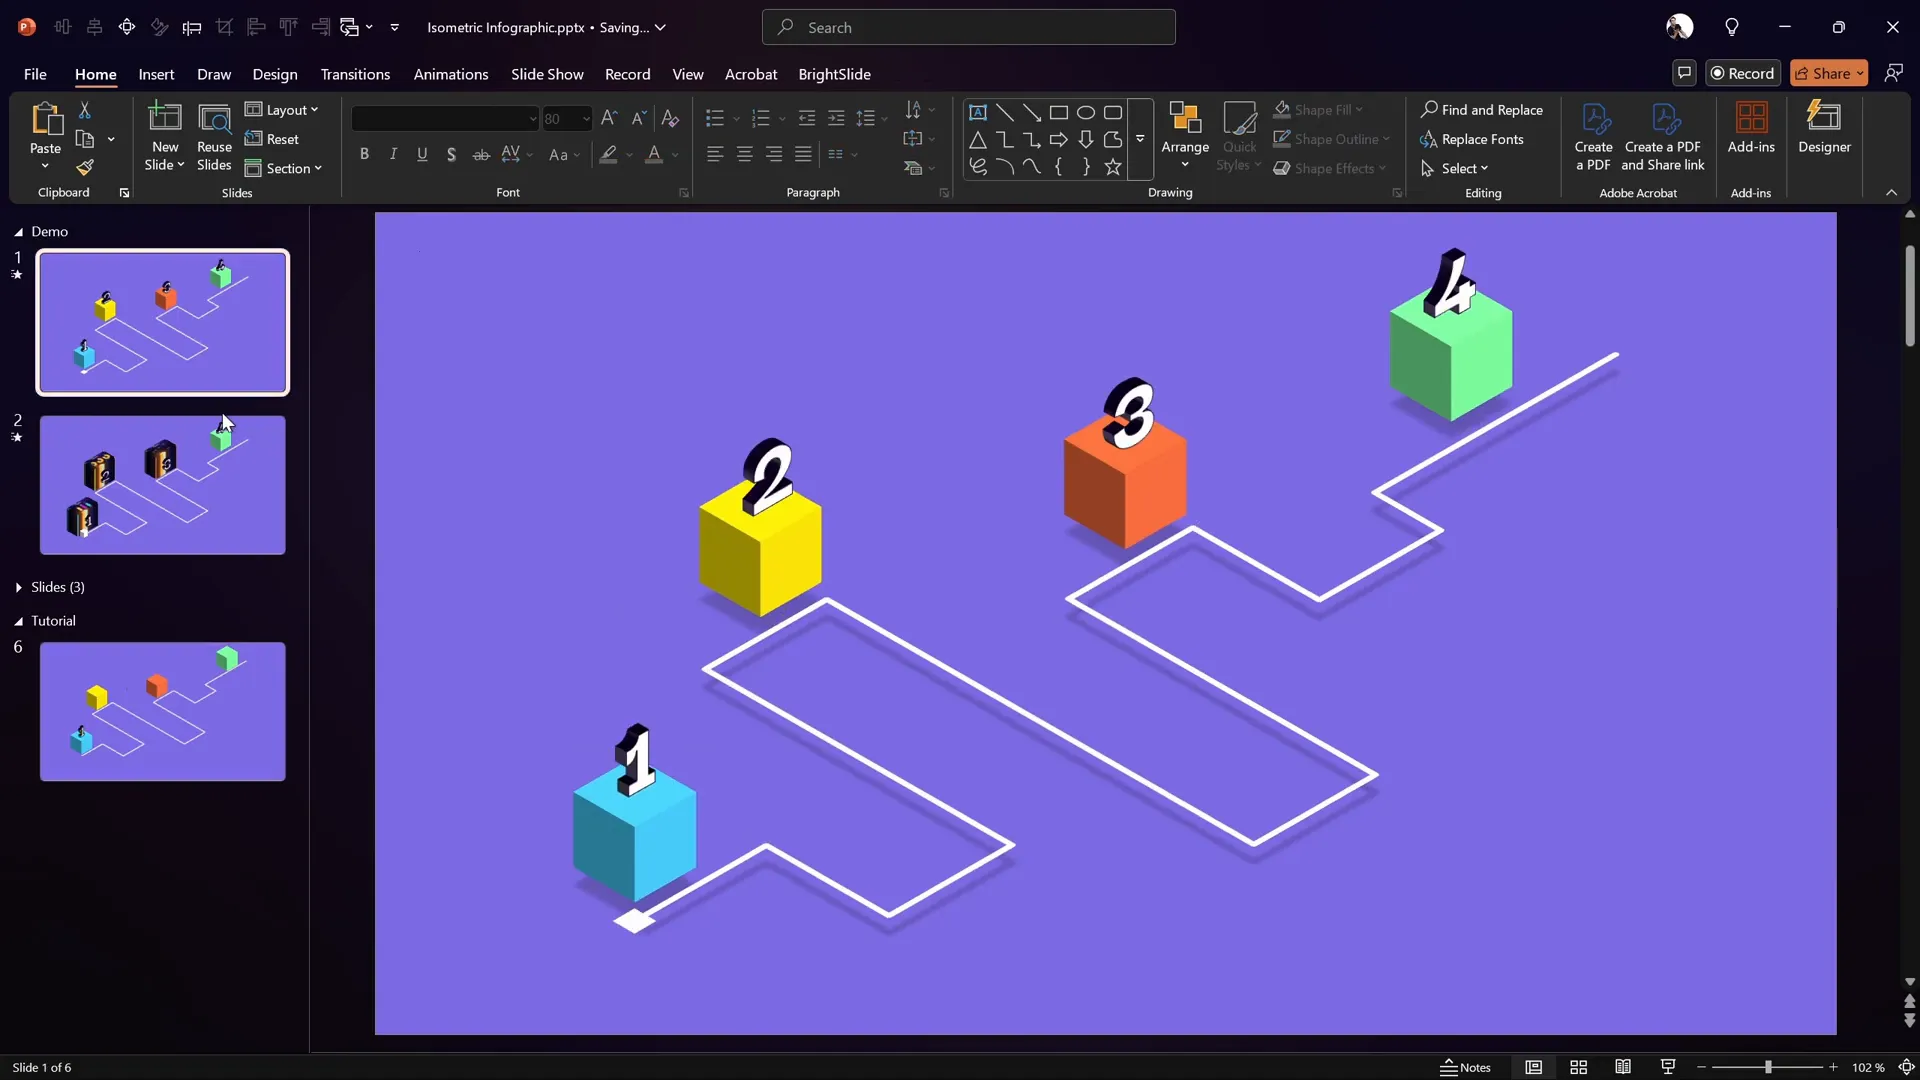
Creating the Isometric Roadmap
The roadmap is the backbone of the infographic, guiding the viewer’s eye through the visual story. Here’s a detailed process to create a custom isometric roadmap in PowerPoint:
Step 1: Draw the Roadmap Path
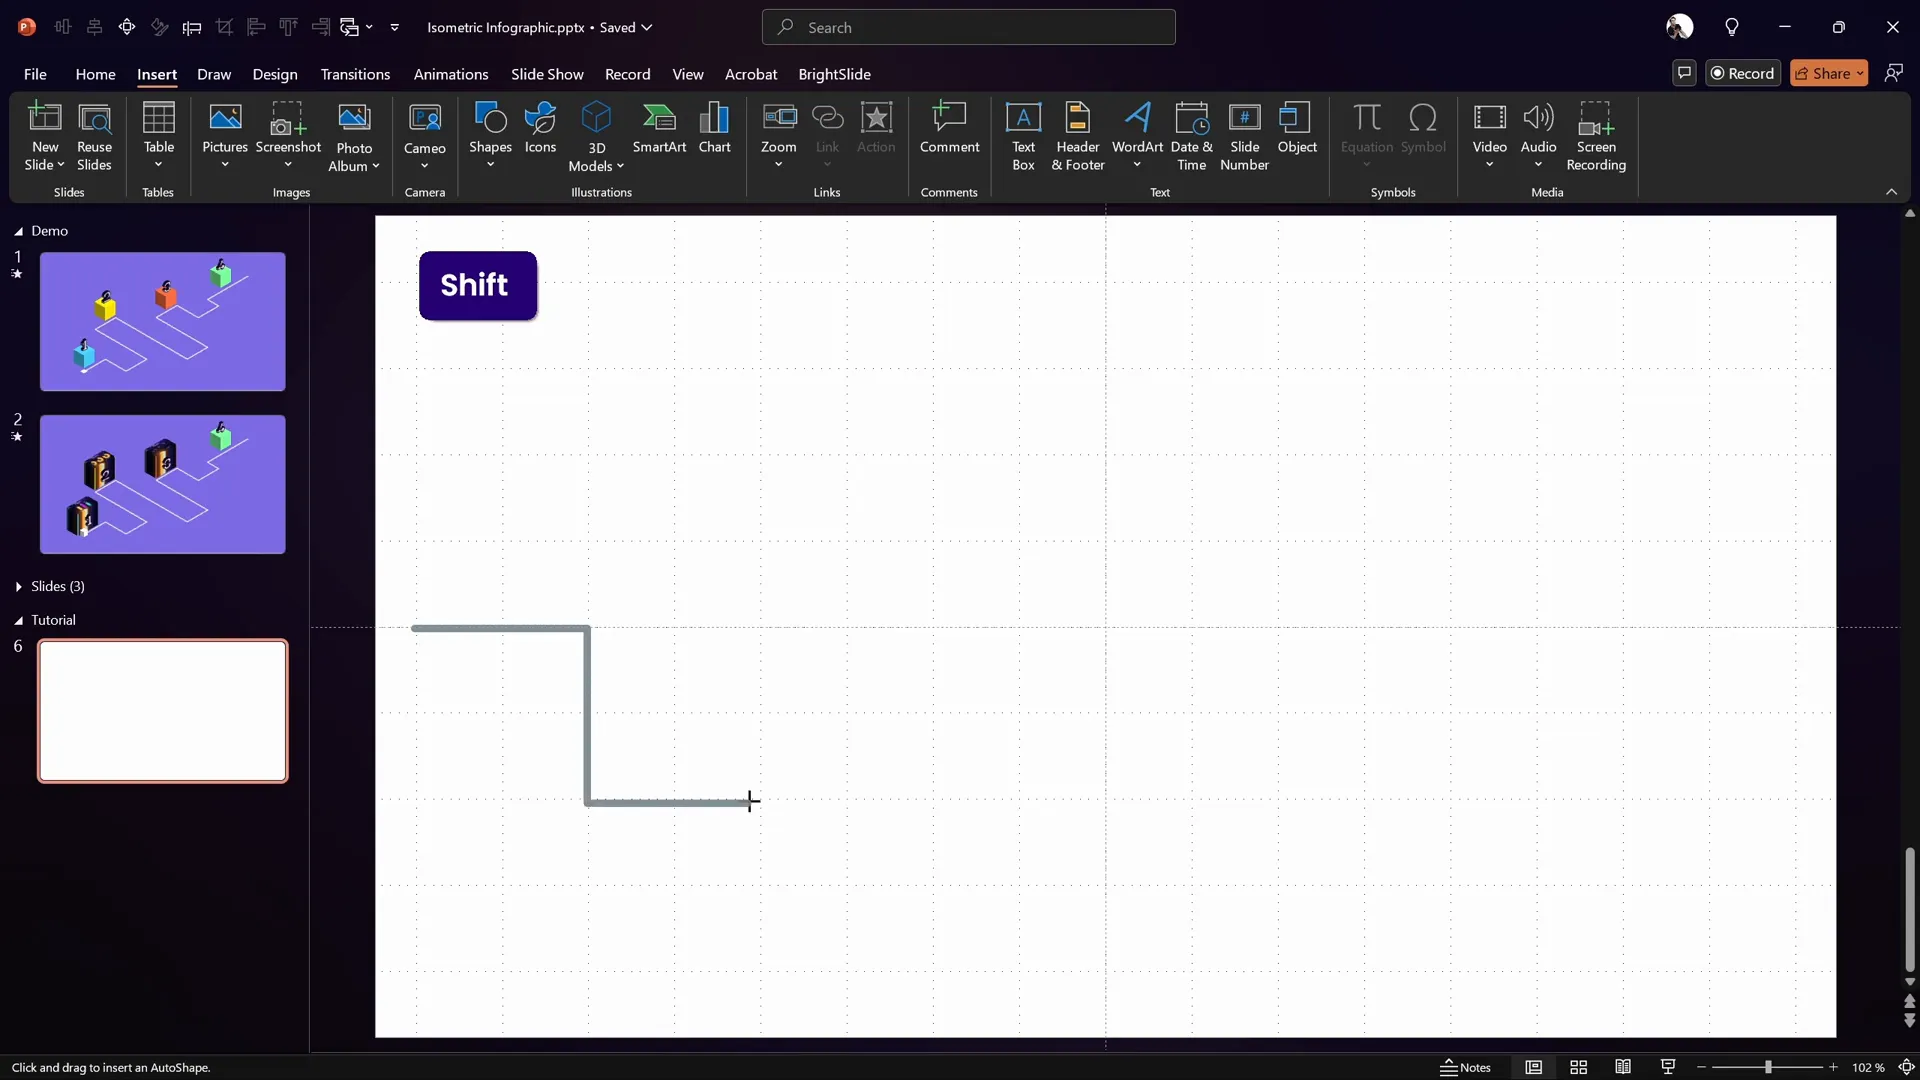
Use the Freeform Shape Tool to draw a custom path that resembles a roadmap:
- Click once to start your path on the left side of the slide.
- Hold down the Shift key to constrain your lines to perfect vertical or horizontal directions.
- Click to add points two grid squares to the right, then two squares down, then two squares right again, and finally five squares up, creating a zigzag path.
- Double-click at the end to finalize the shape.
Step 2: Format the Roadmap
After drawing the path, customize its appearance:
- Set the line width to 5 points for good visibility.
- Change the line color to white to contrast with the purple background.
- Adjust the line join and cap types to round for smooth corners and ends.
Step 3: Apply Isometric Rotation
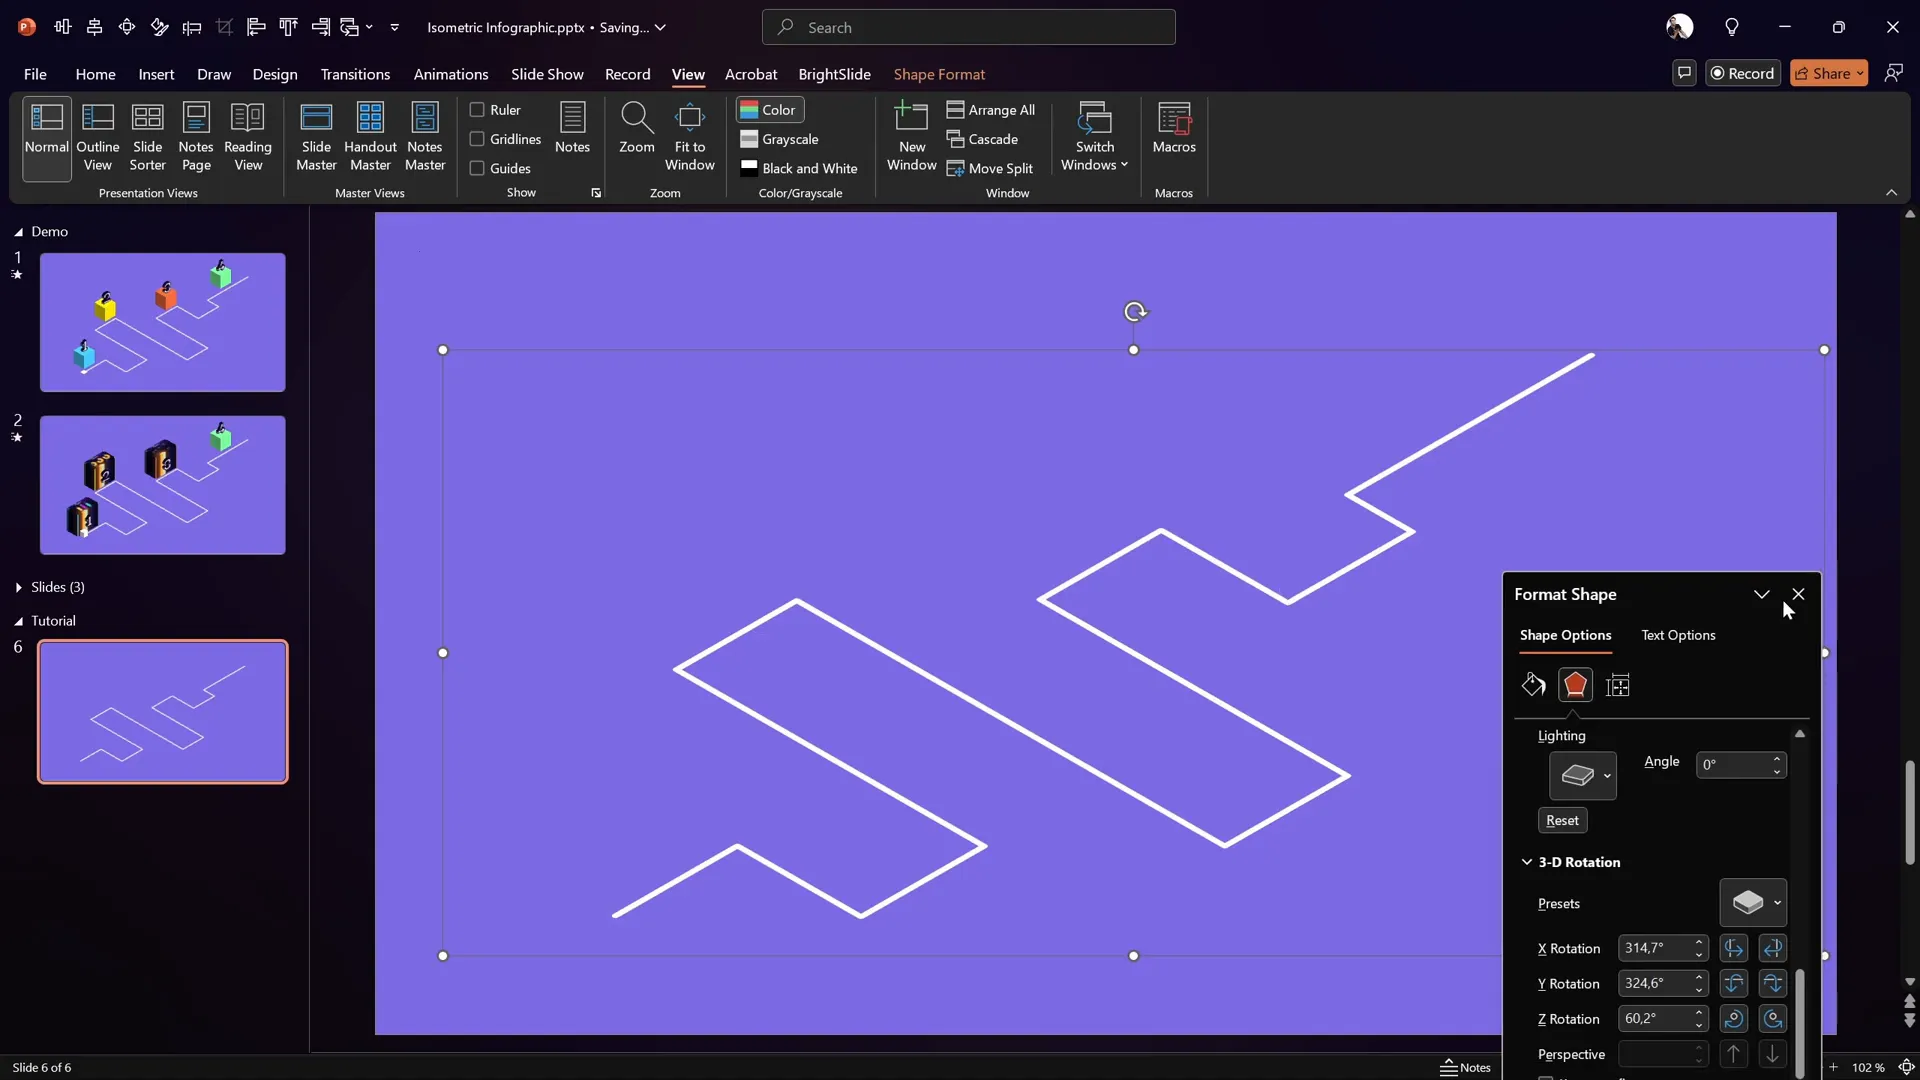
This is the magic touch that transforms the flat roadmap into an isometric 3D perspective:
- Open the Format Shape pane and go to 3D Rotation options.
- Select the preset called Isometric Top Up to apply the isometric effect.
- Position the roadmap anywhere on the slide as desired.
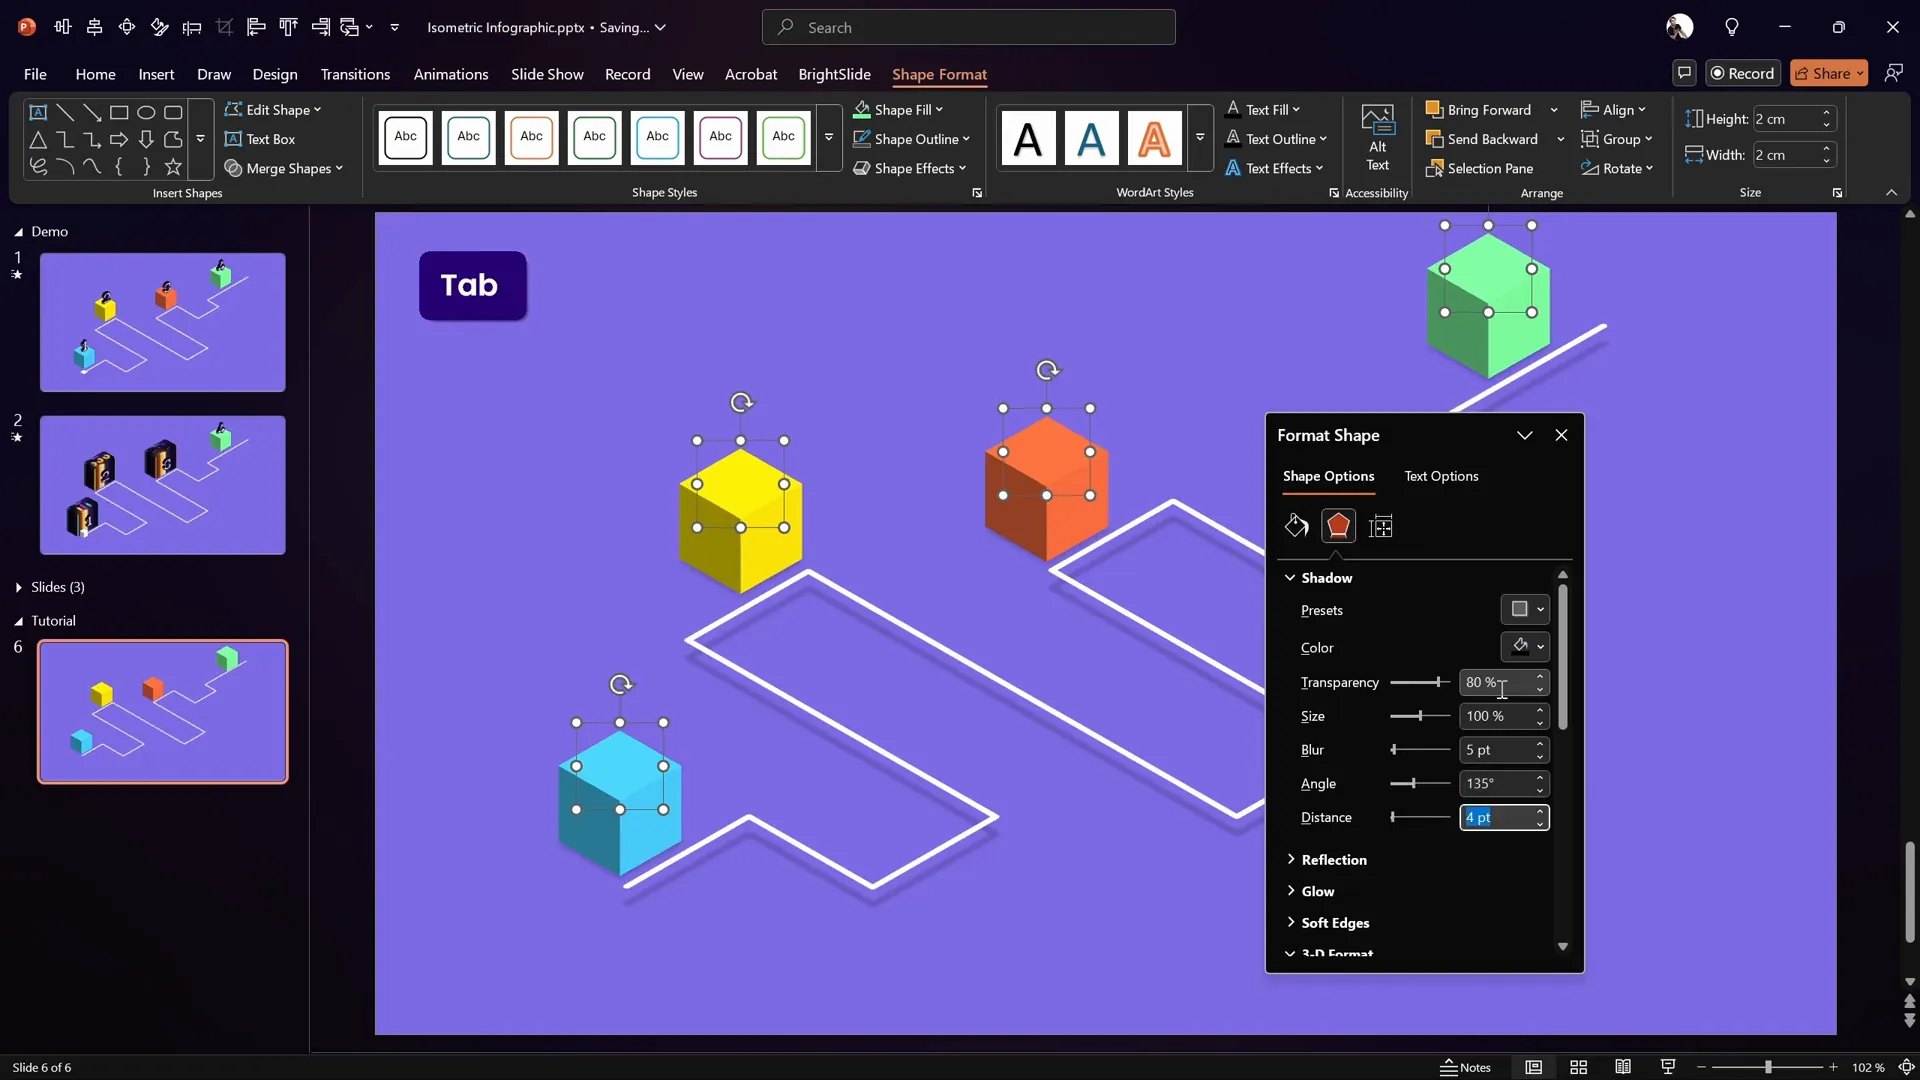
Step 4: Add a Subtle Shadow
To add depth and realism, apply a subtle shadow below the roadmap:
| Shadow Property | Value |
|---|---|
| Color | Black |
| Transparency | 80% |
| Blur | 5 points |
| Angle | 135° |
| Distance | 20 points |
With these steps, your roadmap will stand out beautifully on the slide, ready for the next layer of design: colorful 3D cubes.
Designing Colorful 3D Cubes
The cubes add vibrant accents and serve as anchor points for the floating numbers. They also reinforce the 3D isometric style. Here’s how to create them:
Step 1: Insert a Perfect Square
- Insert a rectangle shape and hold down the Shift key to ensure it’s a perfect square.
- Set its size precisely to 2 cm by 2 cm.
- Remove the outline (no line).
- Fill the square with a solid color (e.g., yellow for the first cube).
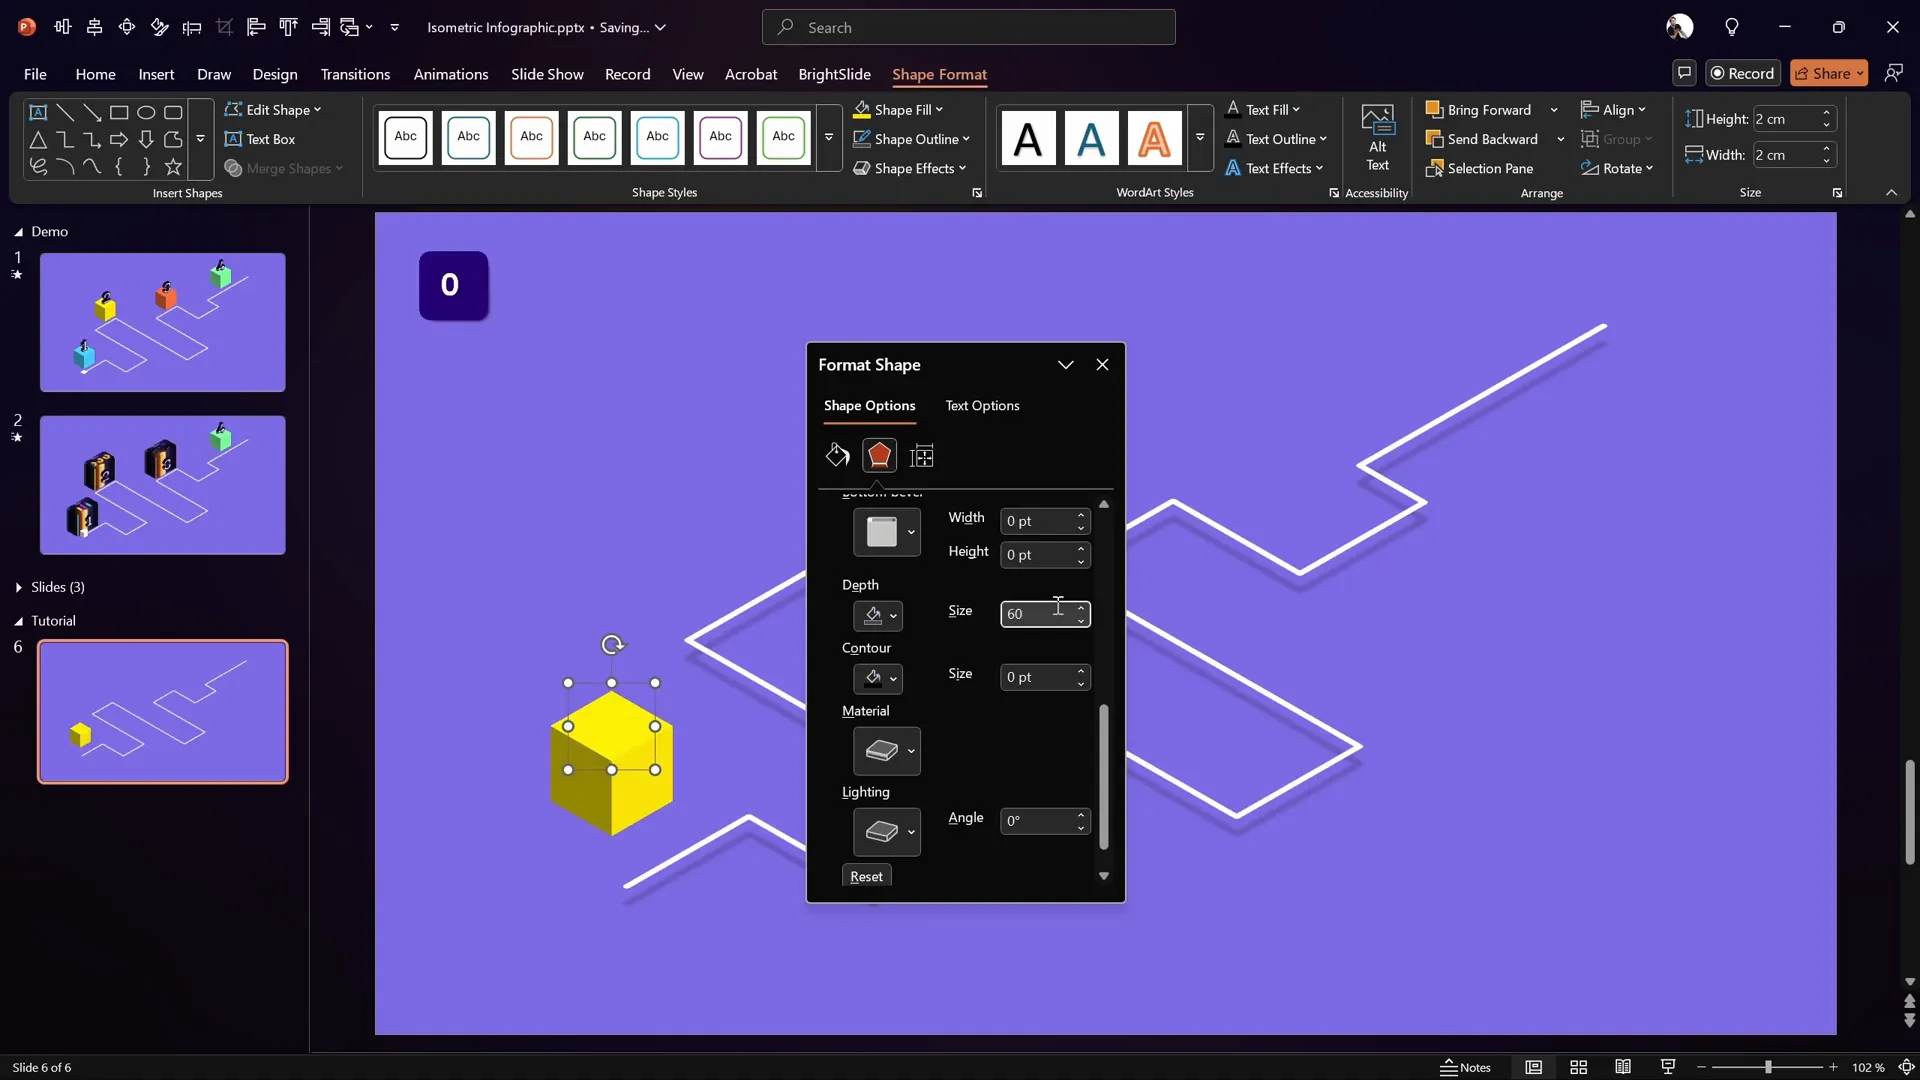
Step 2: Apply 3D Effects
- Apply the Isometric Top Up 3D rotation preset to the square.
- Open 3D formatting options and set the depth to 60 points to create a cube effect.
Step 3: Duplicate and Color Variations
- Hold down the Ctrl key and drag to make copies of the cube.
- Change the fill colors for variety, such as light blue, orange, and bright green.
- Group all cubes and apply the same subtle shadow as the roadmap for consistency.
- Send the cubes to the back layer so the roadmap is clearly visible on top.
The cubes provide a bold and colorful base for the infographic’s numbers, which we’ll add next.
Adding 3D Floating Numbers
The floating numbers add informative labels and enhance the visual interest of the infographic. Here’s how to create and style them:
Step 1: Insert Text Boxes with Numbers
- Insert a text box and type the number “1.”
- Use a clean, bold font such as Darker Grotesque with a font size of 80 pt for maximum impact.
Step 2: Add Outlines
- Go to the text options in the Format Shape pane.
- Add a solid black outline with a width of 0.75 points.
Step 3: Apply 3D Rotation and Depth
- Apply the Isometric Right Up 3D rotation preset for a dynamic angle.
- Add depth with a value of 10 points to give the number a subtle 3D effect.
Step 4: Position and Duplicate
- Position the number on top of the corresponding cube.
- Duplicate the text box and update the numbers as needed.
Once all numbers are positioned, you’re ready to animate them for a floating effect.
Animating the Floating Numbers
Animating the numbers to float creates a lively and modern feel for the infographic. Follow these steps to add smooth floating animations:
Step 1: Apply Motion Path Animation
- Select the first number text box.
- Go to the Animations tab and select the Line motion path animation.
- Set the direction of the path upwards.
- Adjust the length of the motion path by dragging the red endpoint to reduce the travel distance for subtle movement.
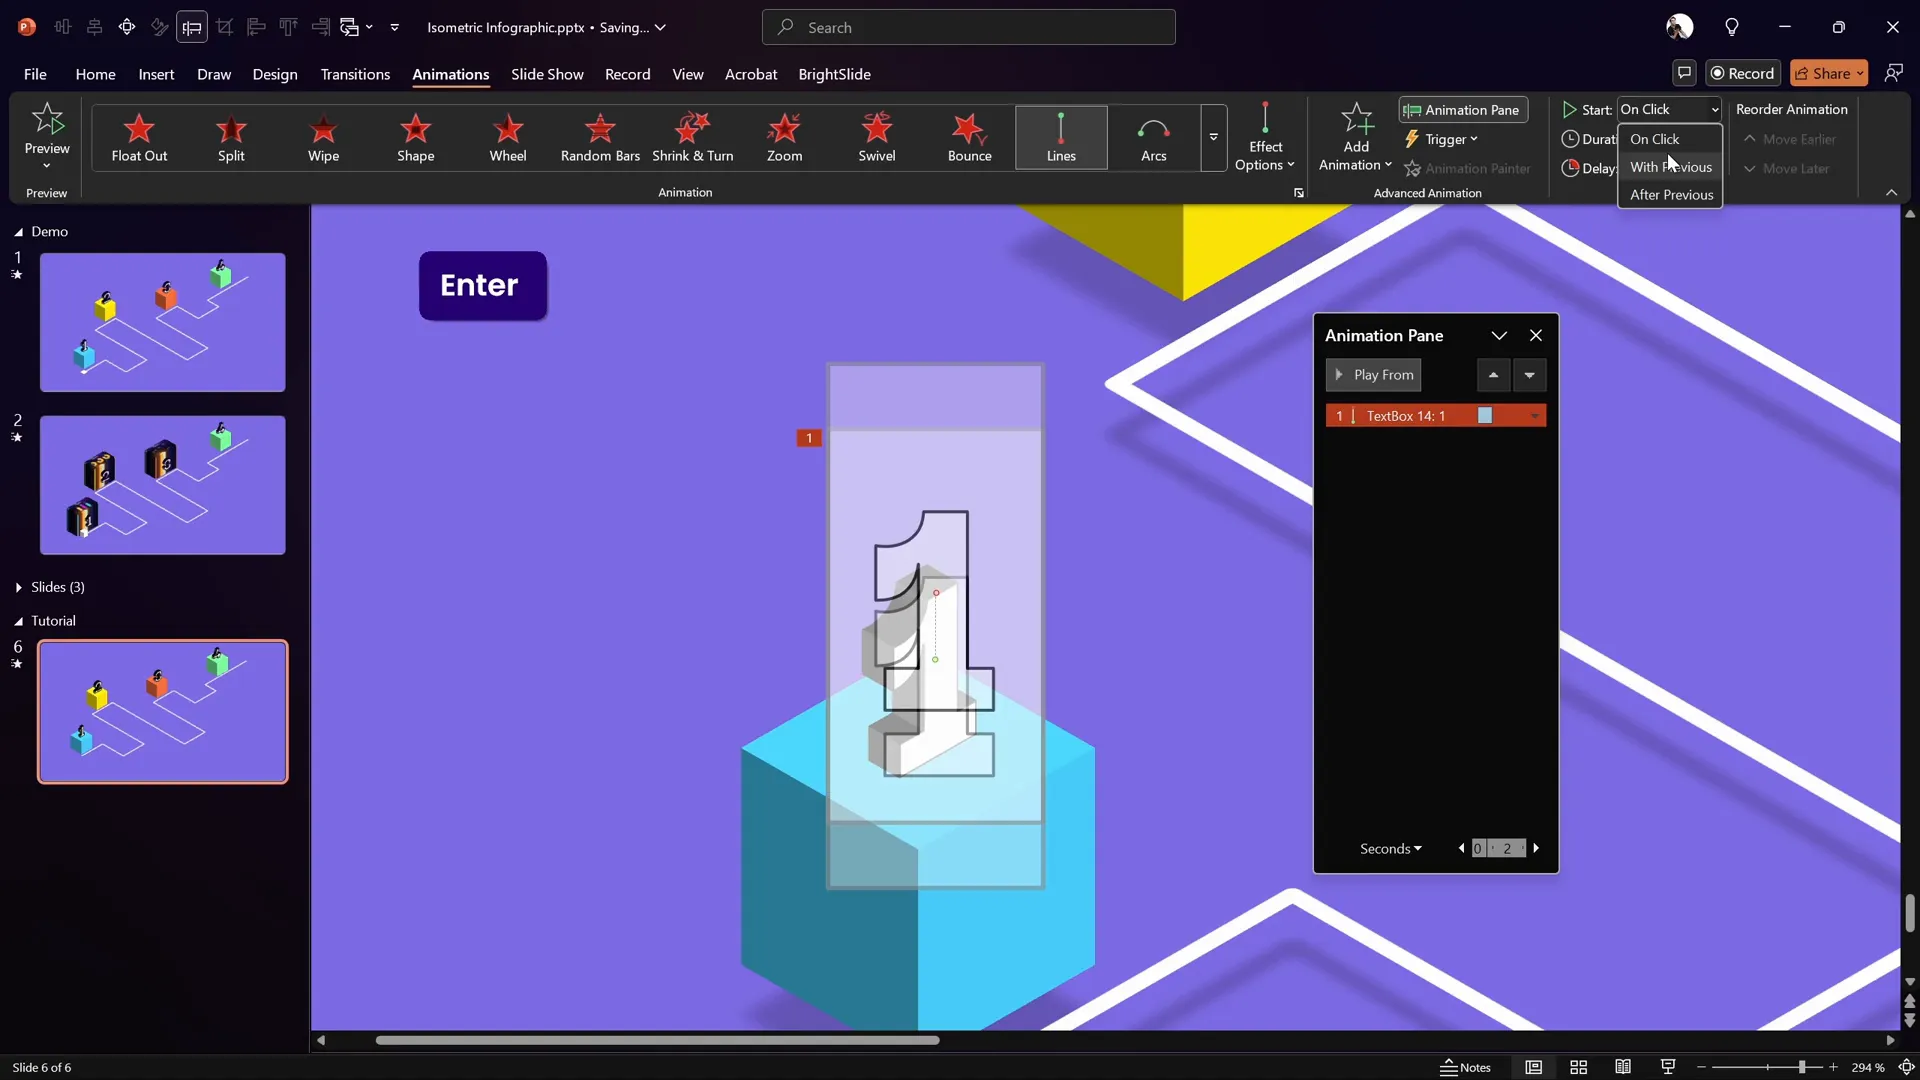
Step 2: Configure Animation Settings
- Open the Animation Pane for detailed control.
- Set the duration to 1 second.
- Set the animation to start With Previous for automatic playback.
- Enable Smooth Start and Smooth End for fluid motion.
- Enable Auto Reverse so the number floats up and down.
- Set the animation to repeat Until End of Slide for continuous floating.
Step 3: Copy Animation to Other Numbers
- Use the Animation Painter tool to copy the floating animation to the rest of the numbers.
- Double-click the Animation Painter for multiple pastes, then click all other numbers.
- Click the Animation Painter again to deactivate it.
Step 4: Add Slide Transition
- Add a Fade transition to the slide for a polished entry effect.
These animations bring your infographic to life with smooth floating numbers that complement the 3D cubes and roadmap.
Animating the Square to Follow the Roadmap
The final animated element is a small white square that travels along the roadmap path, simulating movement or progress.
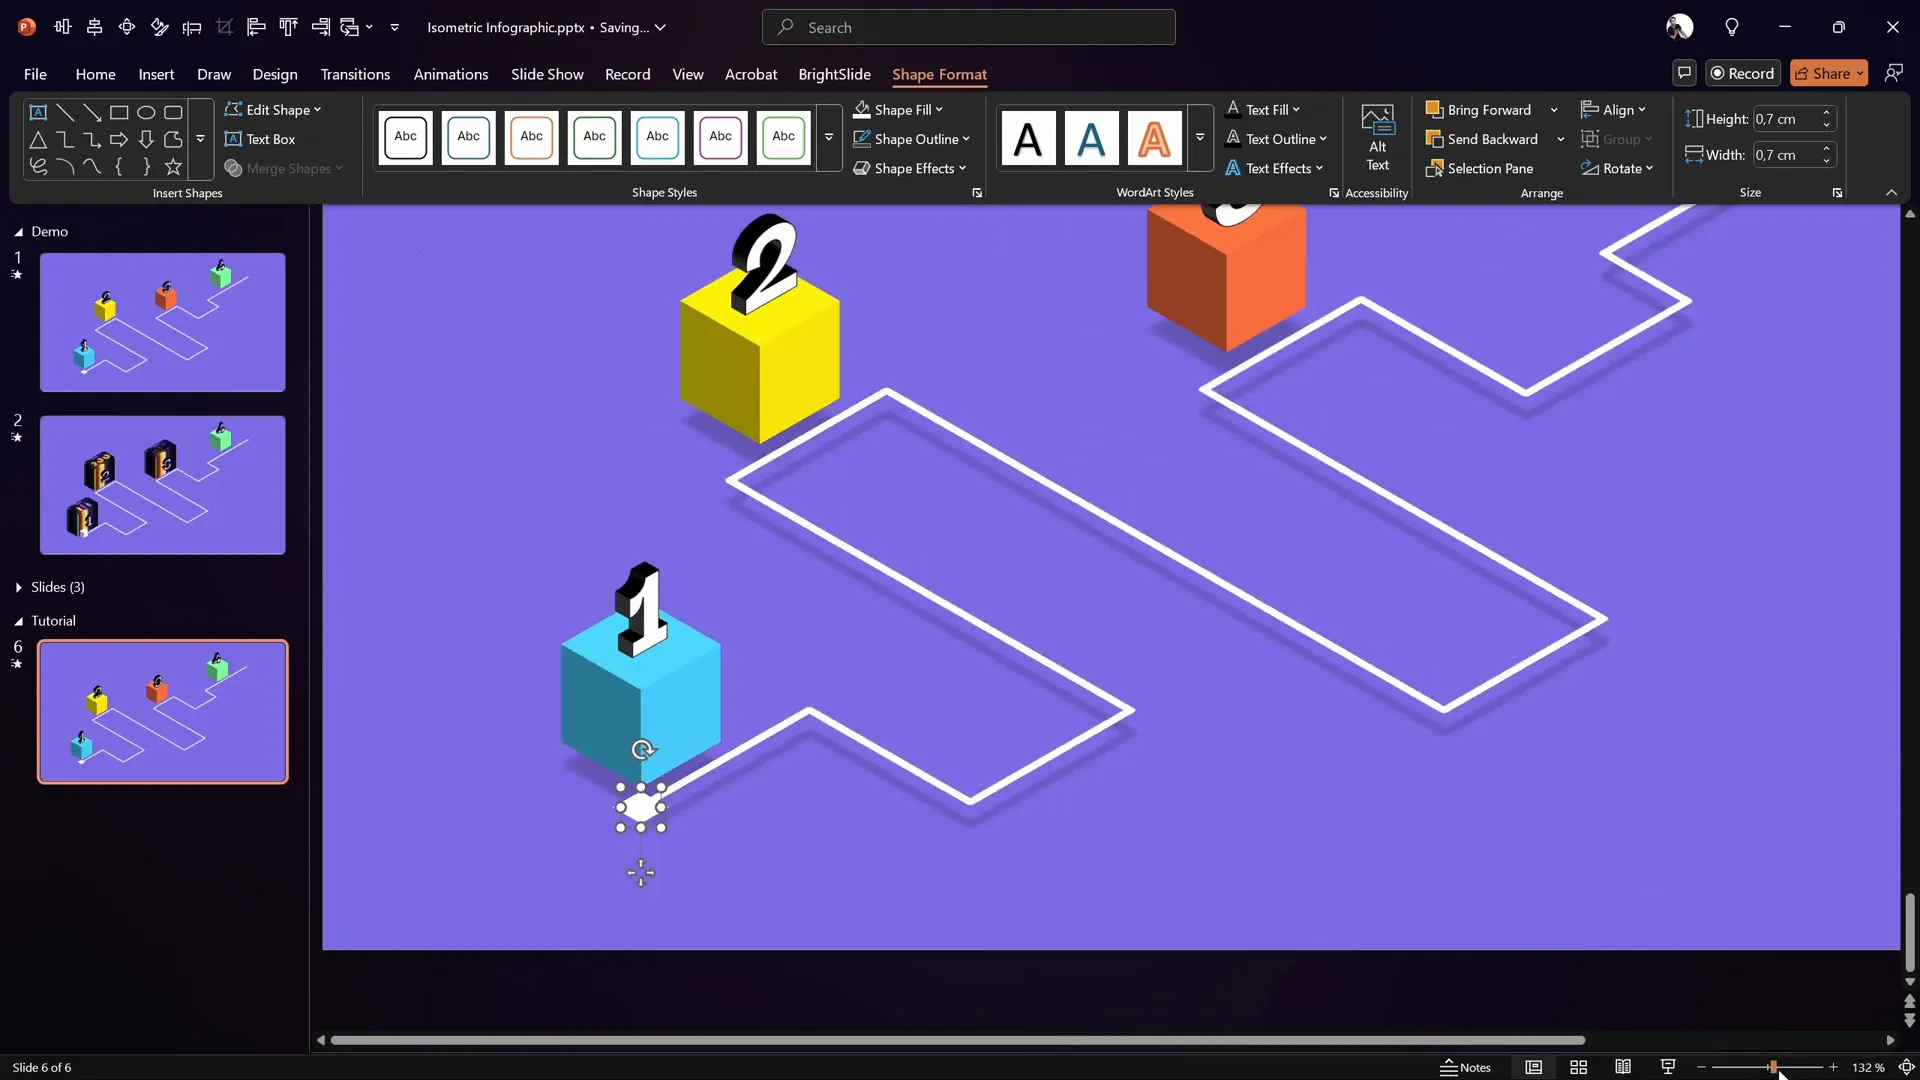
Step 1: Create the Animated Square
- Insert a small square shape, holding Shift to keep it perfect.
- Set its size to 0.7 cm by 0.7 cm.
- Fill the square with white and remove the outline.
- Apply the Isometric Top Up 3D rotation preset to match the roadmap’s perspective.
- Remove any shadow effects for clarity.
- Bring the square to the front of the layers so it appears above the cubes and roadmap.
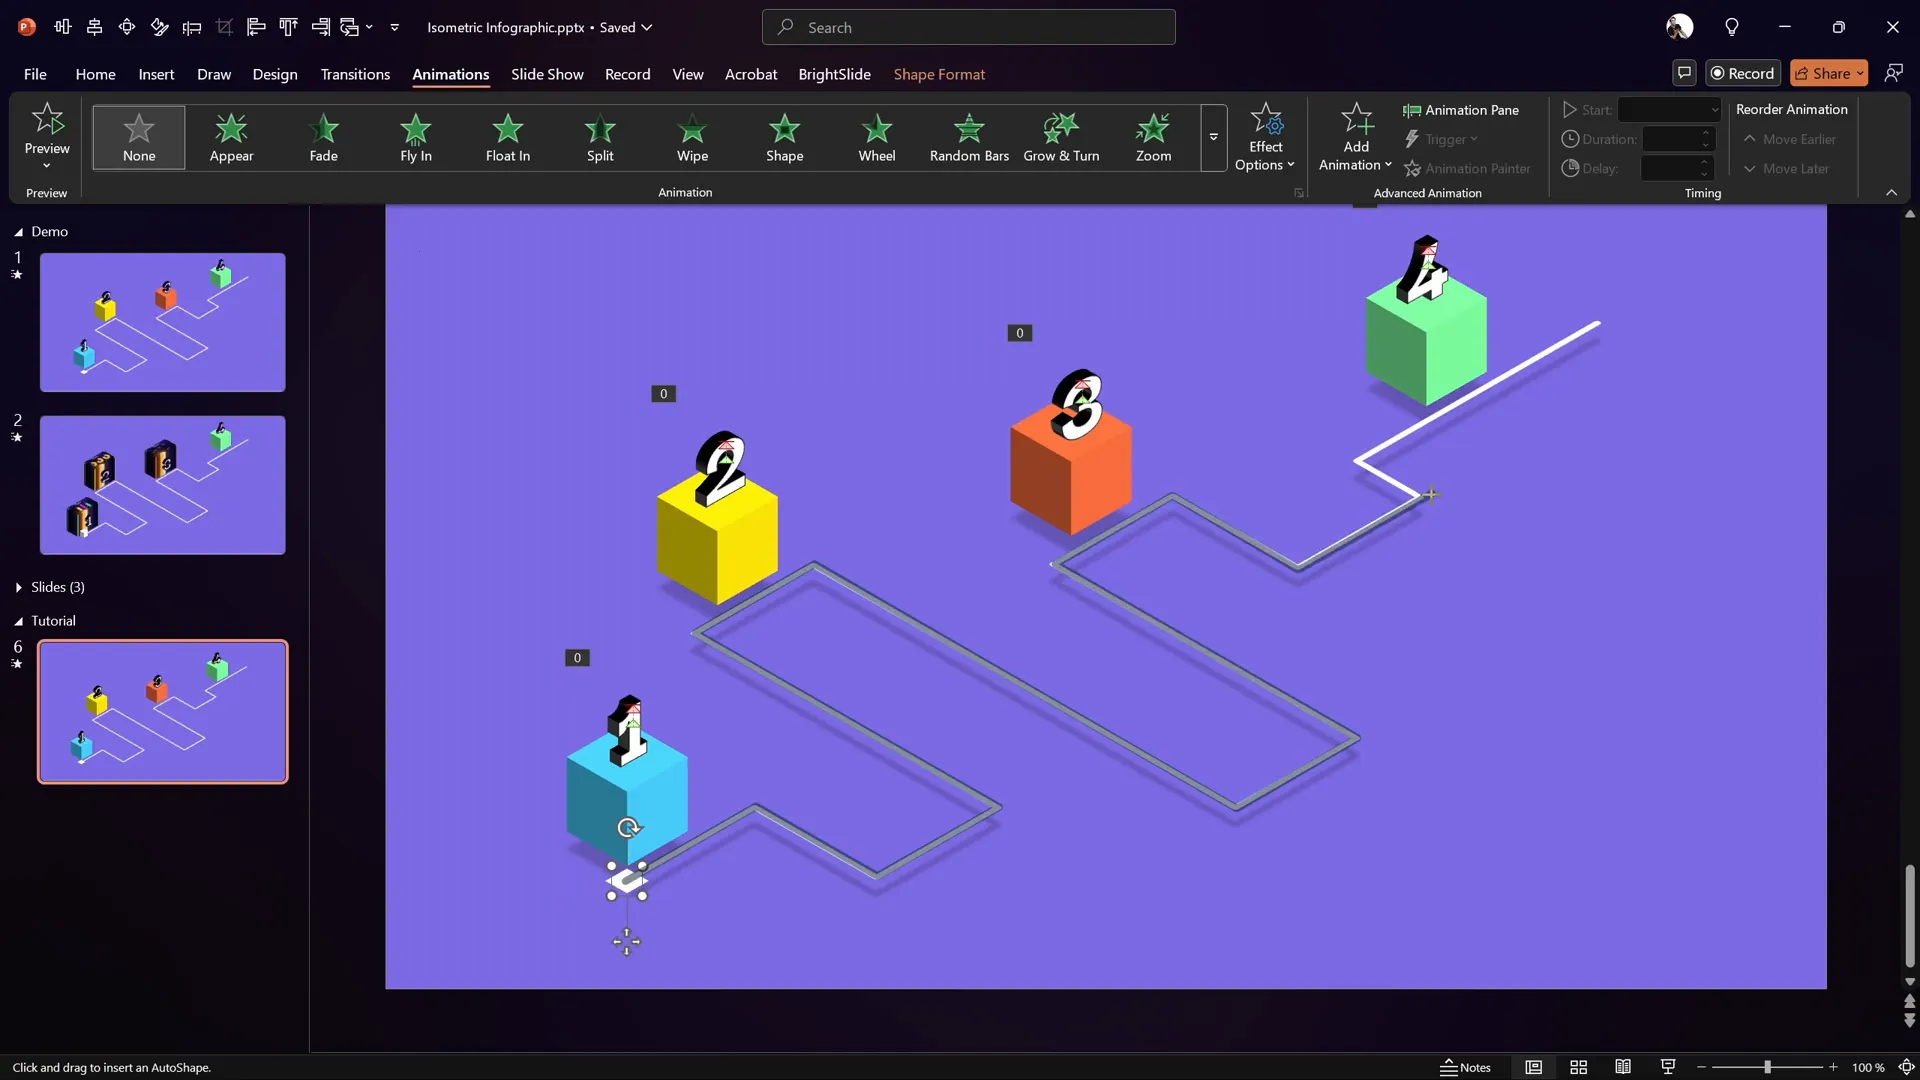
Step 2: Draw a Custom Motion Path
- Select the square and go to Add Animation.
- Choose the Custom Motion Path animation.
- Click once in the center of the square to start the path.
- Click on each corner point of the roadmap path to trace the exact route.
- Double-click at the end point to complete the path.
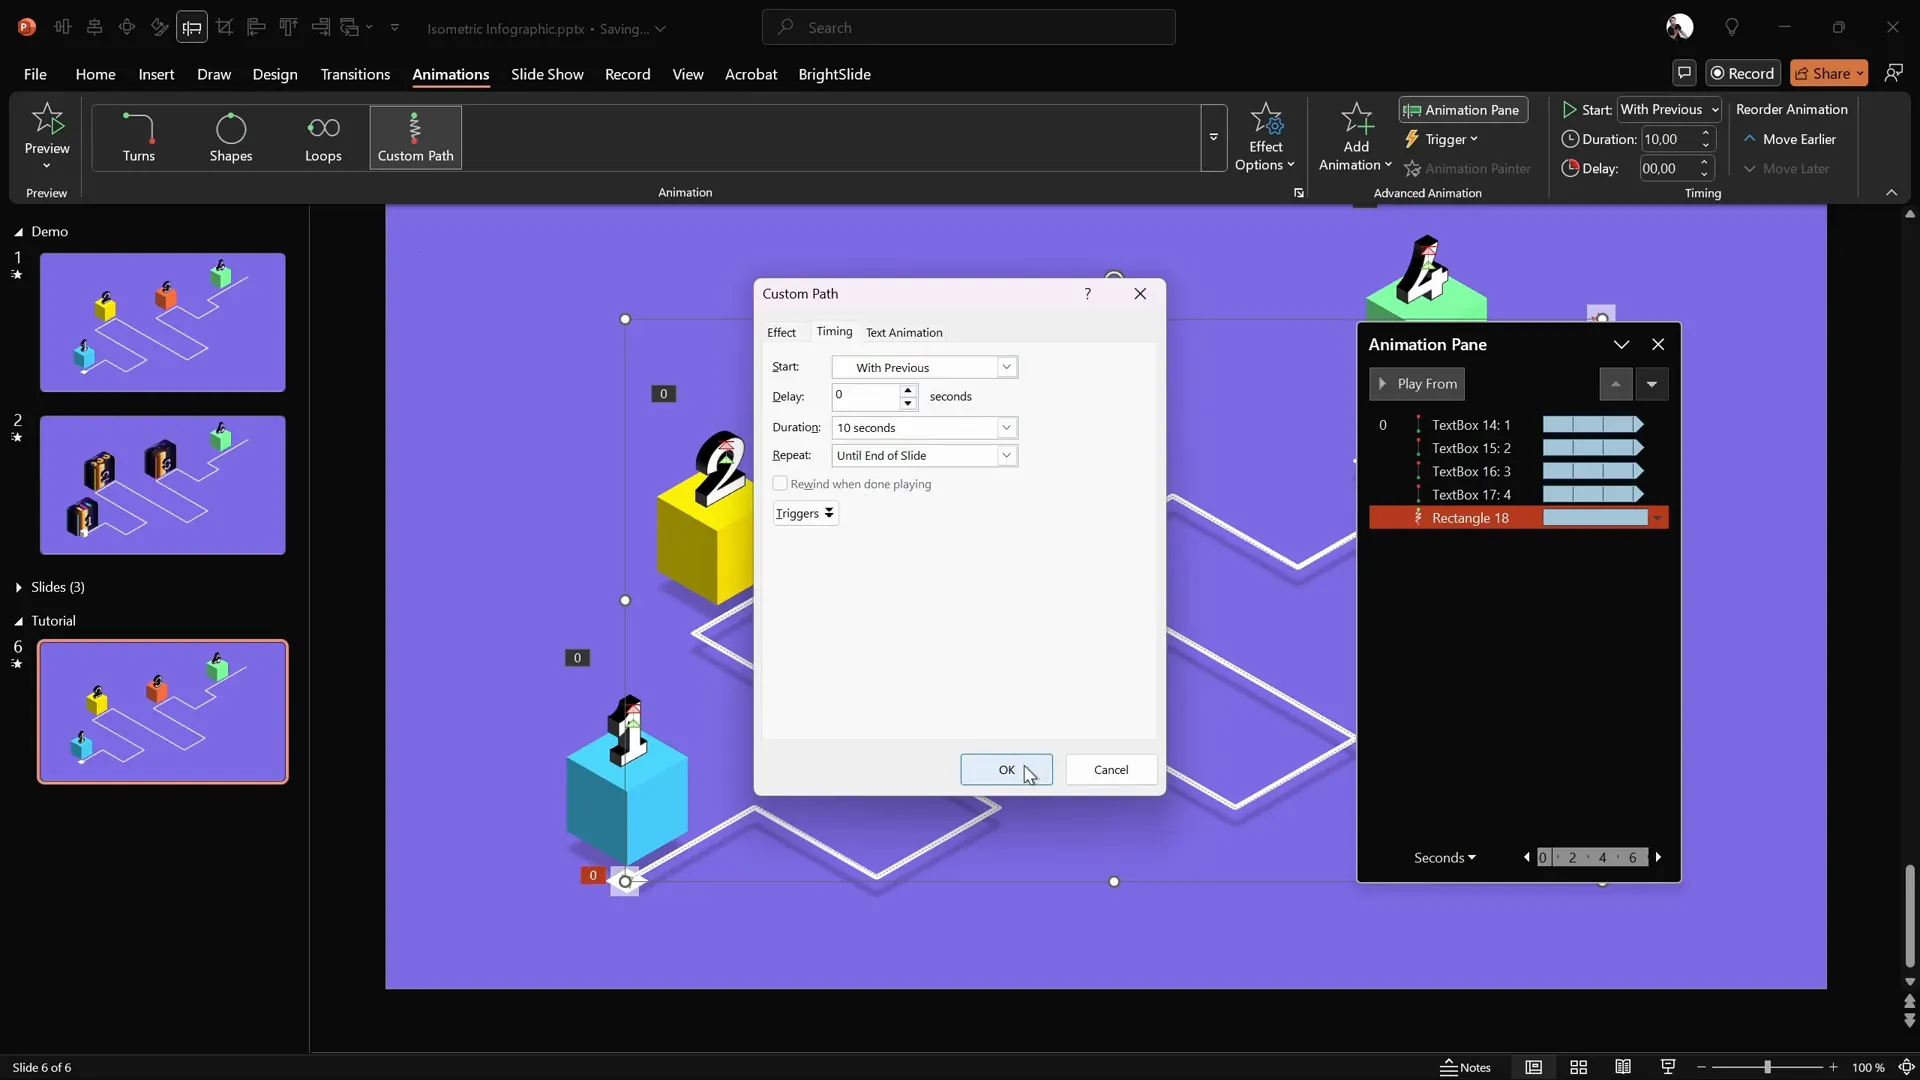
Step 3: Adjust Animation Settings
- In the Animation Pane, set the animation to start With Previous.
- Set the duration to 10 seconds for smooth travel.
- Remove Smooth Start and Smooth End to keep consistent speed.
- Disable Auto Reverse.
- Set the animation to repeat Until End of Slide for continuous looping.
When played, the small square smoothly follows the isometric roadmap, restarting the journey upon completion. This adds a dynamic flow to your infographic.
Enhancing Your Slide with Clickable Zoom
Beyond the animated infographic itself, you can take your slide to the next level by adding clickable slide zooms. This interactive feature allows your audience to click on parts of the infographic and zoom into detailed slides for deeper information.
While this tutorial focuses on the animated infographic, advanced users can learn to implement clickable slide zooms through resources such as the PowerPoint Animation Mastery course offered by the creator of this tutorial.
Adding clickable slide zooms turns your infographic into an interactive dashboard, perfect for presentations that require exploration of complex data or processes.
Frequently Asked Questions (FAQ)
What is an isometric roadmap infographic?
An isometric roadmap infographic is a visual representation of a journey or process designed using isometric projection techniques. This style gives a 3D effect while maintaining equal scale along all axes, creating a modern, clean look ideal for presentations.
Can I create this animated infographic in older versions of PowerPoint?
Most features used in this tutorial, including 3D rotation presets and motion path animations, are available in PowerPoint 2016 and later. If you use an older version, some steps may not be possible or may require workarounds.
How can I customize the colors and shapes?
All colors, sizes, and shapes in this infographic are fully customizable. You can change fill colors, line widths, fonts, and 3D settings to match your brand or presentation style.
Is it possible to add more elements to the roadmap?
Absolutely. You can add icons, text labels, or additional shapes to enrich your roadmap. Just keep in mind to maintain balance and clarity for the best visual impact.
How do I export the animated infographic?
You can save your PowerPoint presentation as a standard PPTX file to preserve animations. If you want to share a static version, export as a PDF, but animations will not play in PDF format.
Conclusion
Creating a captivating PowerPoint infographic doesn’t require advanced graphic design software. With PowerPoint’s built-in tools, you can craft professional, animated isometric roadmaps that engage your audience and visually communicate your message.
In this tutorial, we covered how to:
- Set up your slide with guides and gridlines for precise design.
- Create a custom roadmap path using the freeform shape tool.
- Apply isometric 3D rotation and subtle shadows for depth.
- Design colorful 3D cubes as anchor points.
- Add stylish 3D floating numbers with outlines.
- Animate the numbers to float smoothly.
- Animate a small square to follow the roadmap path with a custom motion path.
- Enhance interactivity with clickable slide zooms (advanced).
This step-by-step guide equips you with the skills to build your own modern infographic in PowerPoint, perfect for business presentations, reports, or educational content.
For those interested in mastering PowerPoint animation further, consider exploring the PowerPoint Animation Mastery course where you can access extended lessons and downloadable tutorial slides.
Now, open PowerPoint and start creating your own animated infographic masterpiece!


