
If you’re looking to elevate your PowerPoint presentation skills and create visually stunning infographic slides, you’ve come to the right place. This comprehensive guide will walk you through the process of designing an impressive animated roadmap infographic in PowerPoint, from the initial design phase to adding dynamic animations that captivate your audience.
Whether you’re preparing a project timeline, a business roadmap, or a visual journey of milestones, infographic PowerPoint presentations are powerful tools to communicate complex information clearly and engagingly. In this article, we’ll explore how to harness the power of external design tools like Figma and seamlessly integrate your designs into PowerPoint, complete with custom animations.
Table of Contents
- Why Use Infographic PowerPoint Presentations?
- Designing the Roadmap Shape in Figma
- Importing and Customizing the Roadmap in PowerPoint
- Adding Road Details: Dashed Lines, Outline, and Shadow
- Creating Pins for Roadmap Milestones
- Animating the Roadmap Elements
- Animating the Driving Car Following the Road
- Advanced Tips: Slide Zooms for Interactive Presentations
- Frequently Asked Questions (FAQ)
- Conclusion
Why Use Infographic PowerPoint Presentations?
Infographic PowerPoint presentations combine the power of visual storytelling with structured data to make your message more compelling and easier to understand. Roadmap infographics, in particular, are popular for depicting timelines, project phases, or strategic plans.
- Visual Clarity: Infographics simplify complex information, making it digestible at a glance.
- Audience Engagement: Interactive and animated infographics keep viewers interested and focused.
- Professional Appeal: Well-designed visuals improve the perceived professionalism of your presentation.
- Memorability: Visual aids help your audience remember key points long after the presentation.
Creating such infographics directly in PowerPoint can be challenging due to limited vector drawing capabilities. This is where combining PowerPoint with external design tools like Figma becomes a game-changer.
Designing the Roadmap Shape in Figma
To create a smooth, curvy roadmap shape that looks professional and polished, you can use Figma, a free online design tool well-suited for vector illustrations and infographic design.
Here’s how to get started:
Step 1: Setting Up Your Figma Workspace
- Log in to your Figma account at figma.com. If you don’t have an account, signing up is free and easy.
- Create a new file by clicking the blue button and selecting a destination folder (e.g., Drafts).
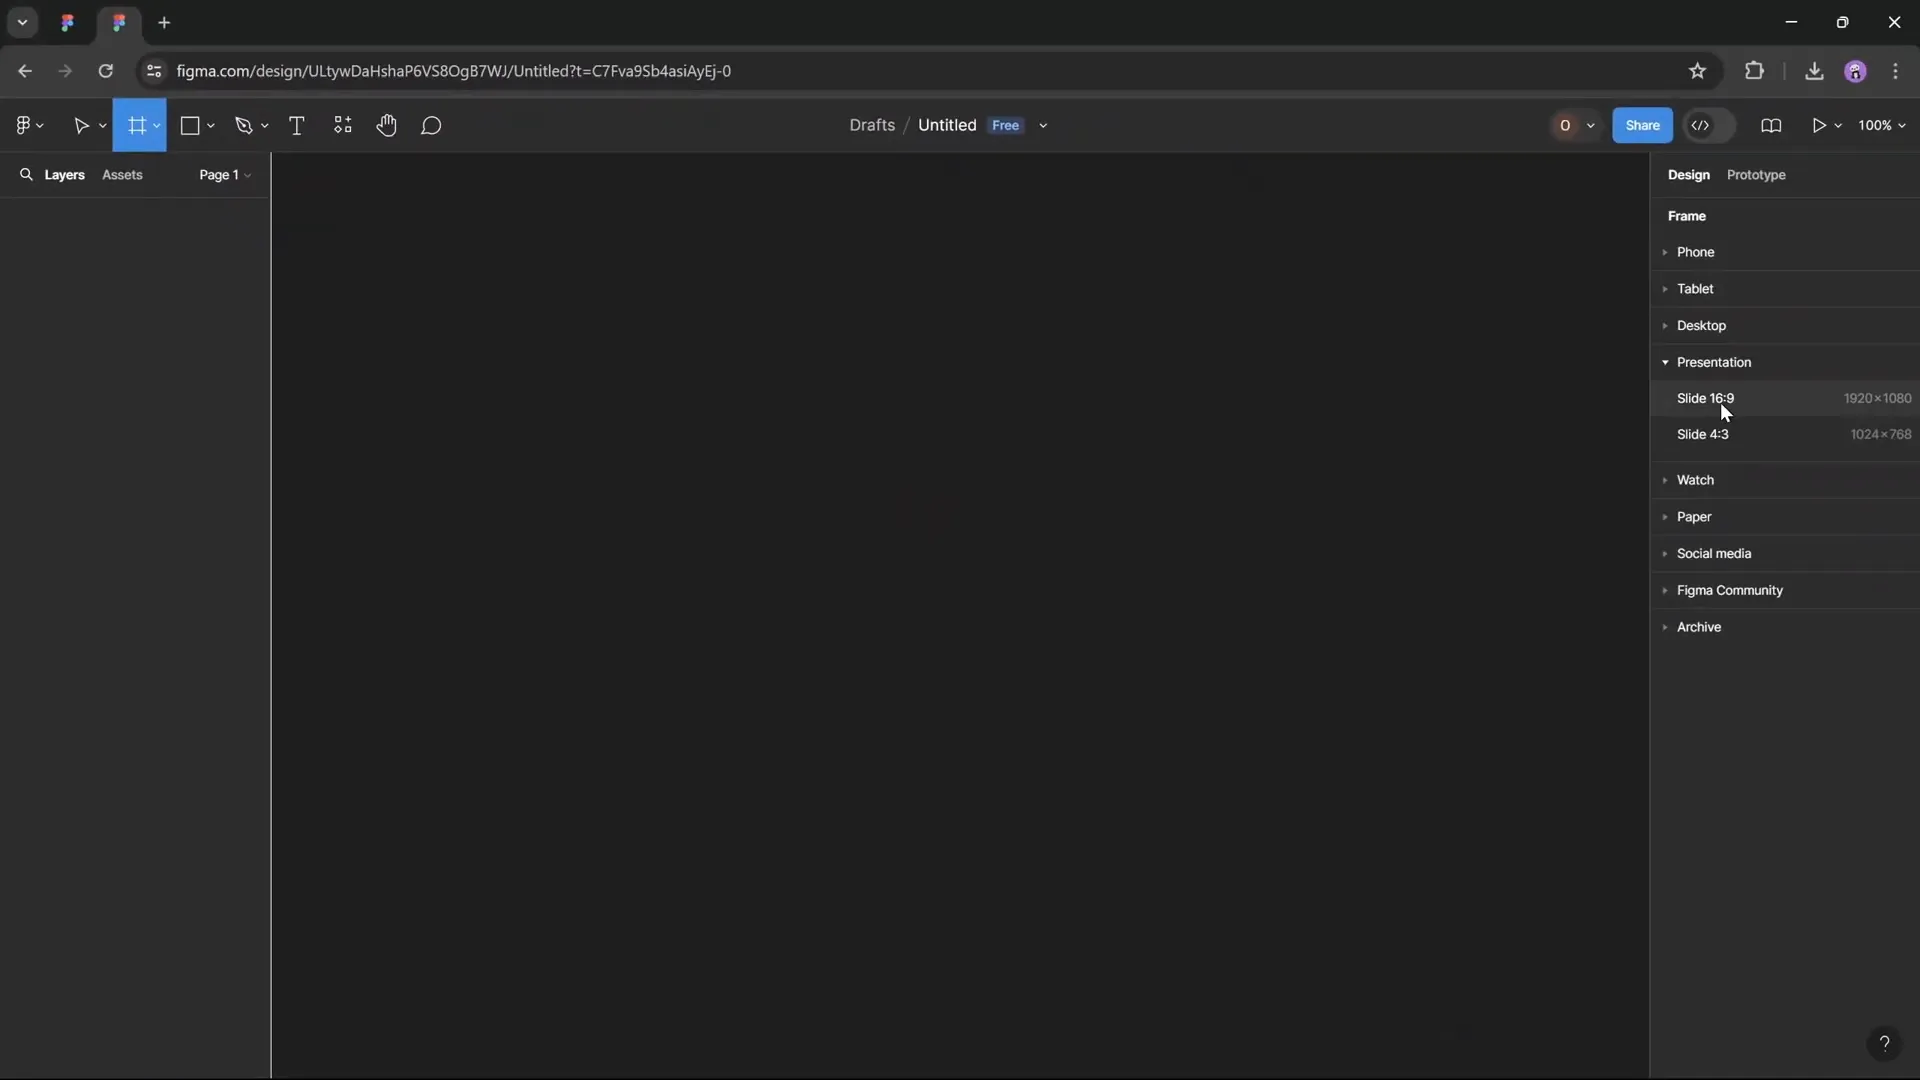
- Select the Frame Tool (shortcut
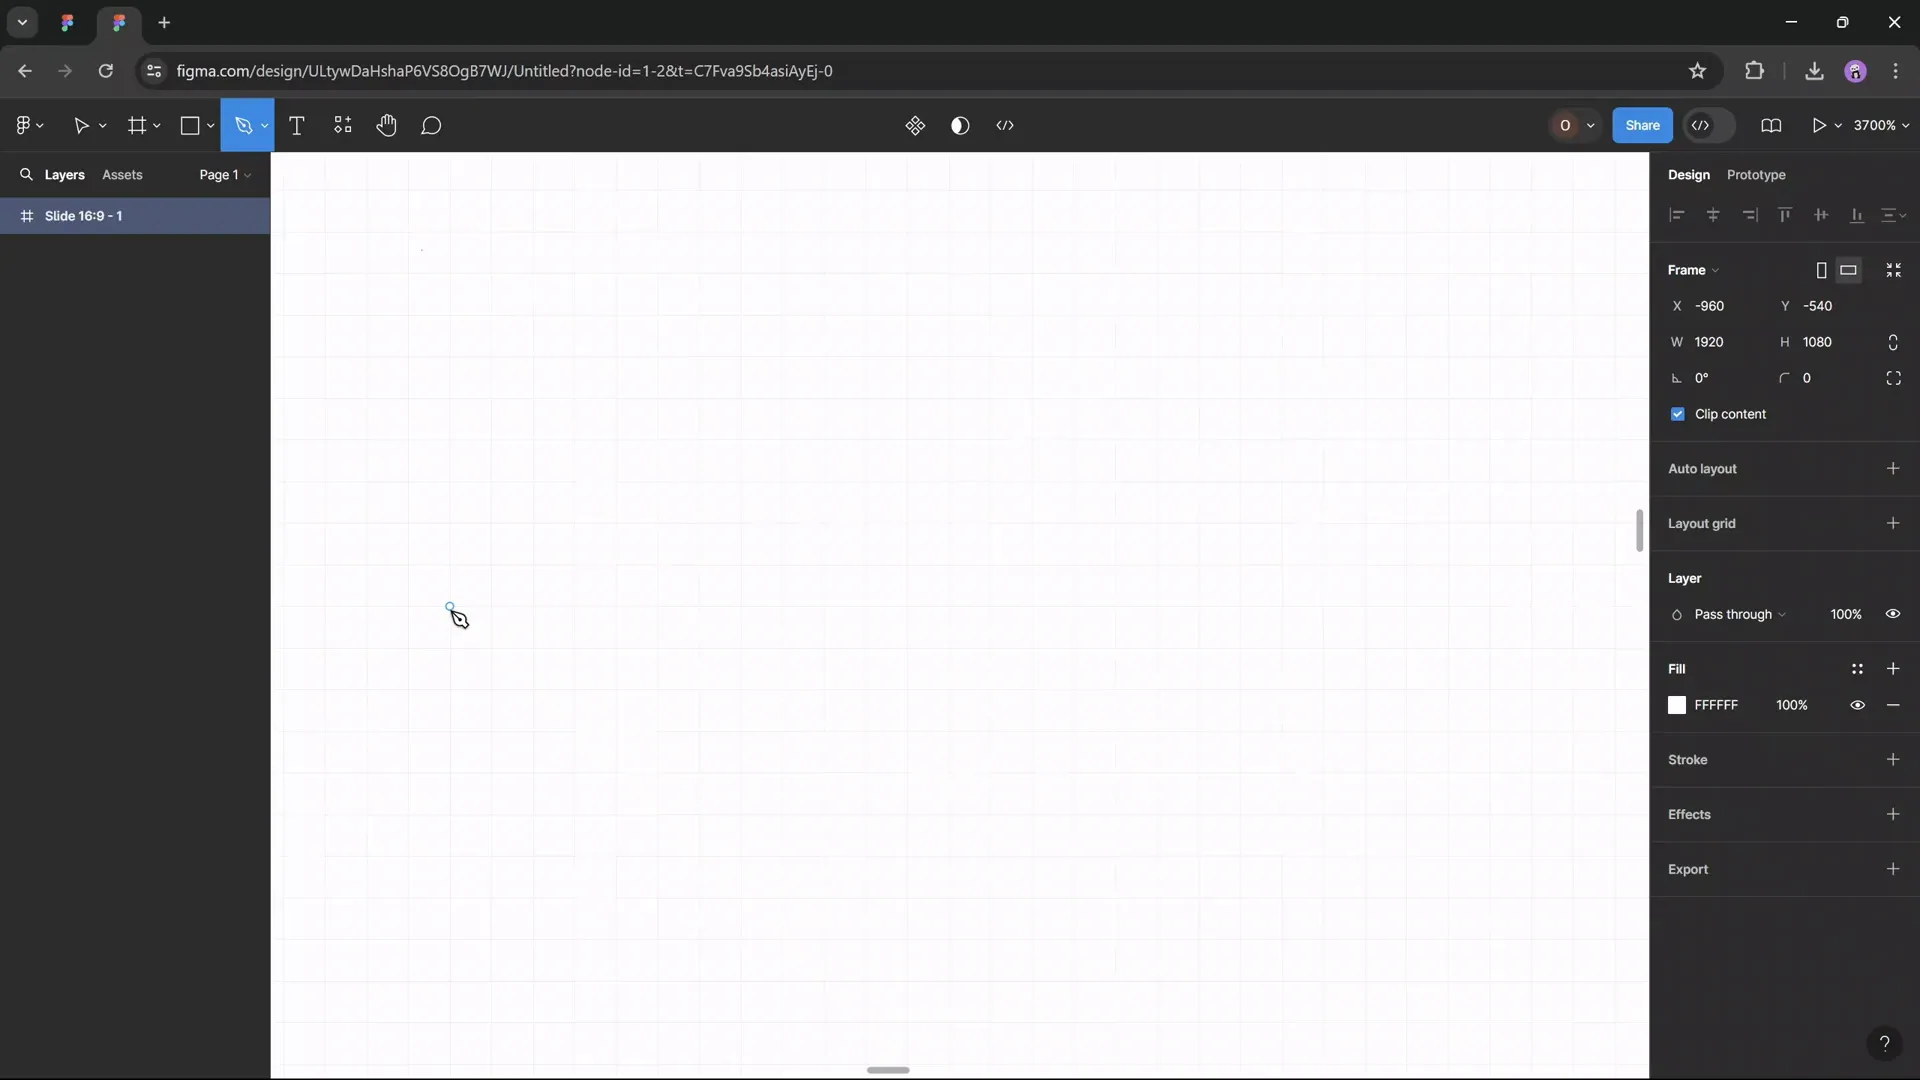
F) and choose the “Presentation” layout from the right-side panel. This sets up a slide-sized canvas. - Activate the pixel grid to help with precise snapping: Hold
Ctrl(orCmdon Mac) and scroll to zoom until the grid appears. Ensure “Snap to Pixel Grid” is turned on.
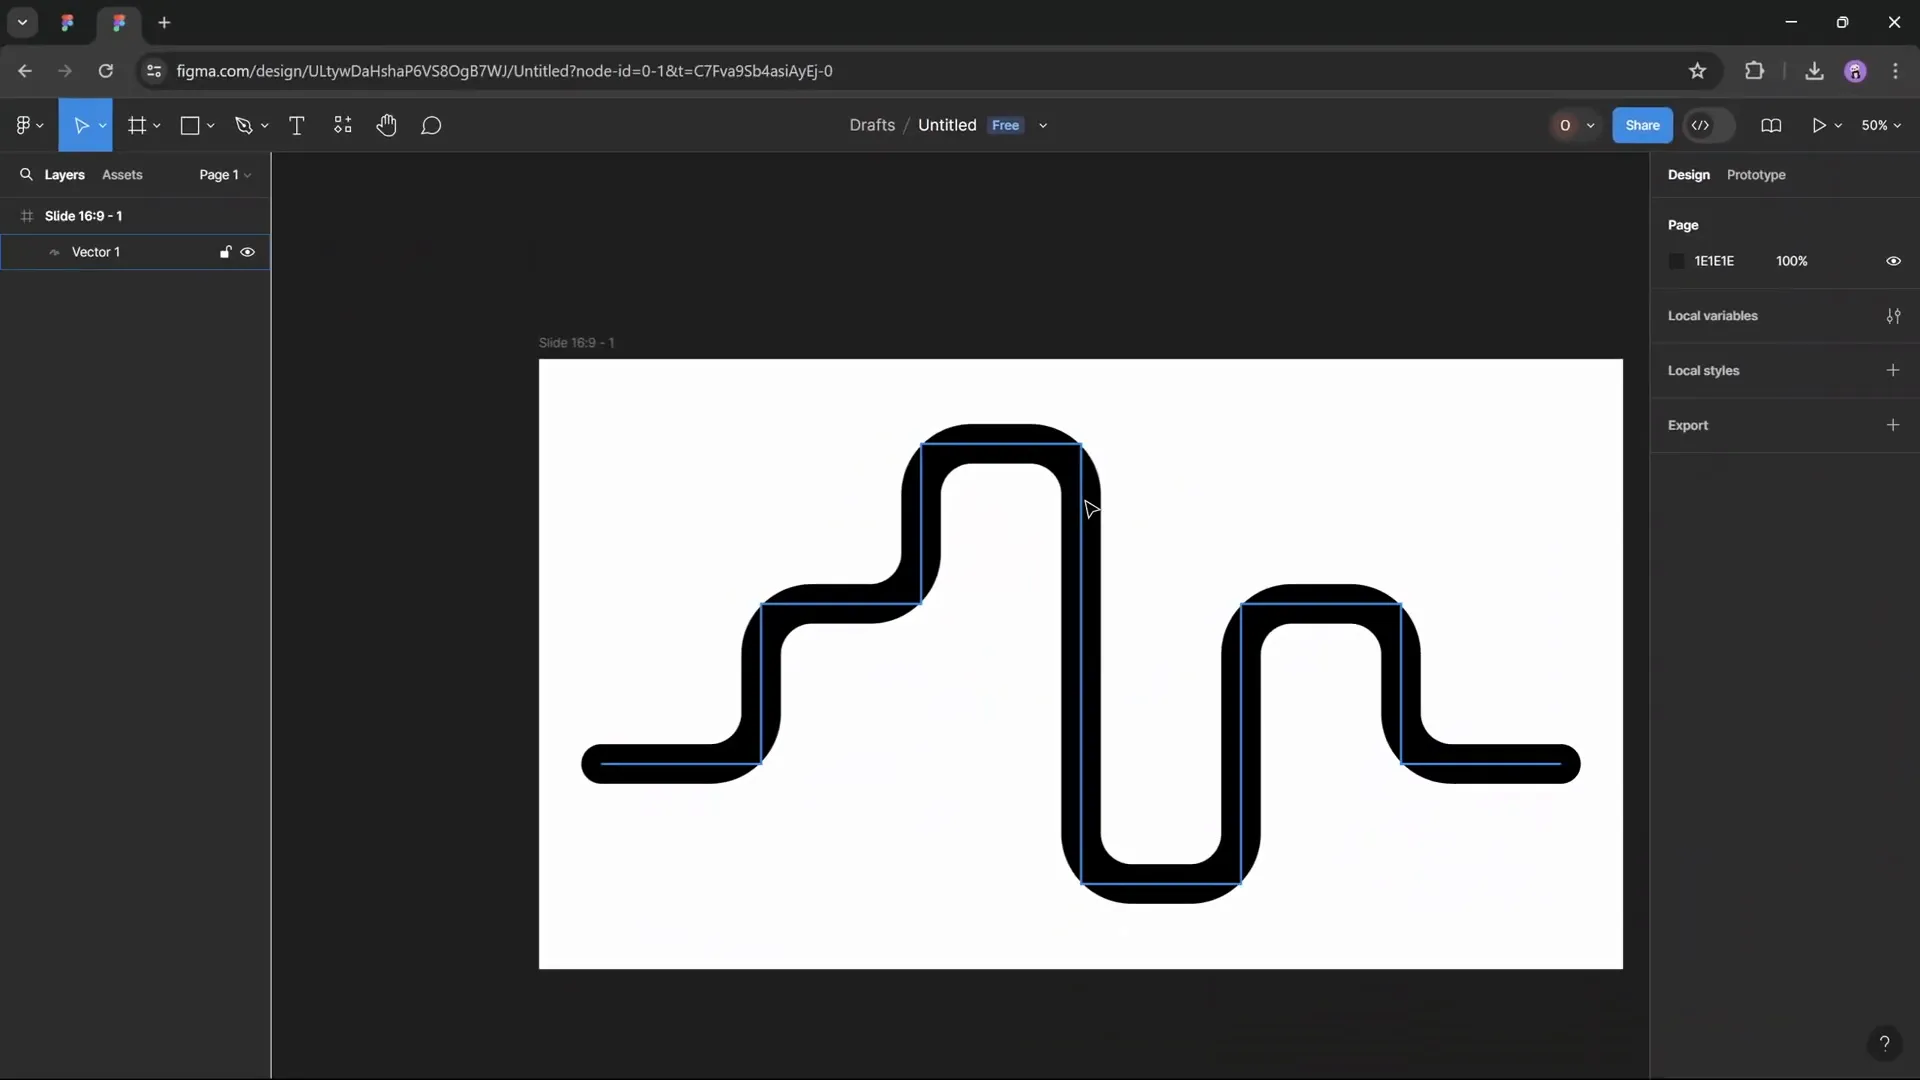
Step 2: Drawing the Roadmap Using the Pen Tool
Instead of struggling with PowerPoint’s freeform tools, use Figma’s Pen Tool to create the roadmap path quickly:
- Activate the Pen Tool by pressing
P. - Click points on the grid to create straight lines, keeping a consistent distance (e.g., four grid squares) between turns for symmetry.
- Follow a pattern of moving right, up, right, up, down, right, down, and right again to create the curvy roadmap shape.
- Keep the stroke thin initially (0.5 pixels) for precision.
Step 3: Scaling and Styling the Roadmap
- Select the entire shape and press
Kto activate the Scale Tool. - Hold
Alt(Option on Mac) while scaling to keep proportions uniform. Scale the shape until it fits well on your canvas. - Set the width to a specific pixel value (e.g., 1700 pixels) for consistency, locking the aspect ratio.
- Increase the stroke width to make the line thicker (e.g., 70 pixels).
- Round the edges of the stroke by selecting “Round” for the start and end caps.
- Use the Corner Radius tool to smooth out the turns. Drag the radius slider to around 90 pixels for subtle rounding.
- Rename the layer to “Roadmap” to keep your file organized.
Step 4: Exporting the Roadmap as SVG
Once your roadmap shape looks perfect, export it as an SVG file to import into PowerPoint:
- Select your roadmap shape.
- Go to the Export panel, choose “SVG” as the format, and click “Export.”
This vector format retains the quality and allows you to edit the shape further in PowerPoint.
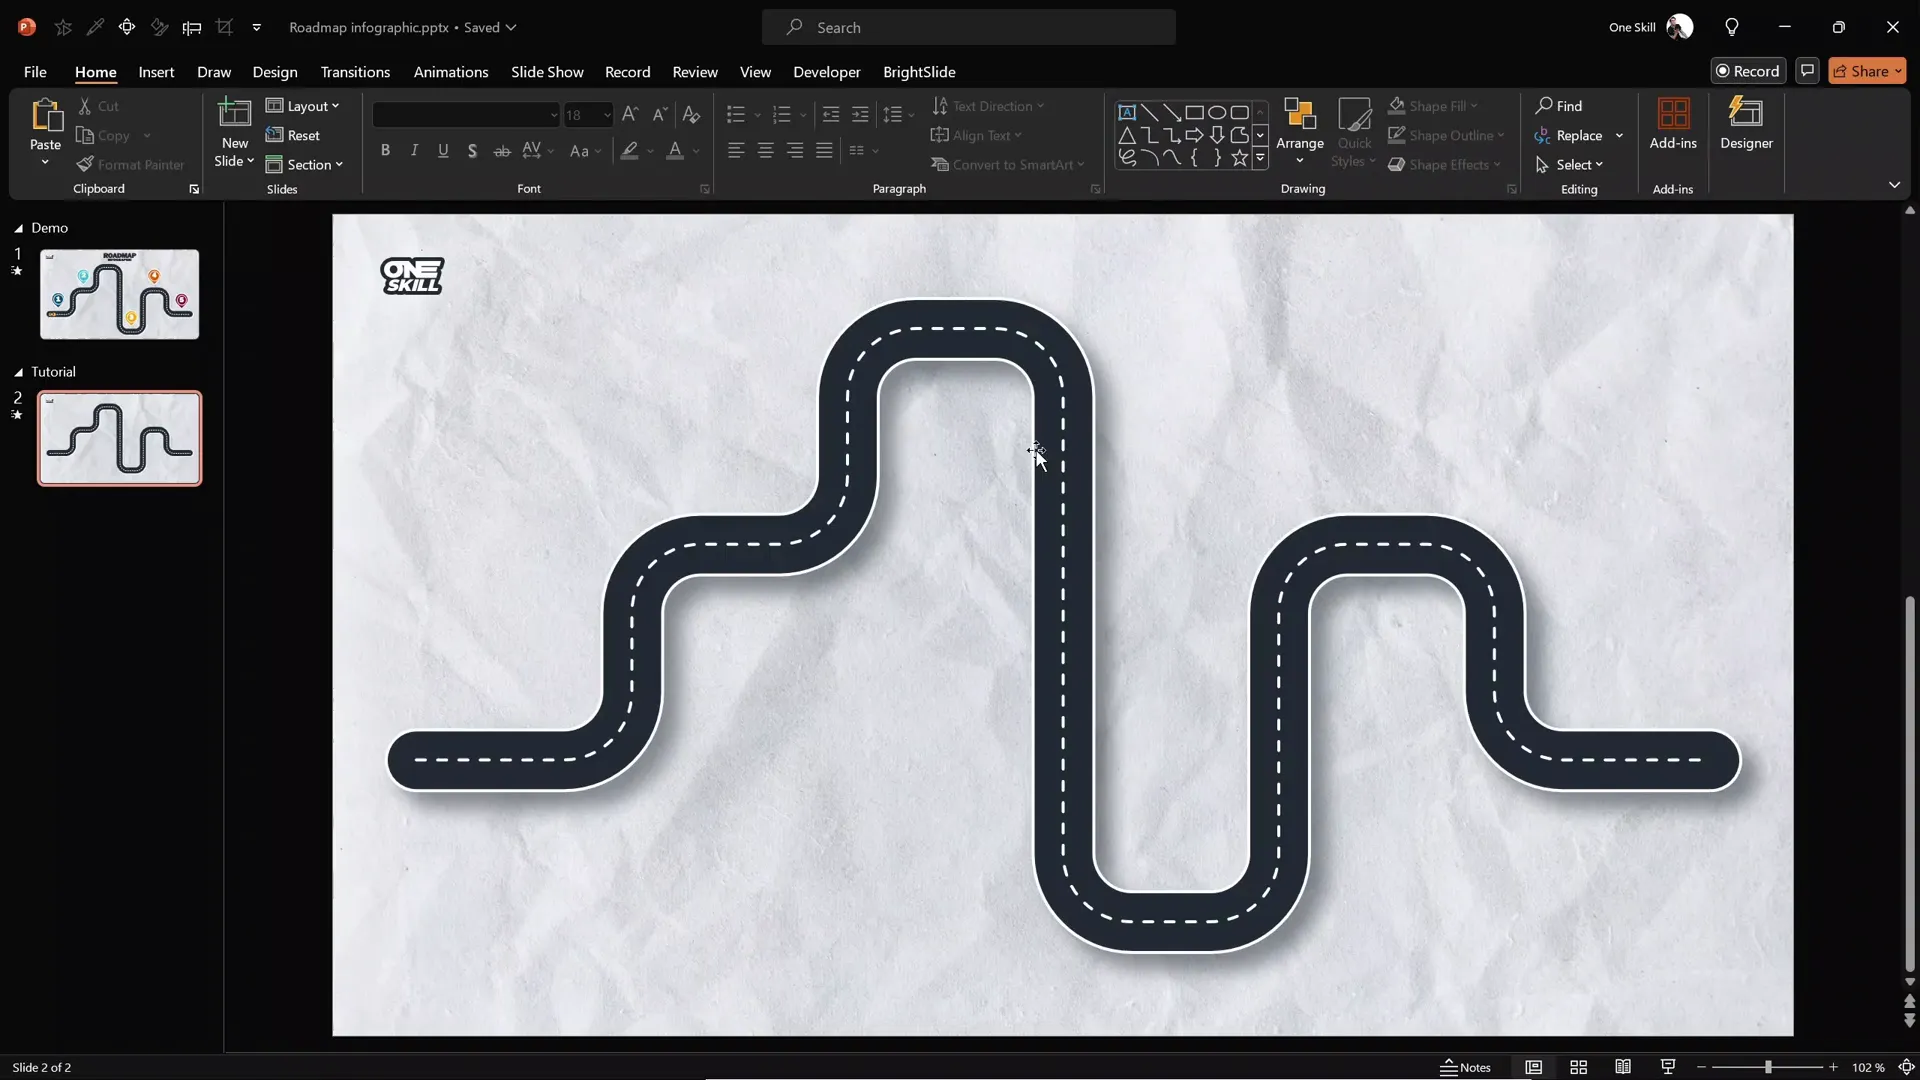
Importing and Customizing the Roadmap in PowerPoint
Now that you have your custom roadmap SVG file, it’s time to bring it into PowerPoint and customize it further.
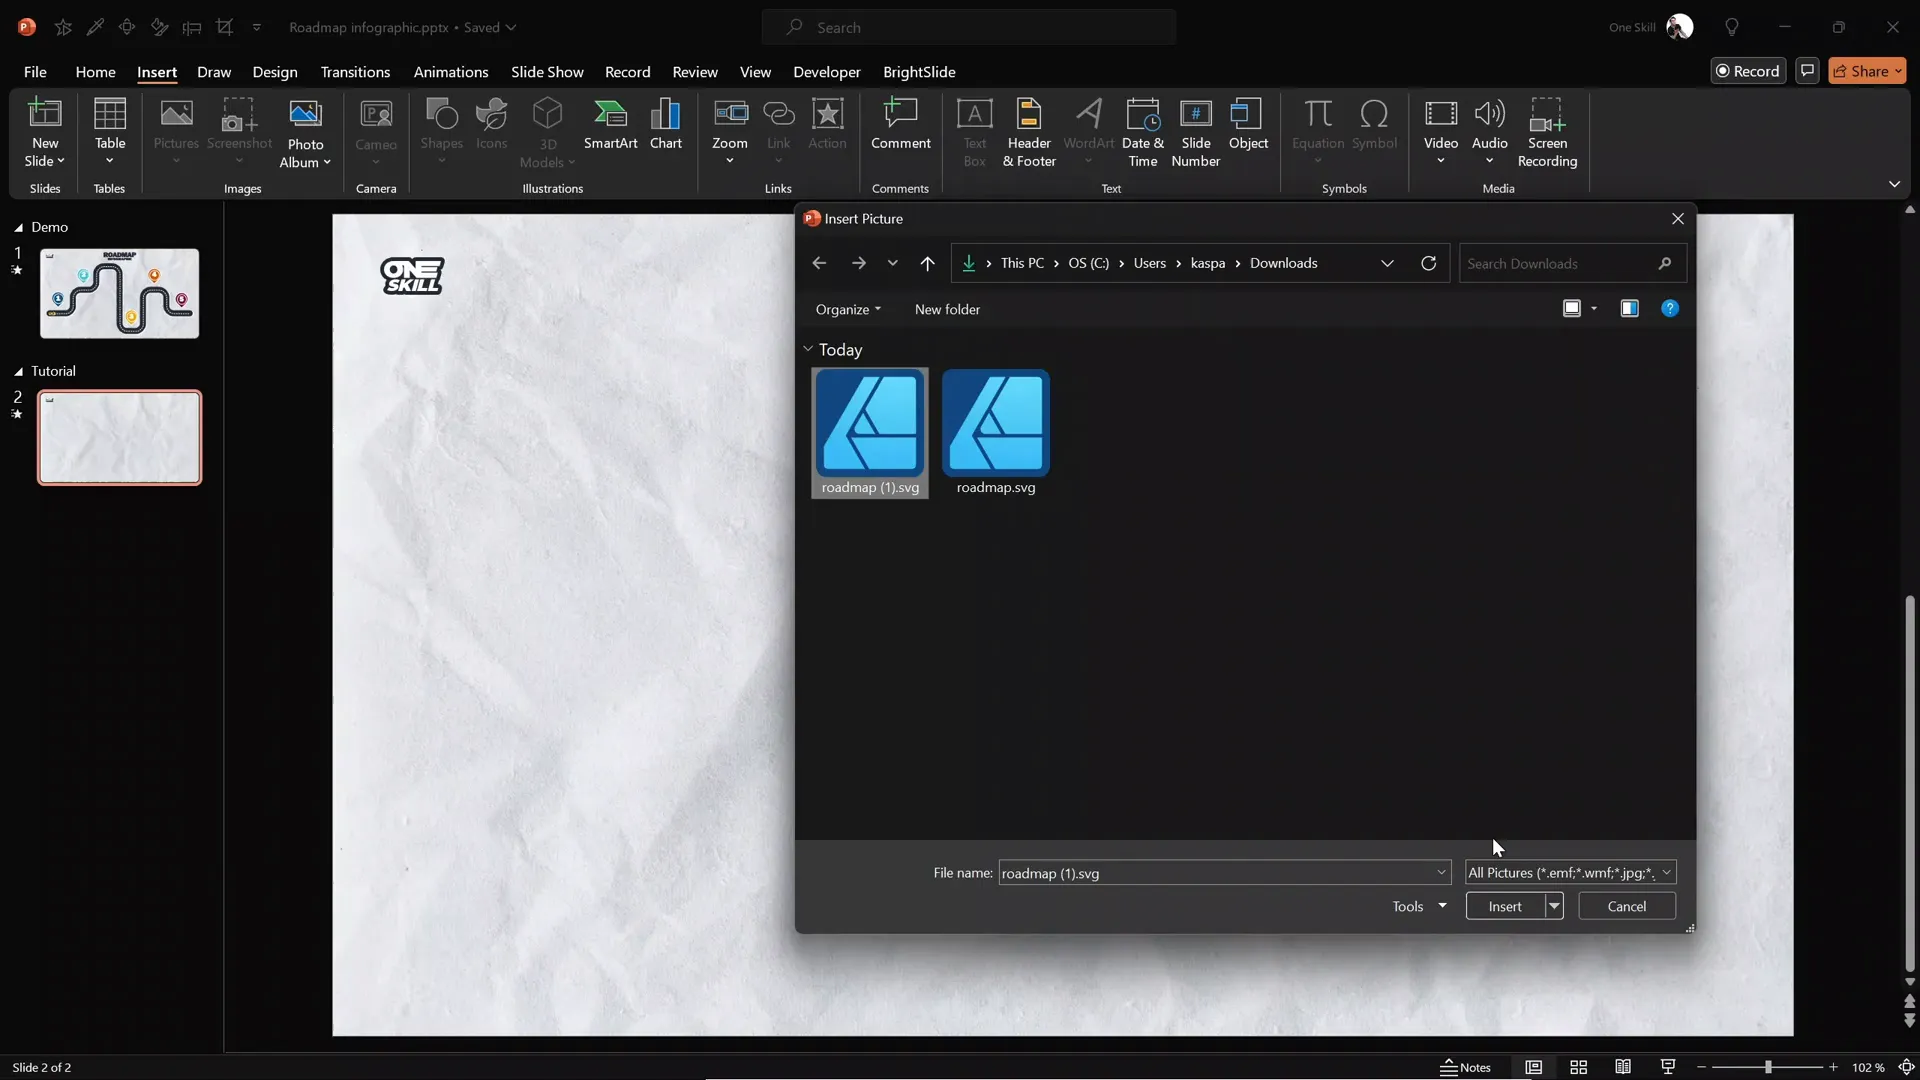
Step 1: Insert the SVG File
- Open your PowerPoint presentation and navigate to the slide where you want the roadmap.
- Go to the Insert tab and click Pictures, then select your exported SVG file.
- Once inserted, right-click the SVG image and choose Convert to Shape. This allows you to edit the roadmap as a PowerPoint shape.
- Resize the roadmap by locking the aspect ratio and setting the width (e.g., 30 cm) to fit your slide layout.
- Align the roadmap shape centrally on the slide for balance.
Step 2: Customize Road Colors and Appearance
Adjust the road’s color and style to suit your presentation’s theme:
- Right-click the roadmap shape and select Format Shape.
- Change the line color to your preferred shade (e.g., a vibrant green).
- Ensure the shape’s line width and rounded edges are preserved during customization.
Adding Road Details: Dashed Lines, Outline, and Shadow
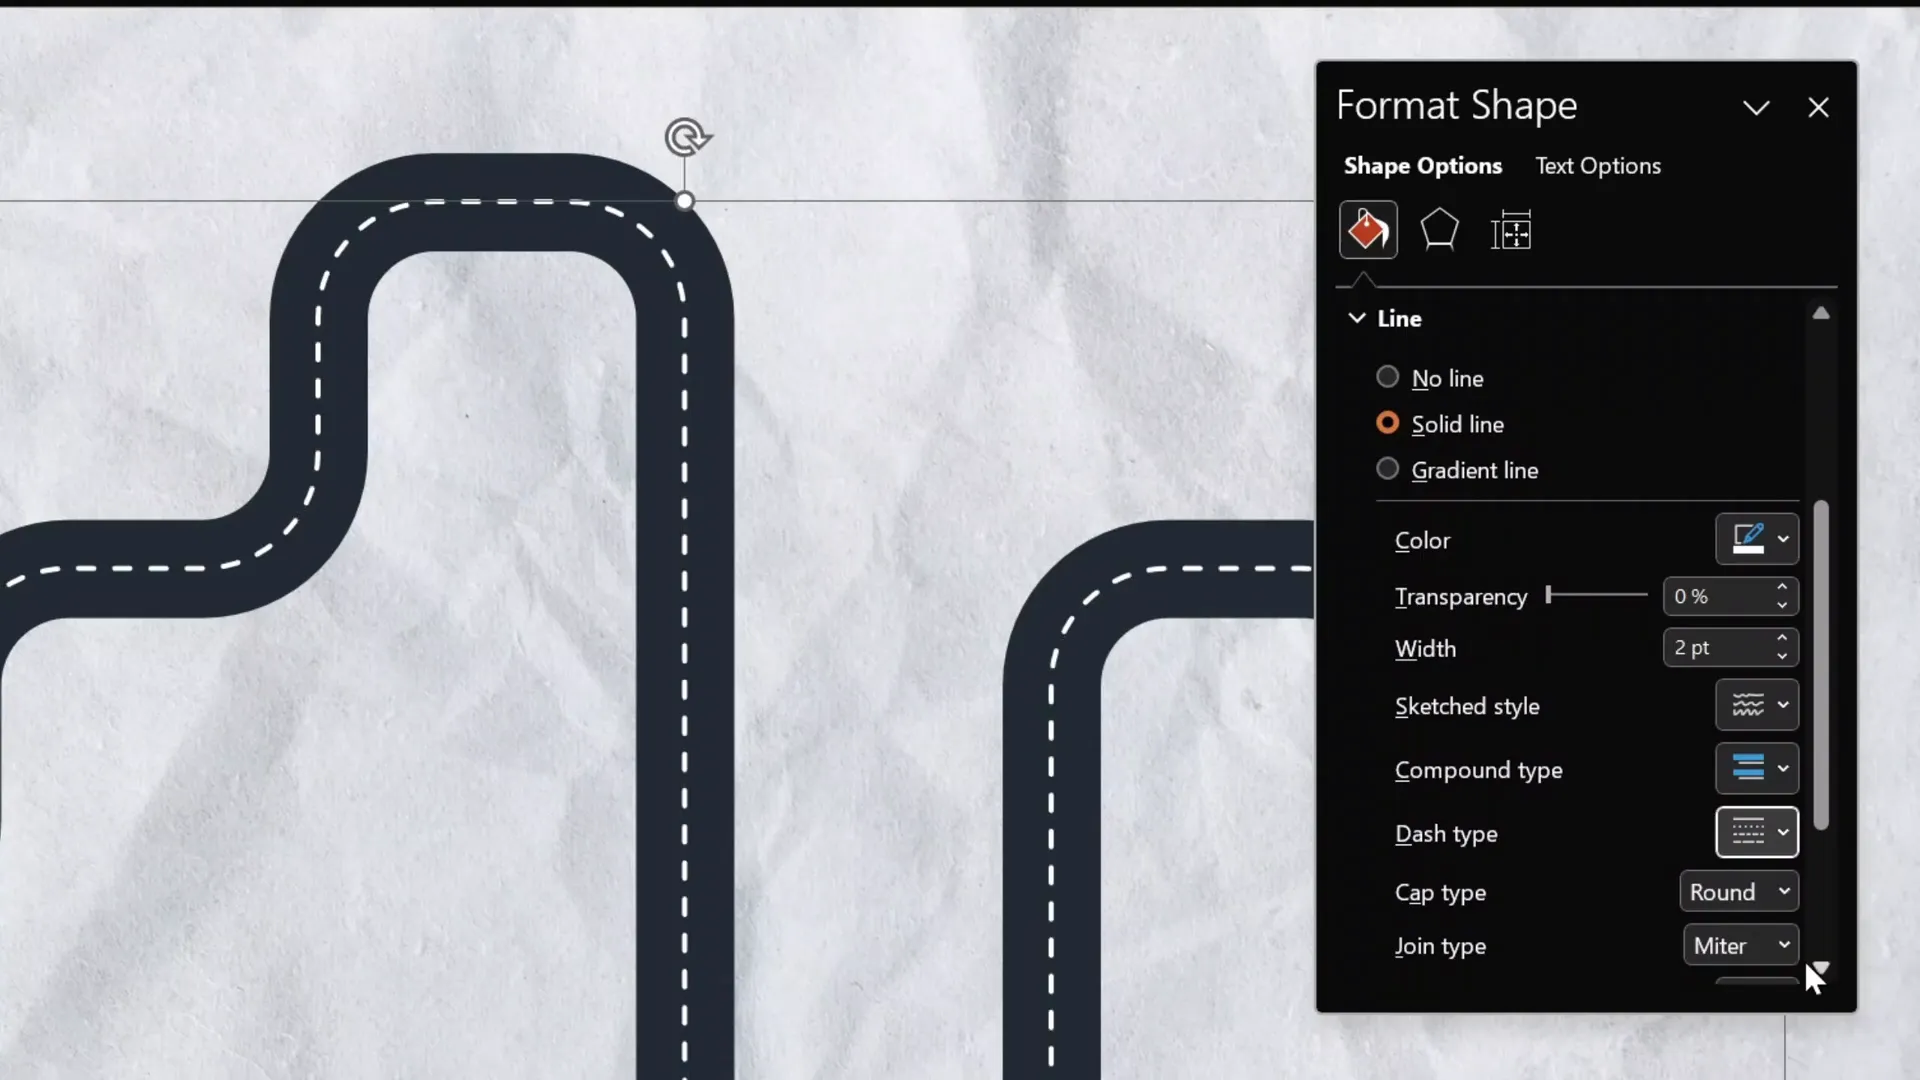
For realism and better visual appeal, add details such as the dashed center line, a white outline, and a subtle shadow to your roadmap.
Step 1: Create the Dashed White Center Line
- Duplicate the main roadmap shape (select and press
Ctrl+DorCmd+D). - Change the line color to white.
- Reduce the line width to around 2 points to create a thinner dashed line.
- Align this white line exactly over the green roadmap shape.
- In the Format Shape options, set the line to a dashed style that resembles road markings.
Step 2: Add a White Outline Around the Road
- Duplicate the green roadmap shape again.
- Increase the line width slightly (e.g., 42 points) to create a white border around the main road.
- Change the line color to white.
- Send this shape to the back to sit behind the green roadmap.
- Align carefully with the other shapes.
Step 3: Apply a Shadow for Depth
- Select all three roadmap shapes (the green road, dashed center line, and white outline).
- Group them together (right-click and choose Group).
- Go to the Format Shape pane, open the Shadow options.
- Choose a subtle shadow preset.
- Customize shadow settings: use a gray color, 50% transparency, 15 points blur, and 15 points distance.
Creating Pins for Roadmap Milestones
Pins mark important milestones along your roadmap, adding clarity and focus to key points.
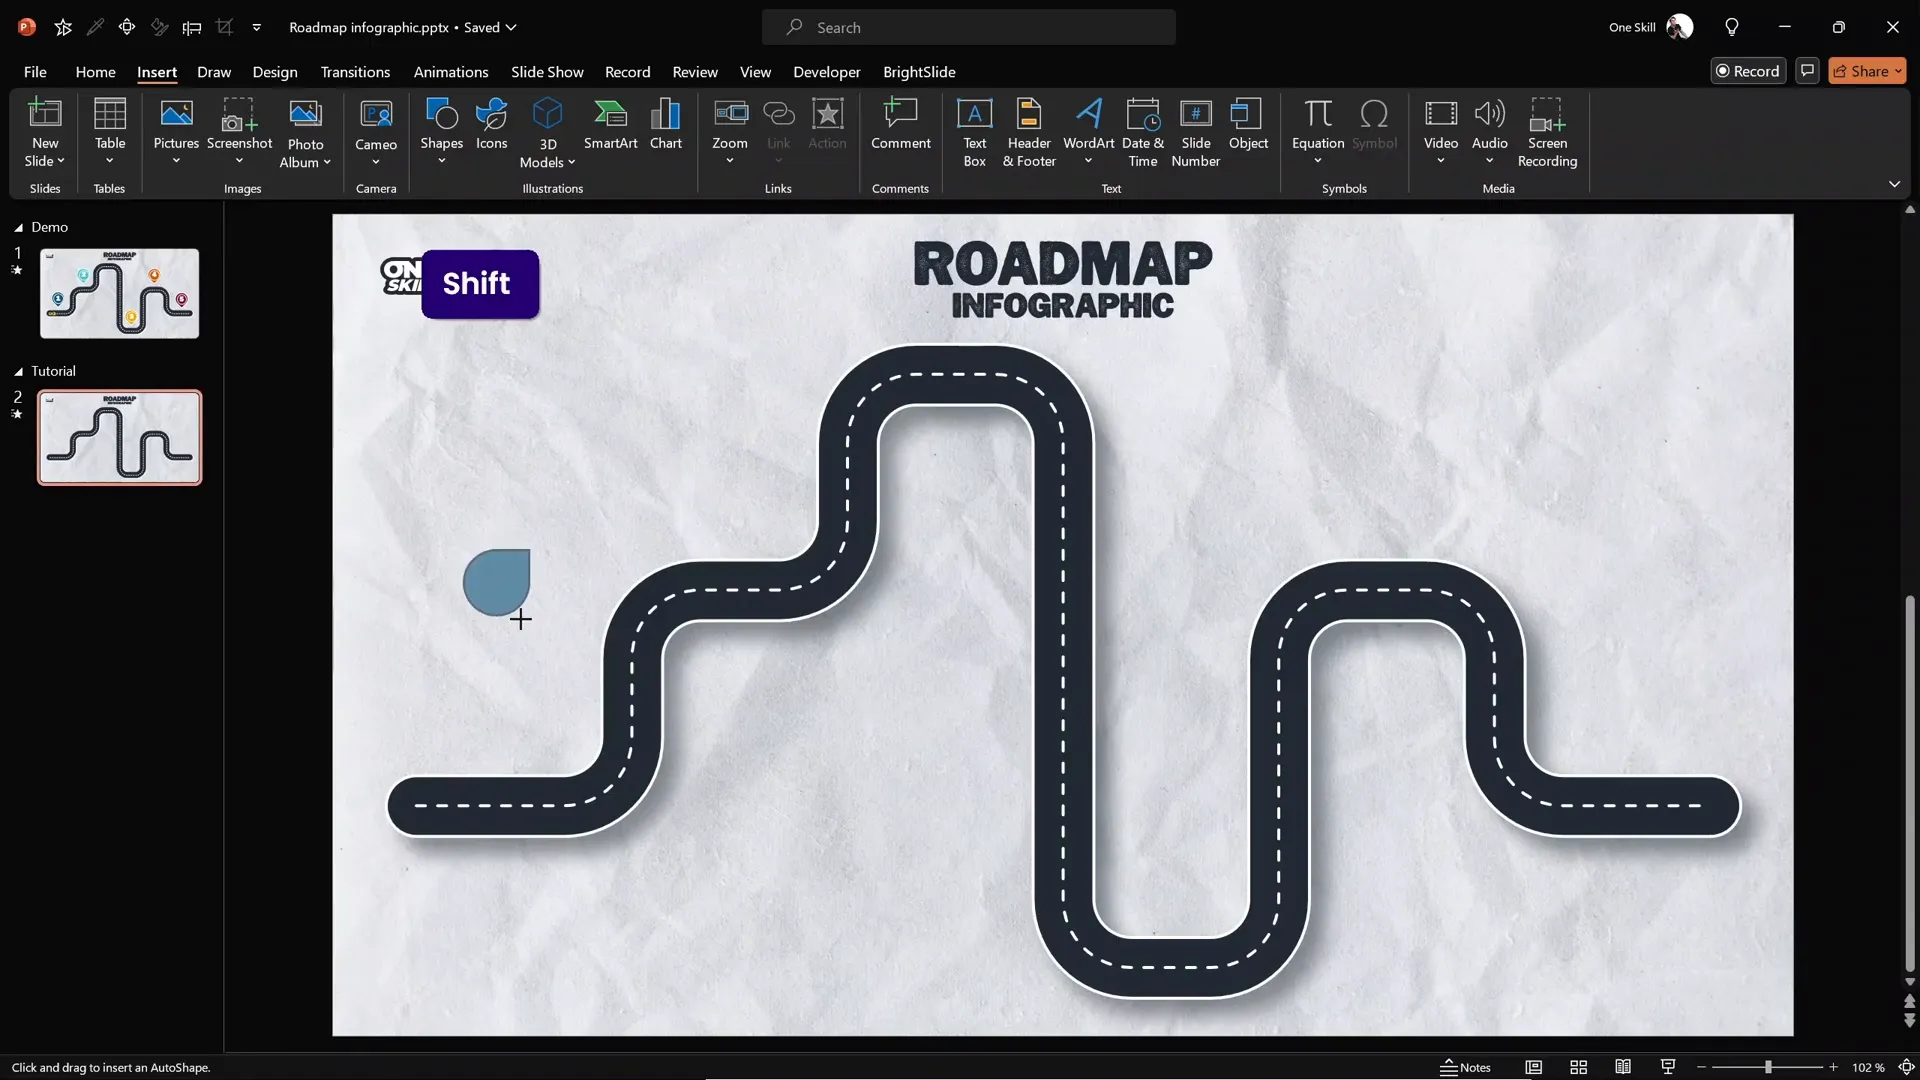
Step 1: Design a Pin Using Shapes
- In PowerPoint, go to Insert > Shapes and select the Teardrop shape.
- Draw the teardrop and rotate it so it points downward.
- Fill the pin with your chosen color (e.g., a bright accent color).
- Add a white outline to the pin and increase the outline thickness to 2 points.
- Apply the same shadow settings used for the roadmap for consistency.
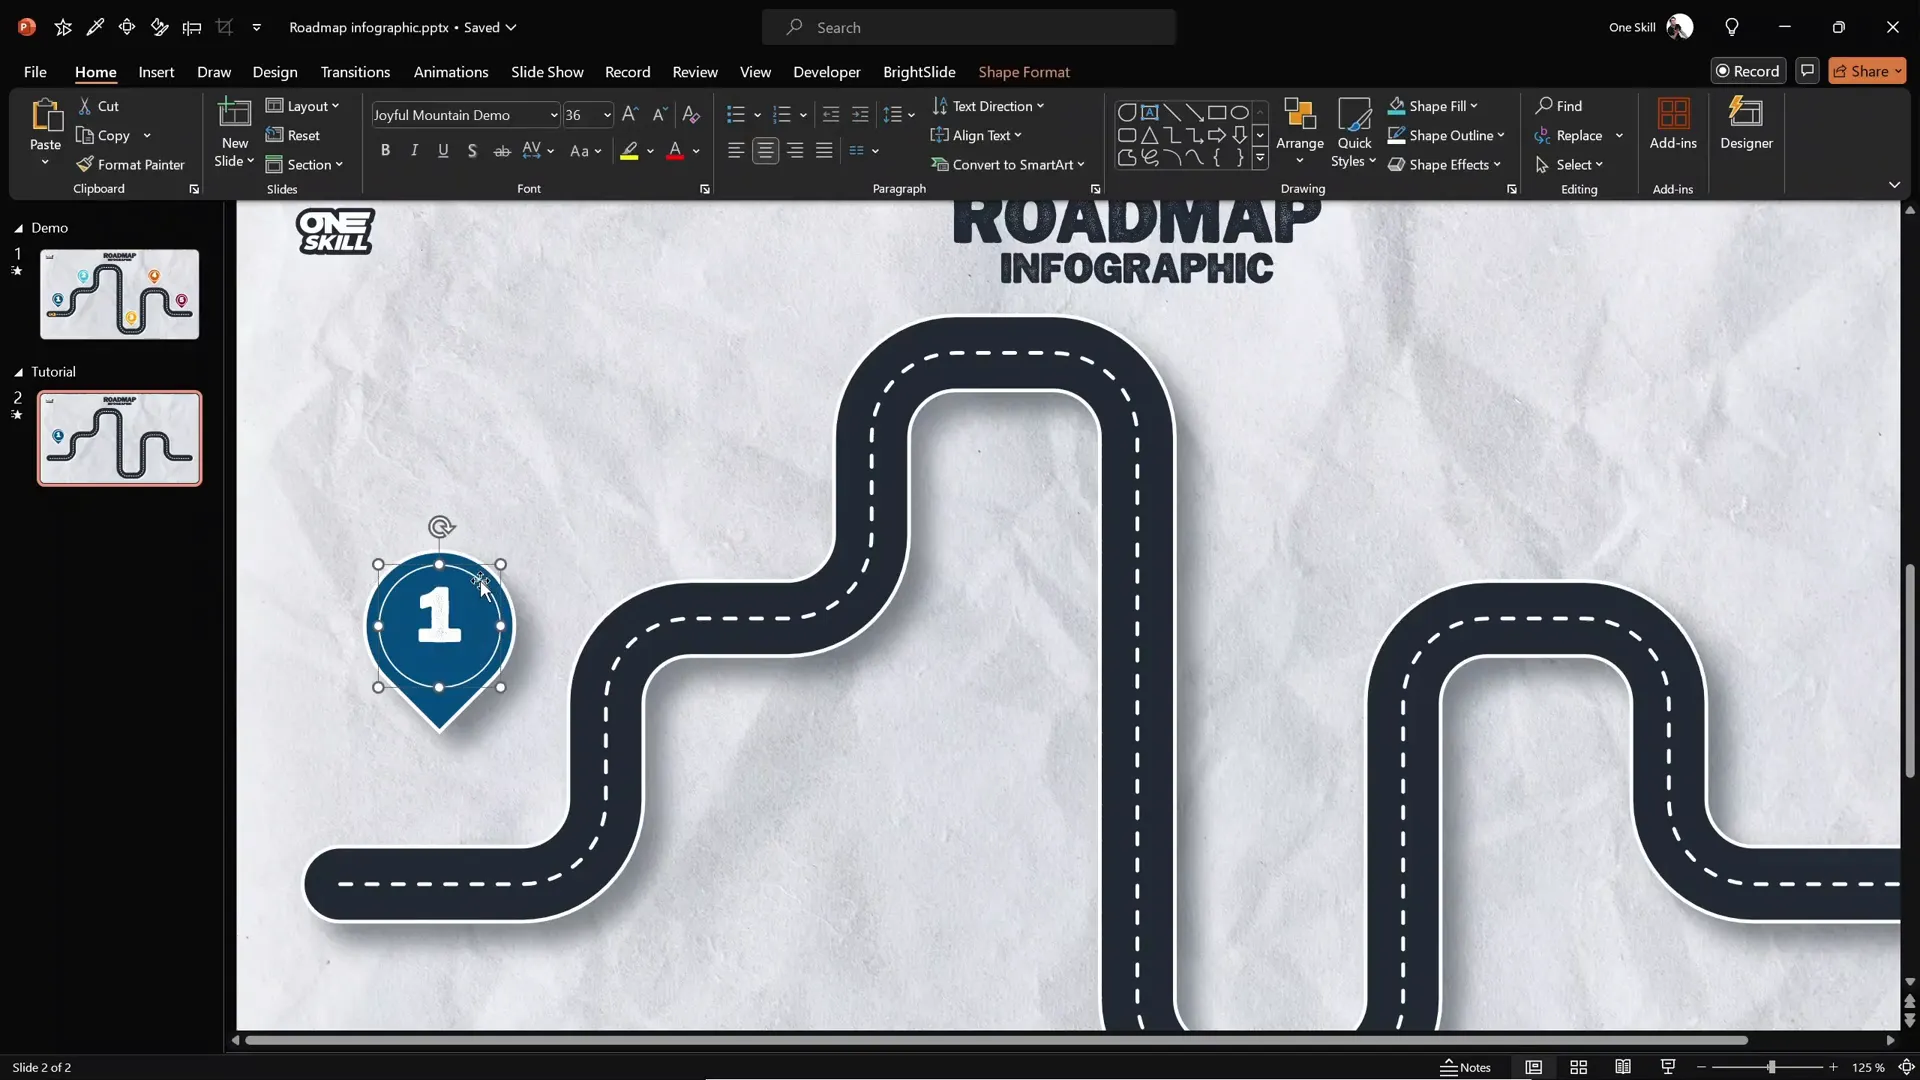
Step 2: Add a Numbered Circle Inside the Pin
- Insert a perfect circle inside the pin by holding
Shiftwhile drawing. - Set the circle fill to none and outline color to white with 1 point thickness.
- Place the circle centrally inside the teardrop pin.
- Double-click inside the circle to add a number (e.g., “1”).
- Change the font to a clean, stylish font such as Joyful Mountain.
- Increase the font size to 36 pt for visibility.
- Adjust the text box’s top margin to vertically center the number inside the circle.
Step 3: Replicate and Position Pins Along the Roadmap
Once you’ve created the first pin, duplicate it to save time and place the copies at desired milestone points along your roadmap.
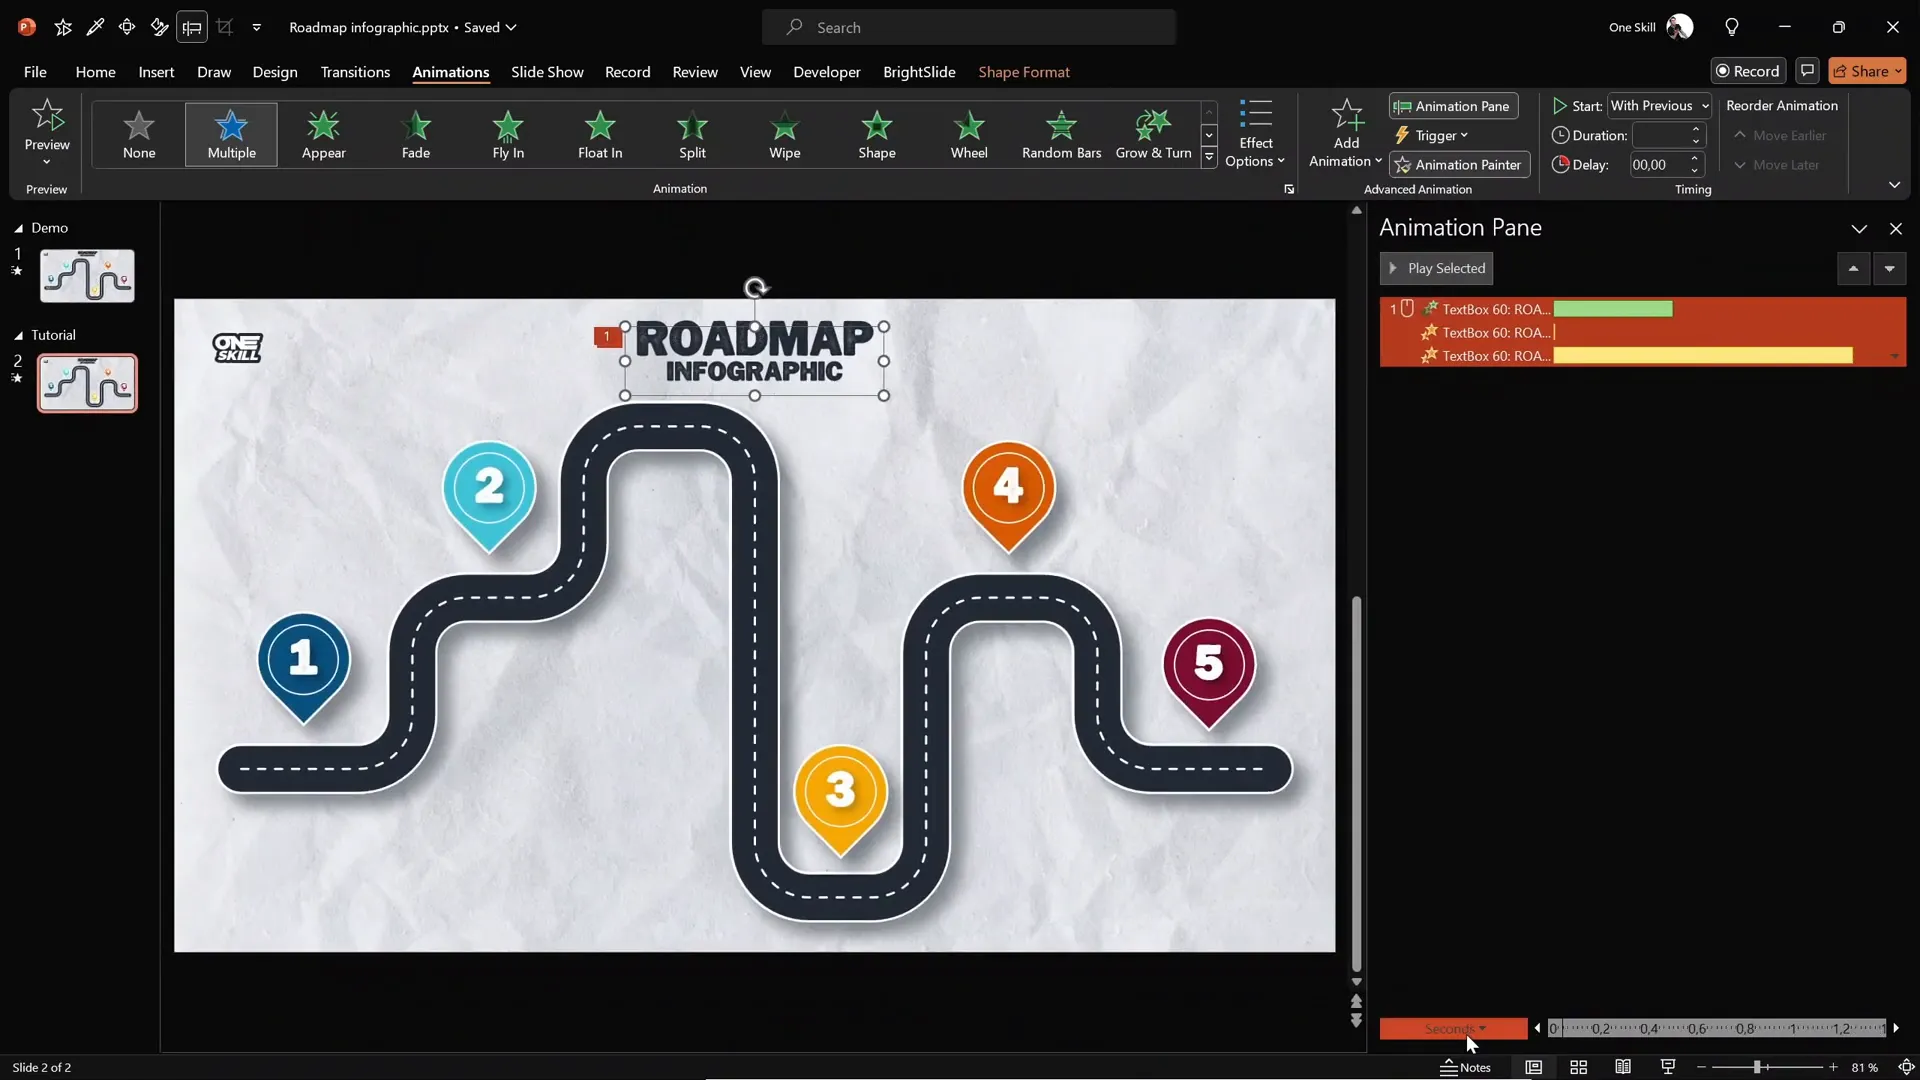
Animating the Roadmap Elements
Animations breathe life into your infographic PowerPoint presentation, making it more dynamic and engaging. Here’s how to add a smooth zoom-in effect with a slow-motion finish to your roadmap components.
Step 1: Understand the Zoom with Slow Motion Effect
This effect is achieved by layering multiple animations on the same object:
| Animation Type | Duration | Effect |
|---|---|---|
| Basic Zoom | 0.5 seconds | Initial zoom in |
| Grow/Shrink (Shrink to 50%) | 0.01 seconds | Instant shrink to create zoom effect |
| Grow/Shrink (Grow to 200%) with Smooth End | 1.25 seconds | Slow-motion zoom finish |
Step 2: Applying Animations in PowerPoint
- Delete any existing animations from your slide to start fresh.
- Copy the animation sequence from a previously animated slide title using the shortcut
Alt+Shift+C(orOption+Shift+Con Mac). - Paste the animations onto your roadmap elements using the Animation Painter tool.
- Ensure only the first animation starts on mouse click; the rest should start with the previous animation to create a smooth, single-click effect.
Animating the Driving Car Following the Road
One of the most exciting parts of this infographic is animating a small car to follow the roadmap path, turning at each curve.
Step 1: Prepare the Car Asset
- Download the car illustration from Freepik.
- Insert the car image into your PowerPoint slide and remove any existing animations.
Step 2: Create the Custom Motion Path
- Select the car and go to Add Animation > Motion Paths > Custom Path.
- Click to draw the path along the roadmap’s center, clicking each turn point to follow the road’s shape.
- Double-click to finish drawing the path.
- Right-click the motion path and select Edit Points to smooth corners and adjust the path precisely.

Step 3: Add Spin Animations to Simulate Turns
- Add a Spin animation to the car for each turn along the path.
- Set each spin animation to start with previous, duration 0.2 seconds.
- Adjust the spin angle to 90 degrees, changing the direction to counterclockwise or clockwise depending on the turn.
- Use animation delay and drag the spin animations on the timeline to synchronize them with the car’s position on the path.
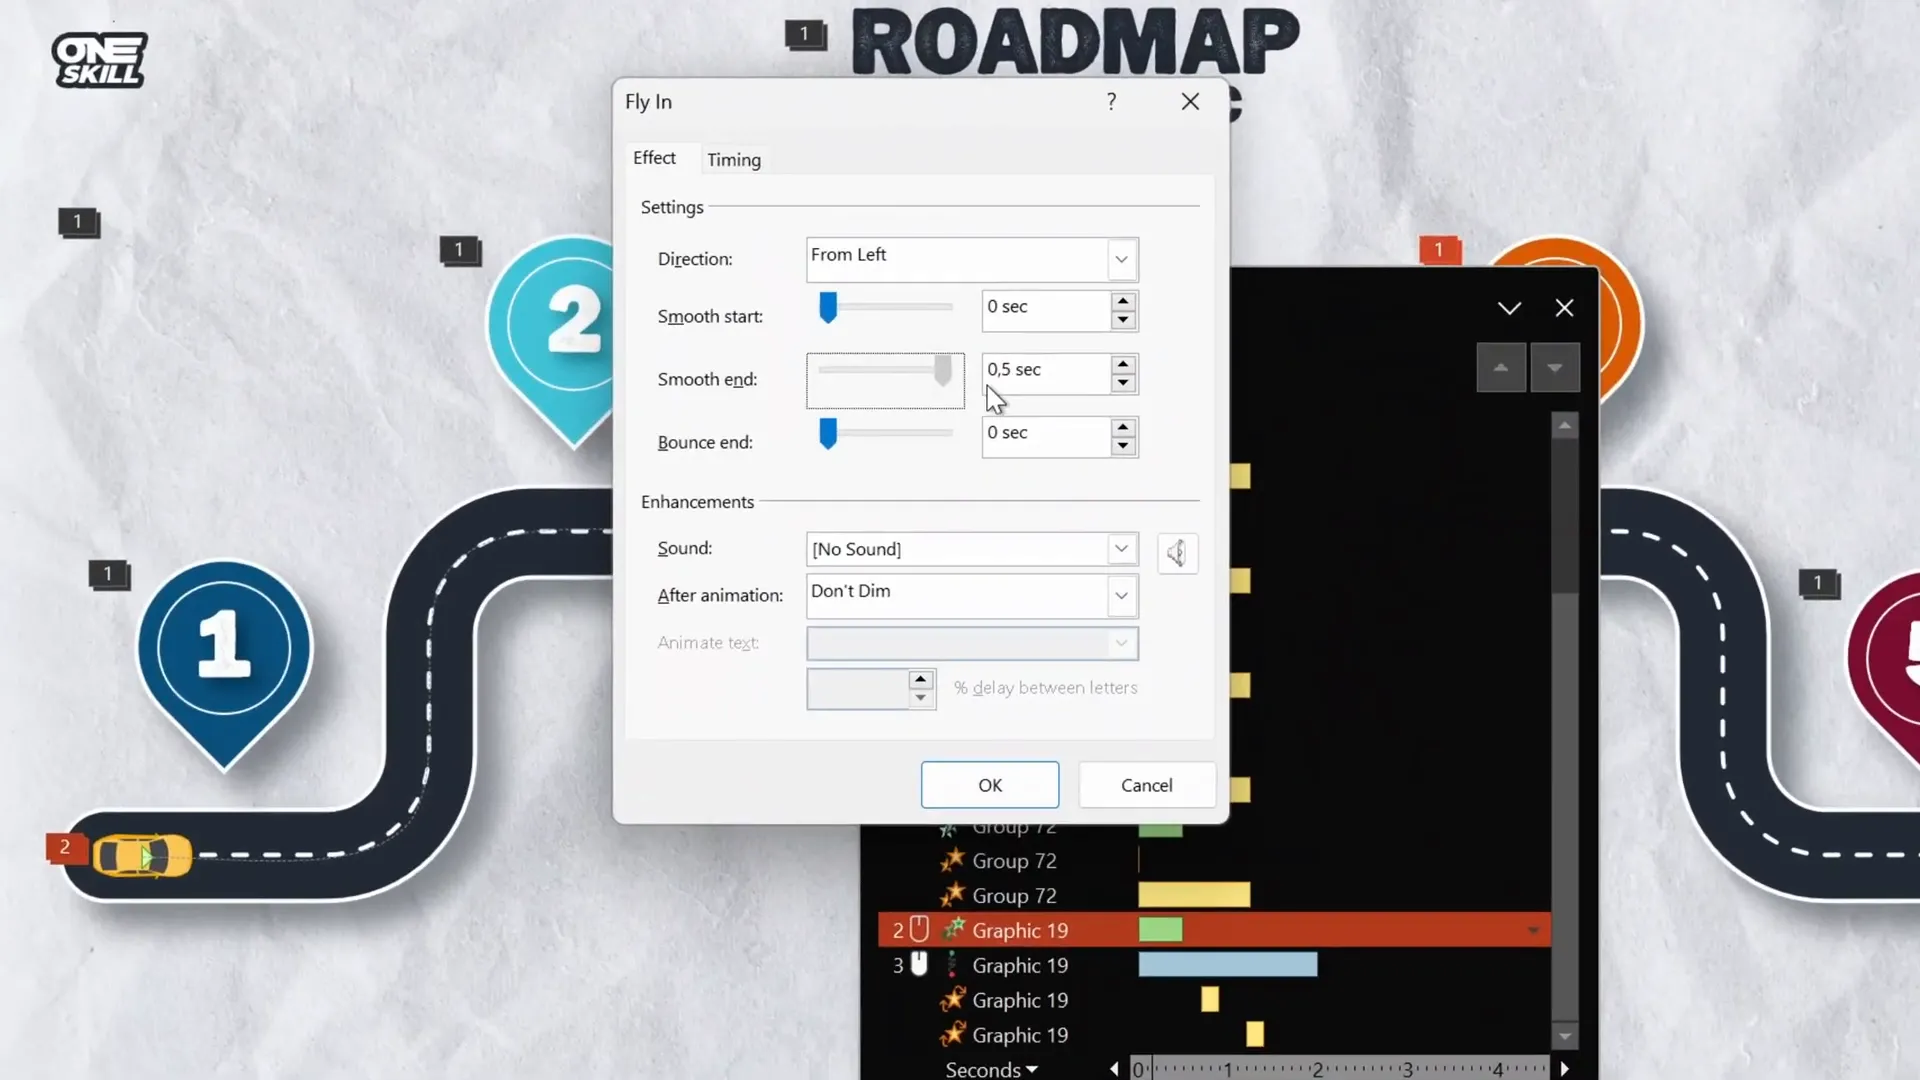
Step 4: Add Entrance Animation
To avoid the car appearing abruptly, add a Fly In animation from the left, set to start before the motion path animation, with a duration of 0.5 seconds.
Step 5: Preview and Adjust
Test the animation sequence in full-screen mode. The car should fly in, follow the road path smoothly, and rotate at each turn realistically.
Advanced Tips: Slide Zooms for Interactive Presentations
To make your infographic even more interactive, consider adding Slide Zooms linked to each milestone pin. This allows you to click on a pin and zoom into a detailed slide about that particular milestone, providing deeper insights without cluttering your main roadmap slide.
- Use PowerPoint’s Insert > Zoom > Slide Zoom feature.
- Link each pin to its corresponding detailed slide.
- This technique enhances navigation and audience engagement during your presentation.
If you want to learn more about slide zooms, check out the tutorial linked at the end of this article.
Frequently Asked Questions (FAQ)
1. Why use Figma for designing PowerPoint infographics?
Figma offers powerful vector design tools that are more flexible and precise than PowerPoint’s native shape tools. It allows you to create complex shapes like curvy roadmaps easily, export them as SVG files, and import them into PowerPoint while maintaining editability.
2. Can I create animated infographics entirely within PowerPoint?
While PowerPoint has animation capabilities, creating complex shapes and smooth curved paths is limited. Combining external design tools like Figma with PowerPoint’s animation features provides the best of both worlds: professional design and dynamic animations.
3. How do I ensure my animations run smoothly during a presentation?
Test your animations in Slide Show mode multiple times. Use the Animation Pane to fine-tune the timing, order, and delays. Avoid overly complex animations that can lag on slower computers.
4. What fonts work best for infographic presentations?
Choose clear, readable fonts that complement your design. The tutorial recommends the “Joyful Mountain” font for a stylish but legible look. Always ensure your fonts are embedded or available on the presenting computer to avoid substitution issues.
5. How can I make my roadmap infographic more interactive?
Adding slide zooms to pins allows viewers to click and navigate to detailed content slides. This interaction enhances engagement and makes your presentation more dynamic.
Conclusion
Creating an infographic PowerPoint presentation that includes a beautifully designed and animated roadmap infographic is an excellent way to bring your data and timelines to life. By leveraging Figma’s design capabilities for vector shapes and PowerPoint’s animation tools, you can produce professional, eye-catching slides that engage your audience and clearly communicate your message.
This step-by-step guide has shown you how to:
- Design a smooth, curvy roadmap shape in Figma.
- Import and customize SVG shapes in PowerPoint.
- Add realistic road details like dashed lines, outlines, and shadows.
- Create milestone pins with numbers for clear navigation.
- Animate elements with custom zoom and slow-motion effects.
- Animate a car following the roadmap path with precise turns.
- Enhance interactivity using slide zooms for detailed content.
By following these techniques, you can transform your presentations into dynamic storytelling experiences that impress and inform. Don’t forget to explore resources like Skillshare for further learning and inspiration to sharpen your PowerPoint and design skills.
Happy presenting!