
Welcome to a comprehensive guide on one of the most popular PowerPoint infographic templates available today — the MassFX Infographics Bundle. Created by One Skill PowerPoint, this bundle offers a vibrant and versatile collection of infographic templates designed to elevate your presentations. In this article, we’ll explore the bundle in detail, walk through how to customize your infographics with stunning shadow effects directly in PowerPoint, and demonstrate how to bring your slides to life with smooth animations.
Whether you’re a seasoned PowerPoint user or just starting out, this tutorial will empower you to create professional-looking presentations that captivate your audience. Let’s dive in!
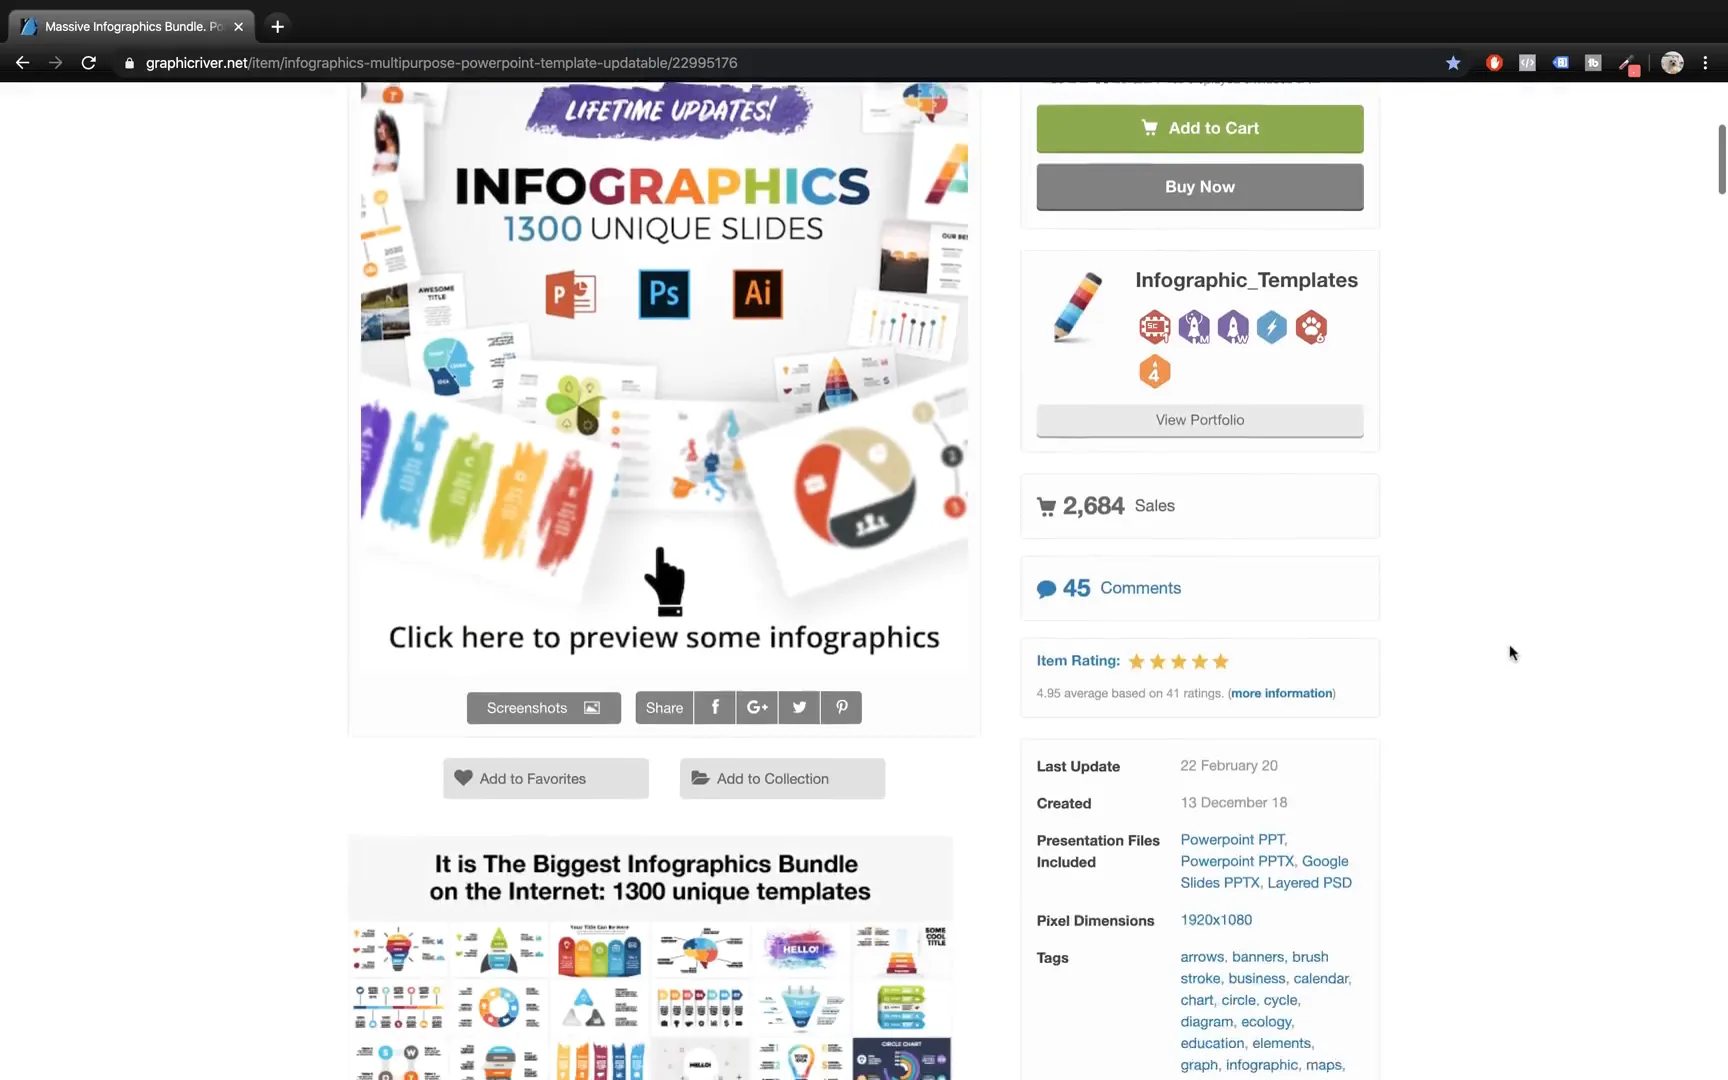
Table of Contents
- Exploring the MassFX Infographics Bundle
- Getting Started with Your Infographics
- Creating Custom Shadows in PowerPoint
- Animating Your Infographics for Impact
- Additional Tips for PowerPoint Infographics
- Frequently Asked Questions (FAQ)
- Conclusion
Exploring the MassFX Infographics Bundle
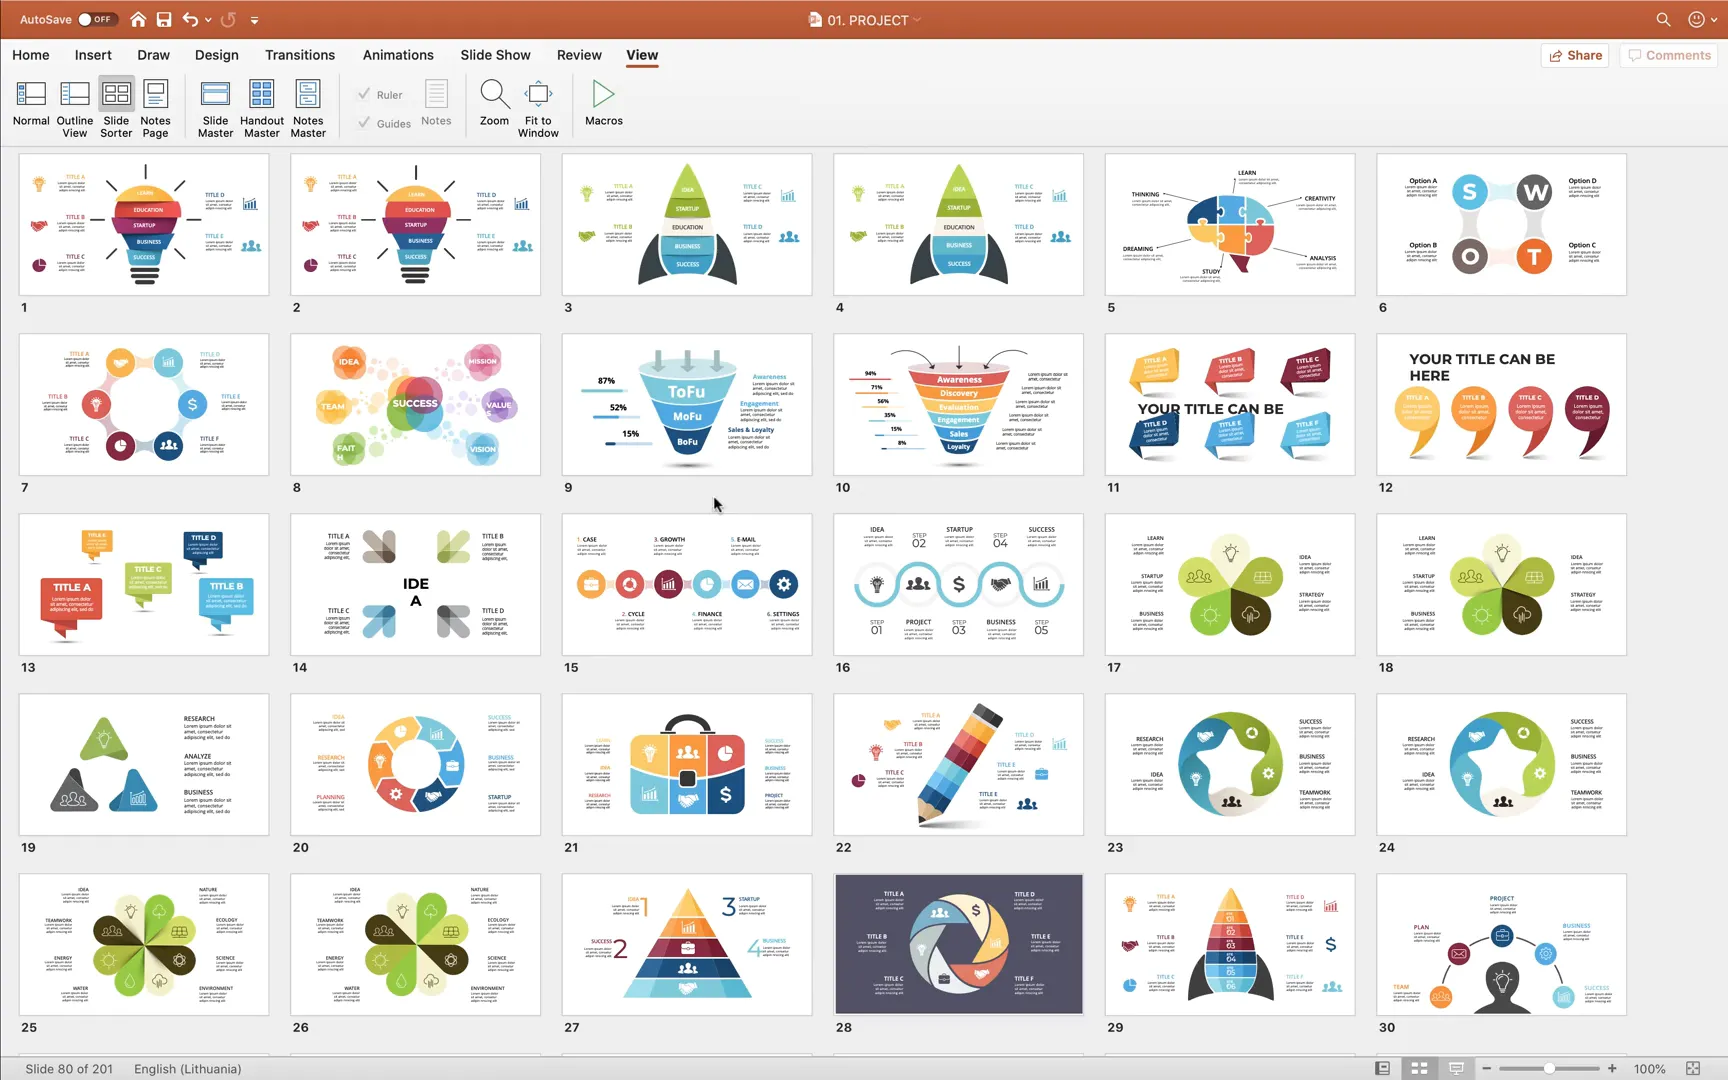
The MassFX Infographics Bundle is a collection of PowerPoint templates that offers a wide range of infographic styles, suited for various presentation needs. After purchasing and downloading the bundle, you’ll find a treasure trove of templates inside a neatly organized folder. Let’s explore what you get:
- Project Infographics: Useful for visualizing project timelines, milestones, and progress.
- Maps: Geographical data representation with editable maps.
- Arrow Infographics: Directional arrows to showcase processes or flows.
- Alphabet Infographics: Creative ways to present information alphabetically.
- Business Infographics: Tailored for corporate presentations and project overviews.
- Geometry Infographics: Shapes and forms that bring a modern look to your data.
- Dark Version Infographics: Dark-themed templates for high-contrast presentations.
- Puzzle Infographics: Visual metaphors for problem-solving or interconnected ideas.
- Education Infographics: Perfect for academic or training presentations.
- Chart Infographics: Data visualization tools for numbers and statistics.
- Diagrams: Flowcharts and process diagrams for structured information.
- Marketing Infographics: Showcase marketing strategies and data.
- Medicine Infographics: Specialized templates for healthcare topics.
- Minimal Infographics: Clean and simple designs for elegant presentations.
- Startup Infographics: Tailored for new business pitches and ideas.
- Timeline Infographics: Visualize chronological events effectively.
- Abstract Infographics: Creative and artistic designs for unique presentations.
- Banners: Visually striking elements for headers and key points.
- Ecology Infographics: Focused on environmental themes.
- Strategy Infographics: For planning and tactical presentations.
- Calendars: Useful date and schedule templates.
- Social Media Infographics: Highlight social media metrics and strategies.
In total, the bundle contains 23 templates in the newer PPTX format, along with additional PPT files compatible with older versions of PowerPoint. This ensures flexibility no matter which version you use.
Why Choose the MassFX Infographics Bundle?
The bundle stands out due to its extensive variety, colorful designs, and adaptability to different presentation topics. Whether you’re delivering a business pitch, educational lecture, or marketing plan, the templates can be customized to fit your narrative. The inclusion of both editable shapes and picture-based infographics provides options depending on your comfort level with design tools.
Moreover, the bundle’s structure allows users to pick and choose specific infographic styles, making it a versatile asset for any PowerPoint user.
Getting Started with Your Infographics
Before diving into customization, it helps to set up your workspace in PowerPoint for efficient editing. Here are some tips to help you get started:
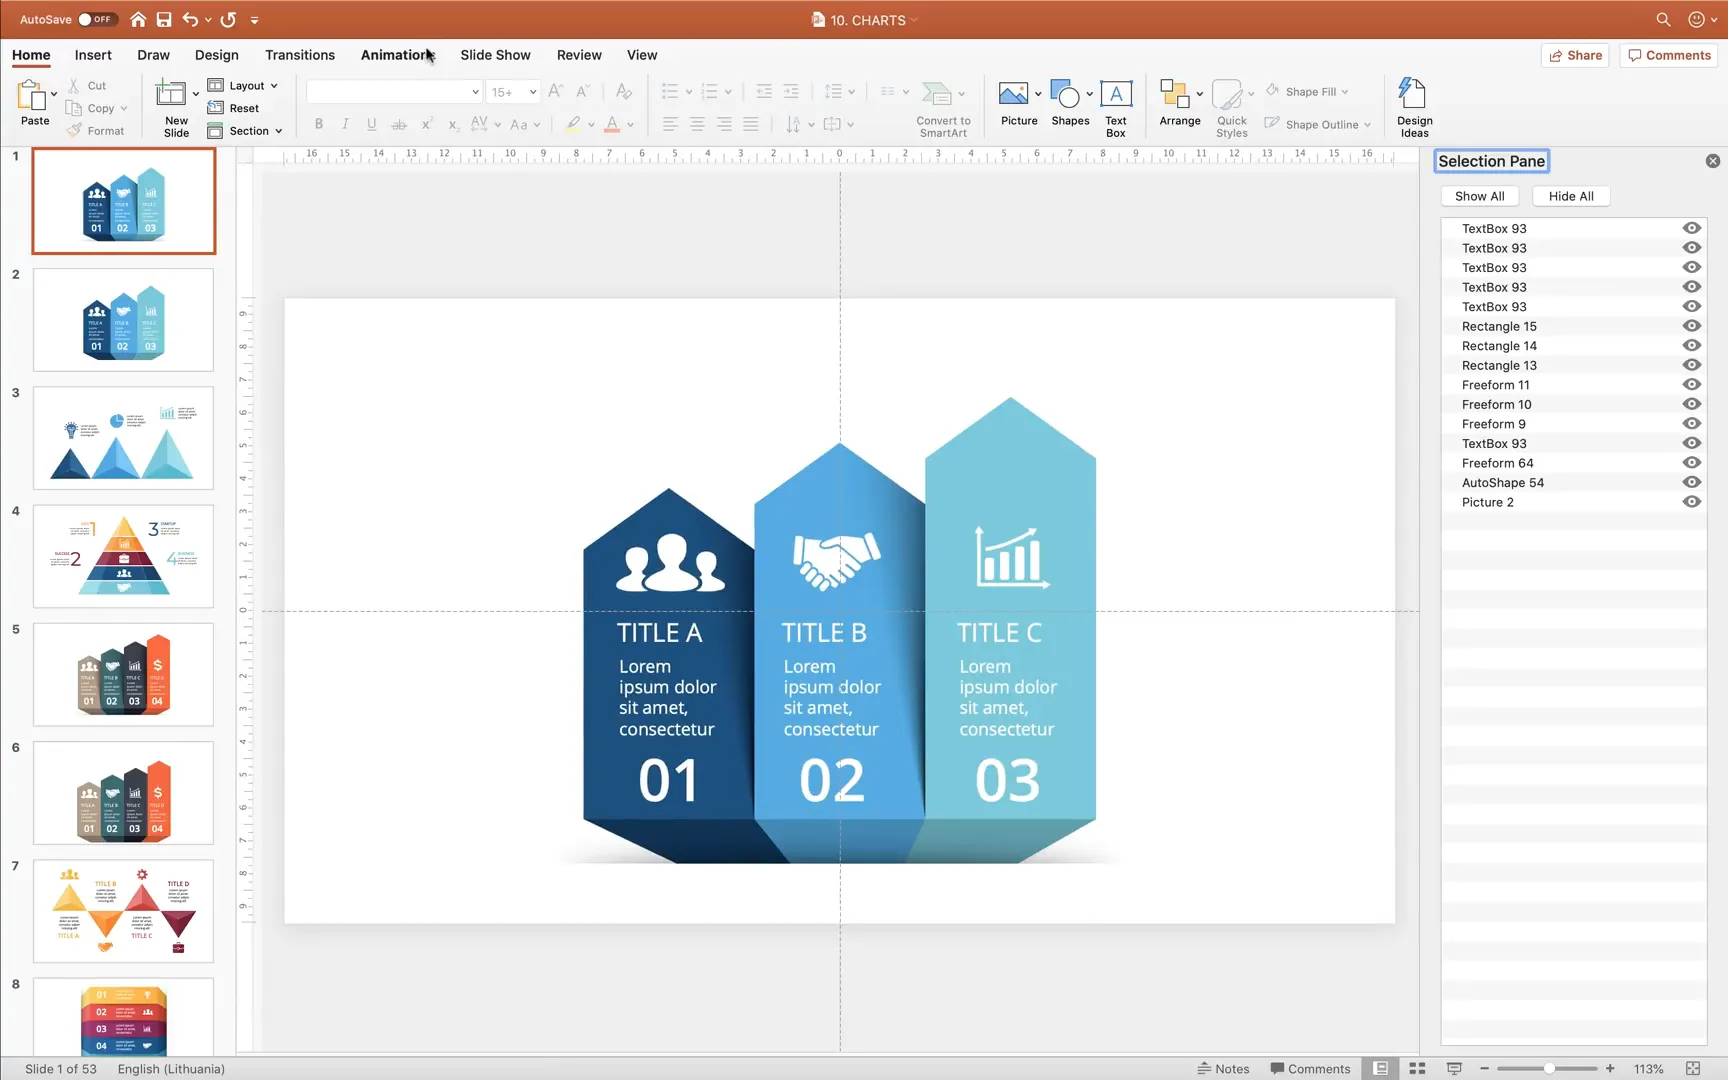
- Activate Slide Guides: Navigate to the View tab and enable Guides. This helps you identify the slide’s center and align elements precisely.
- Use the Selection Pane: This pane lists all shapes and objects on your slide, allowing you to organize, hide, or select elements quickly.
- Open the Animation Pane: Check if your slide has pre-existing animations and manage them effectively.
Understanding Editable Shapes vs. Picture Infographics
One important aspect to note is that some infographics in the bundle are made of editable shapes, while others are embedded pictures. Editable shapes allow you to change colors, sizes, and effects directly within PowerPoint, giving you greater control. Picture infographics, on the other hand, are static images that require external software like Photoshop or Adobe Illustrator for advanced edits.
Fortunately, you can still enhance picture infographics in PowerPoint by applying creative effects such as shadows and animations, which we’ll cover next.
Creating Custom Shadows in PowerPoint
Adding shadows to your infographics can add depth and a professional touch to your slides. While some shadow effects might traditionally be created in Photoshop, you can achieve similar stunning results directly inside PowerPoint using gradients and layering techniques.
Here’s a step-by-step guide to creating custom shadow effects for your infographic shapes:
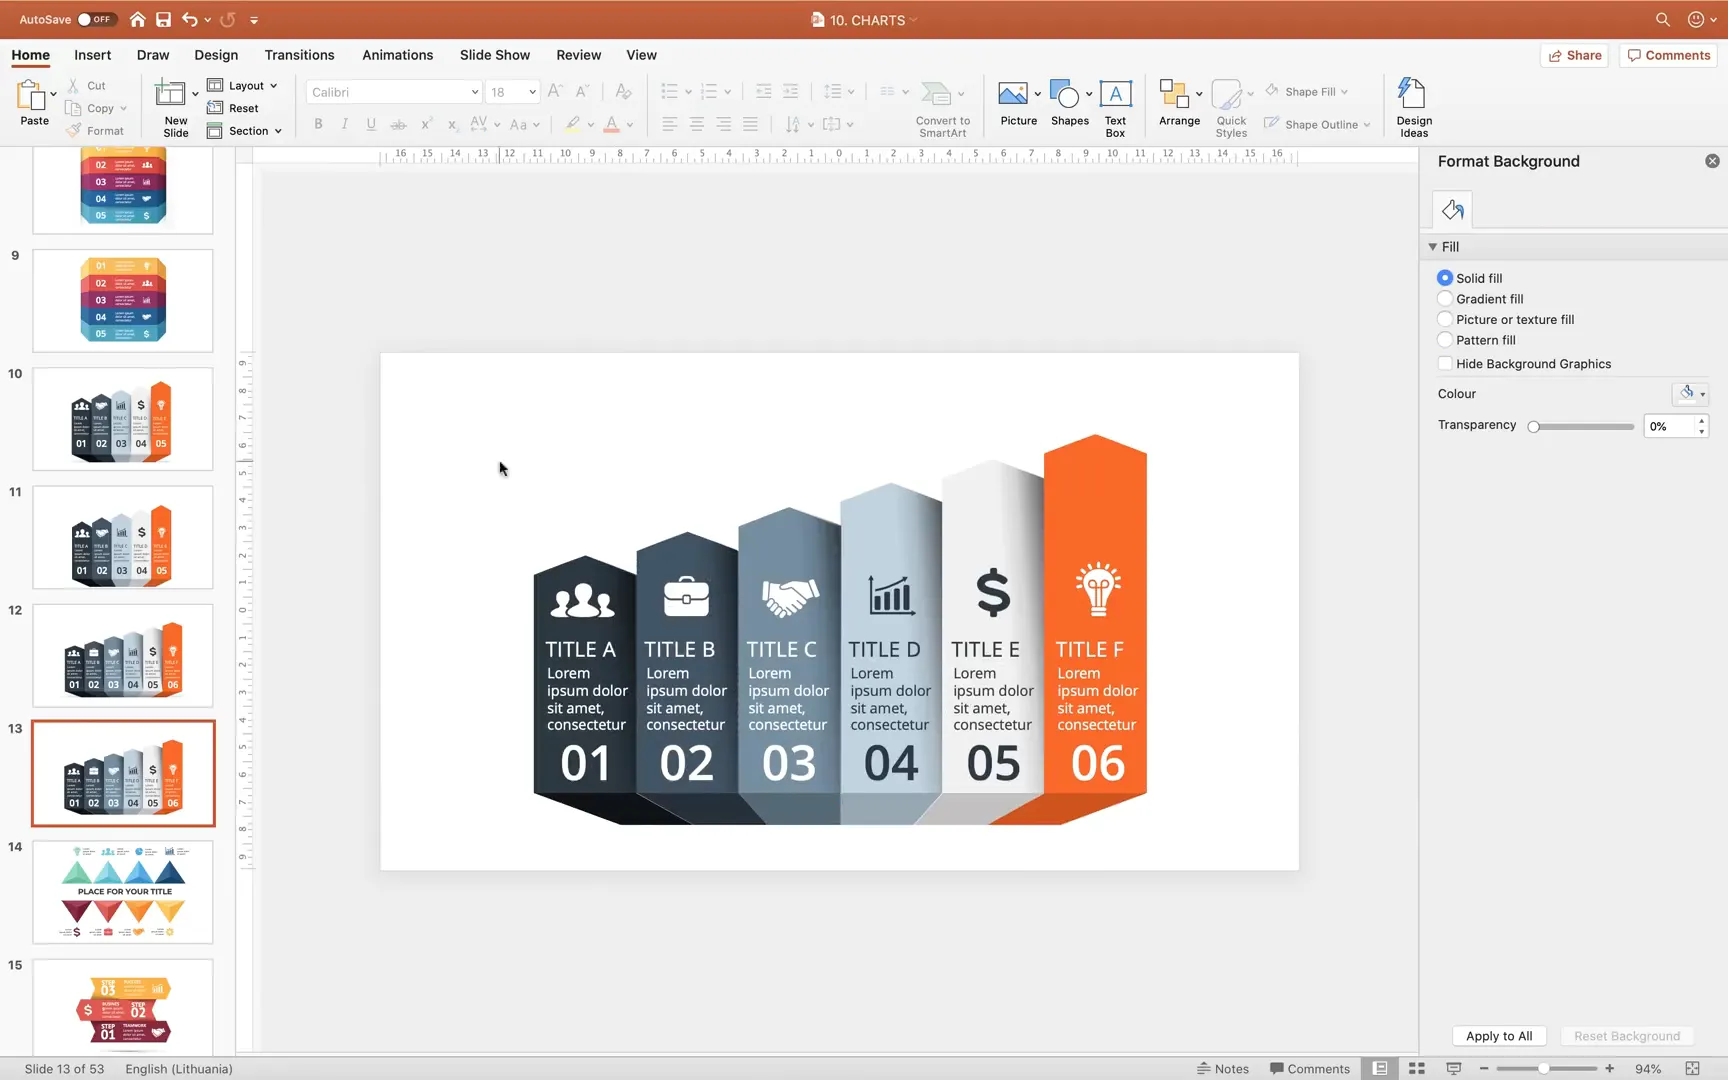
Step 1: Ungroup Your Infographic
Start by selecting the infographic you want to enhance. Right-click and choose Ungroup to break it down into individual shapes. This allows you to work on each element separately.
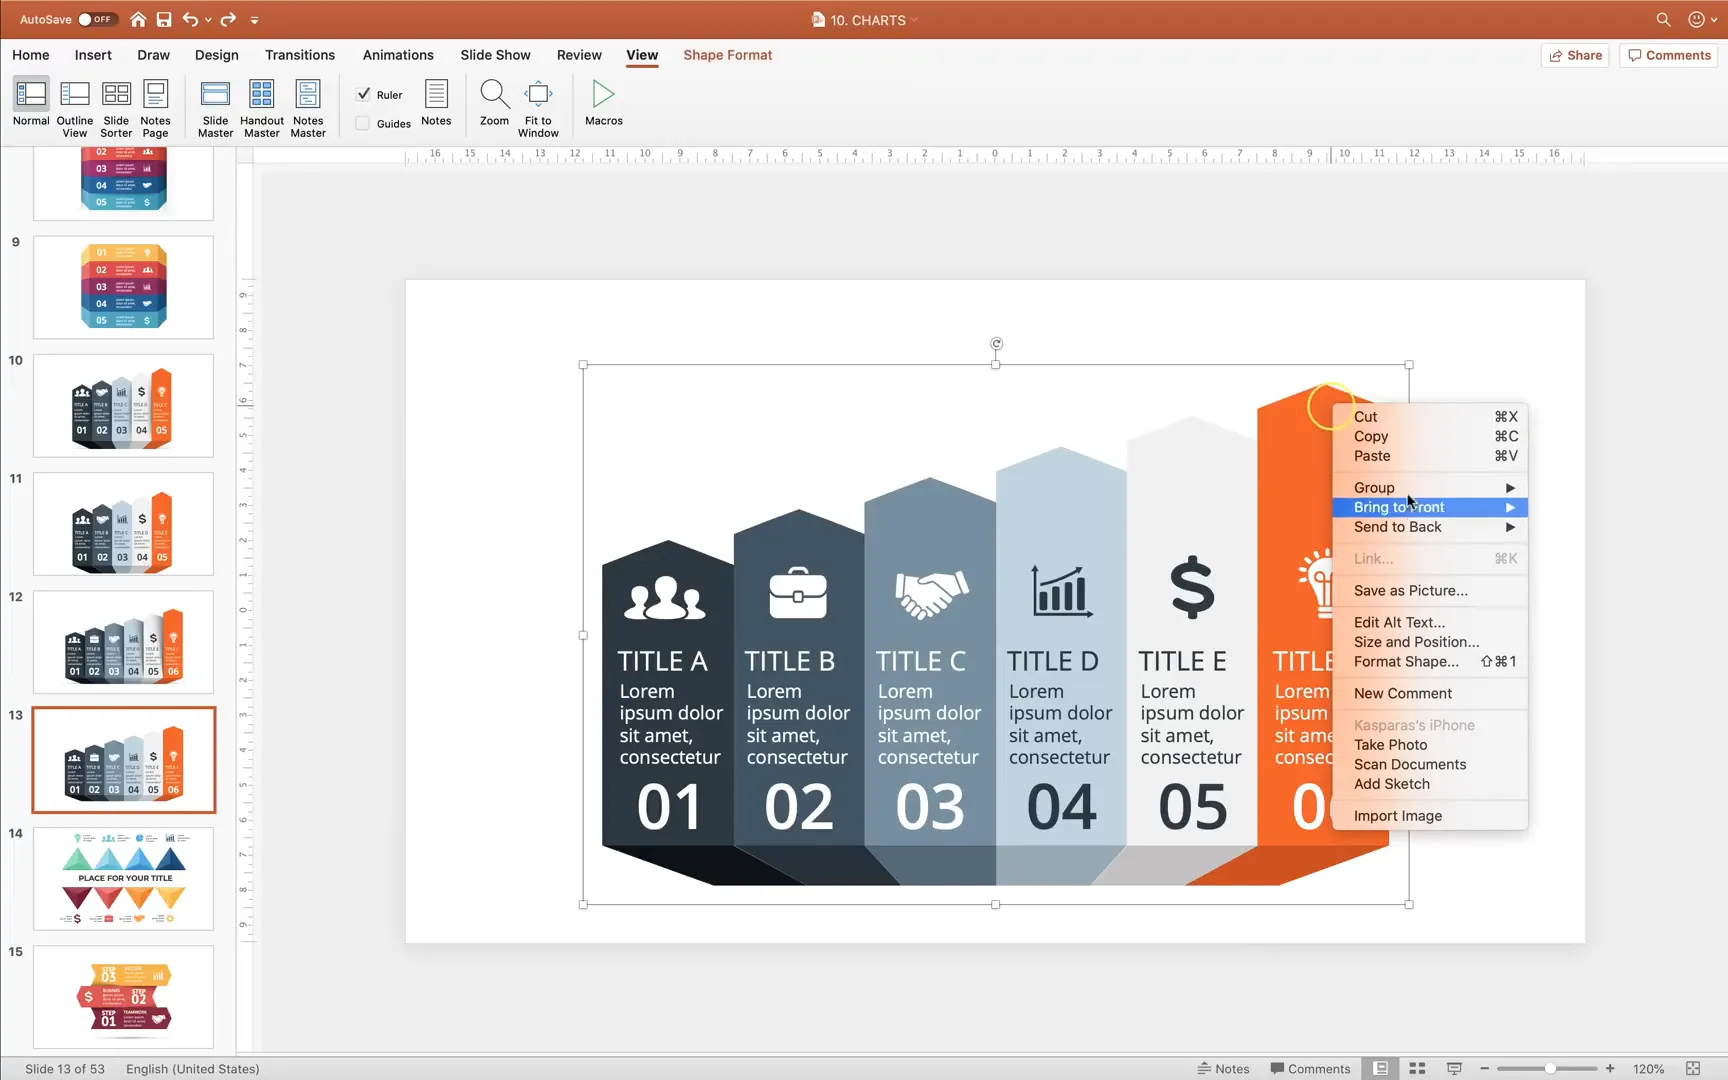
Step 2: Identify Shapes for Shadow Effect
In the example, the shadow effect is applied to five specific shapes. Select these shapes carefully, as these will be duplicated to create shadows.
Step 3: Duplicate the Shapes
Copy the selected shapes by holding down the Shift key and pressing Ctrl+C (or Command+C on Mac), then paste them on top using Ctrl+V (or Command+V).
These copies will serve as the shadow layers.
Step 4: Arrange Layers
Bring all icons and text boxes to the front so that the shadows don’t overlap or obscure important information. This creates a clean layering effect where shadows sit behind the main shapes.
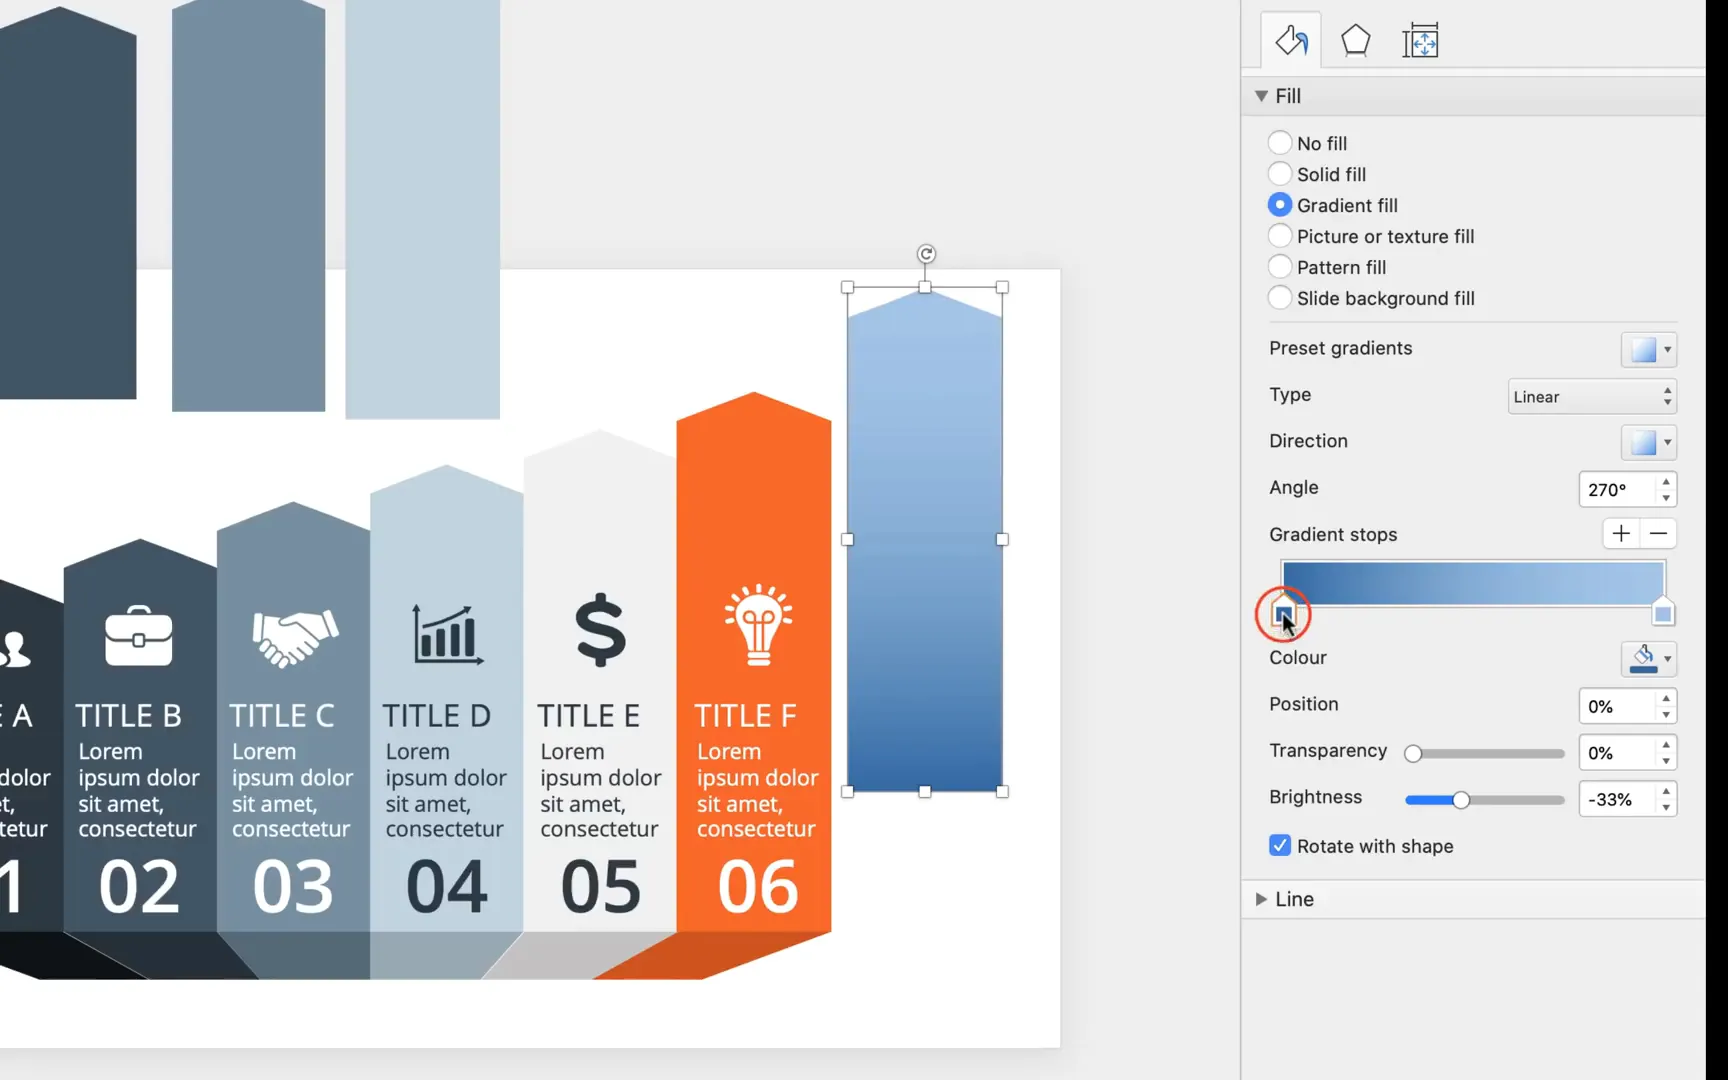
Step 5: Modify Gradient Fill for Shadows
Now, select one of the duplicated shapes. Go to the Fill options and switch to Gradient Fill. You’ll see gradient stops representing colors in the slider. Adjust these as follows:
- Remove unnecessary middle colors by dragging them out of the slider.
- Set the left gradient stop to pure white and the right gradient stop to black.
- Bring the gradient stops closer together to intensify the gradient effect.
- Rotate the gradient angle to approximately 355 degrees to mimic natural shadow direction.
- Adjust transparency levels for gradient stops to create a smooth fade effect.
- Add intermediate gradient stops for a more nuanced shadow gradient, tweaking transparency and position for realism.
This creates a shadow shape that looks soft and natural.
Step 6: Align Shadow Shapes
Align each shadow shape precisely under its original shape. Use PowerPoint’s Align tools to snap shadows to the left and top edges of the corresponding original shapes. You can also use smart guides to eyeball the alignment.
Step 7: Repeat for Other Shapes
Copy the shadow formatting and apply it to the other duplicated shapes. Align each shadow similarly to maintain consistency across the infographic.

By following these steps, you’ll create a visually appealing shadow effect that adds depth and professionalism to your infographics without needing external software.
Animating Your Infographics for Impact
Animations enhance presentations by guiding the audience’s attention and making content more engaging. Surprisingly, many infographic templates come without animations by default, but adding them is straightforward.
Step 1: Group Your Shapes
Group infographic elements that should animate together. For example, group related shapes or icons into logical units. This keeps animations organized and manageable.
Remember to delete any unnecessary transparent shapes that might interfere with the animation.
Step 2: Apply Float In Animation
Select the first group and navigate to the Animations tab. Choose the Float In animation and set the direction to Float Up. This animation brings shapes into view smoothly.
Step 3: Copy Animation with Animation Painter
Use the Animation Painter tool to quickly copy the animation effect to other groups. This ensures a consistent animation style throughout your infographic.
Step 4: Set Animation Triggers
By default, animations start on click, allowing you to control the pacing of your presentation. You can preview the slide in full screen to see how the animations look in action.
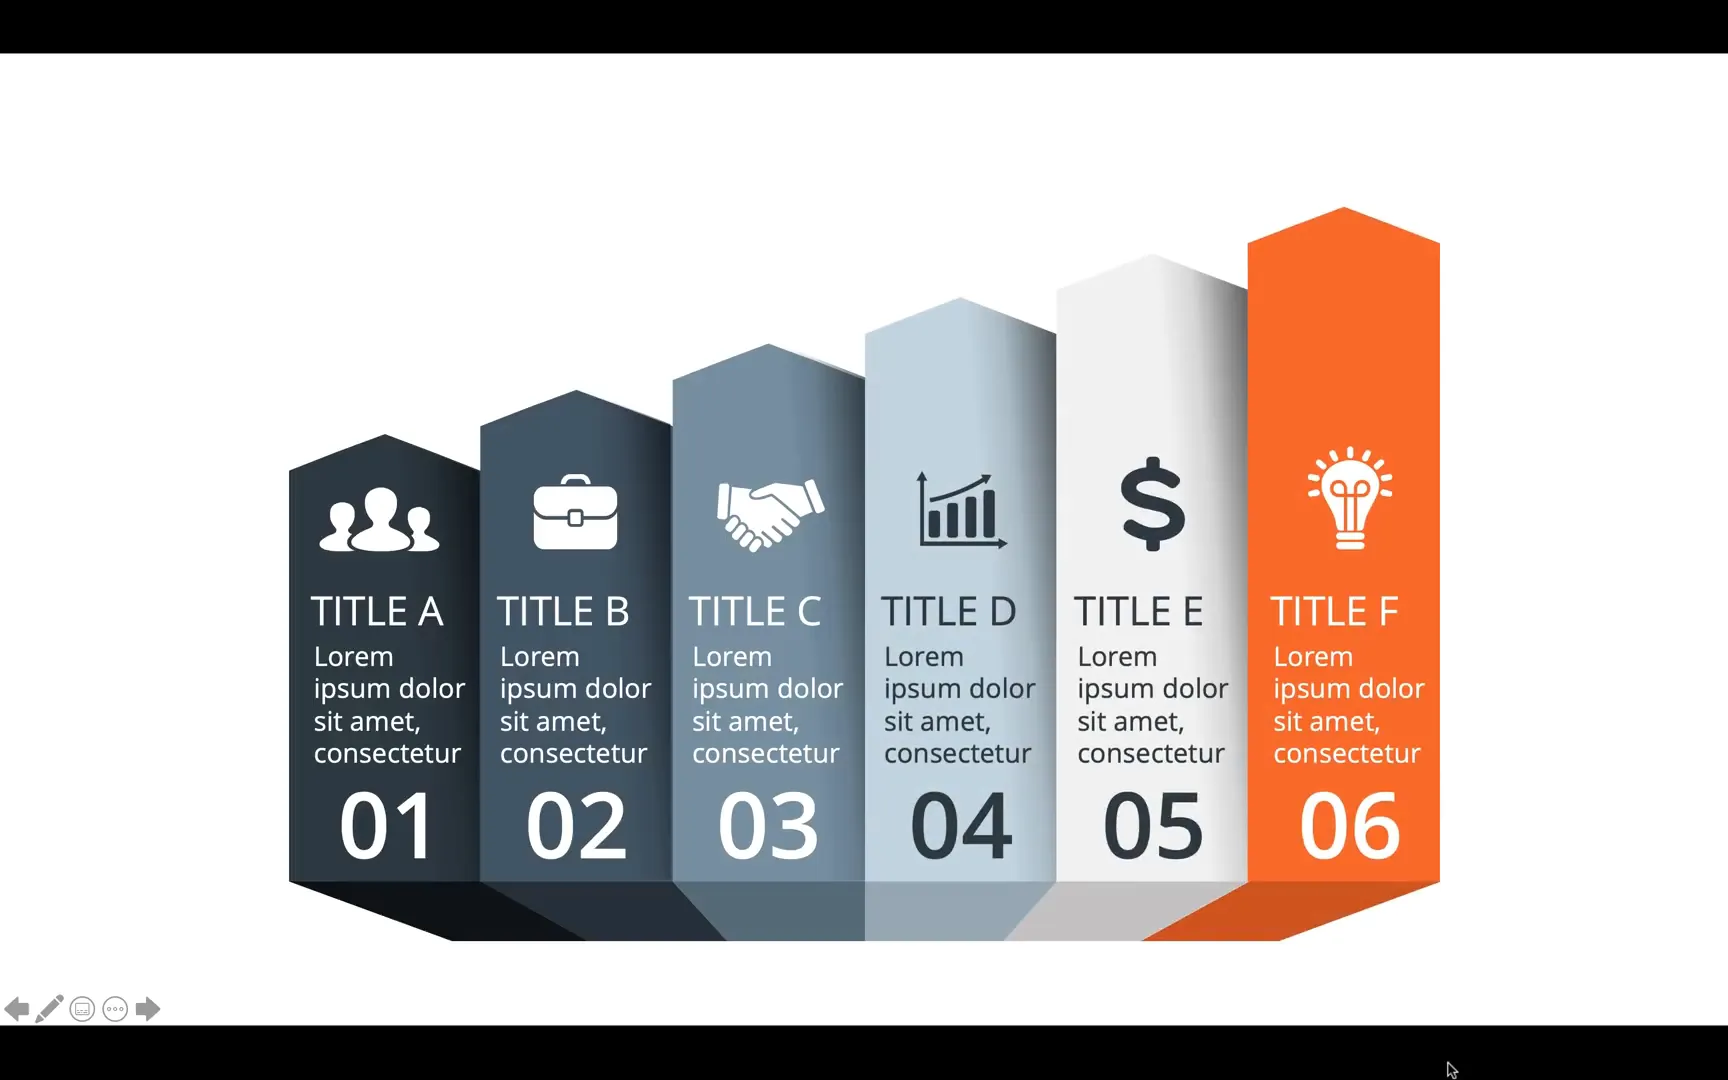
This simple animation technique can transform static slides into dynamic visual stories, keeping your audience engaged and focused.
Additional Tips for PowerPoint Infographics
- Use Slide Guides: Always enable slide guides and rulers to maintain alignment and balance in your layouts.
- Leverage the Selection Pane: Organize layers and elements efficiently to avoid confusion while editing.
- Experiment with Color Palettes: Customize template colors to match your branding or theme.
- Keep Animations Consistent: Avoid overusing different animation types to maintain a professional look.
- Regularly Save Your Work: PowerPoint can occasionally crash, especially with complex animations and graphics.
Frequently Asked Questions (FAQ)
Q1: Are the infographics in the MassFX Infographics Bundle editable?
Yes, many infographics in the bundle are made from editable shapes within PowerPoint, allowing you to change colors, sizes, and effects. However, some infographics are pictures that require external software like Photoshop or Illustrator for advanced edits.
Q2: Can I add shadows and animations to picture-based infographics?
Absolutely! While you cannot edit the picture itself directly in PowerPoint, you can overlay shadow shapes and apply animations to enhance the visual appeal.
Q3: What versions of PowerPoint are compatible with the bundle?
The bundle includes both PPTX files for modern versions and PPT files for older versions, ensuring wide compatibility.
Q4: How do I align multiple shapes accurately in PowerPoint?
Use the Align options under the Format tab to align objects left, right, top, bottom, or center. Smart guides also appear when dragging objects to help with precise placement.
Q5: Can I customize the animation effects in the infographics?
Yes, you can choose from various animation effects in PowerPoint. The Float In animation is a popular choice, but feel free to experiment with others like Fade, Zoom, or Wipe to suit your presentation style.
Q6: Is it possible to animate multiple infographic elements to appear sequentially?
Definitely. Group your shapes logically and apply animations with the ‘Start On Click’ trigger. This allows you to control the flow of information step-by-step during your presentation.
Conclusion
The MassFX Infographics Bundle is an incredible resource for anyone looking to supercharge their PowerPoint presentations with professional, colorful, and versatile infographics. By mastering simple techniques like creating custom shadows and adding animations, you can elevate the visual impact of your slides without needing advanced graphic design skills or external software.
Remember to organize your workspace with slide guides and selection panes, ungroup and customize shapes carefully, and animate your infographics thoughtfully to maintain audience engagement. With these skills, your presentations will not only look stunning but also communicate your message more effectively.
Thank you for exploring this guide. Apply these tips to your next presentation and watch your infographics come alive!
Check out the full video: Most Popular PowerPoint Templates 🔥Infographics Bundle 🔥


