PowerPoint presentations are a cornerstone of effective communication, whether you’re delivering a business pitch, sharing project insights, or educating an audience. One of the most engaging ways to present complex information is through well-designed infographics that visually break down steps, processes, or ideas. In this comprehensive guide, you’ll learn how to create a stunning six-step hexagon shape infographic slide in PowerPoint—a design that not only looks professional but also enhances the clarity of your message.
This tutorial, inspired by expert techniques from POWERPOINT UNIVERSITY, walks you through the entire process of building a hexagon infographic with vibrant color gradients, shadow effects, and text elements. You’ll gain hands-on knowledge of PowerPoint’s shape tools, alignment features, and gradient fills to achieve a polished animated slide design that stands out.
Whether you’re a beginner or an intermediate PowerPoint user looking to elevate your slide design skills, this article will help you master the art of creating an eye-catching, multi-step infographic using hexagon shapes. Plus, by the end, you’ll be equipped with tips to customize colors, add shadows, and incorporate text for a fully functional and visually compelling slide.
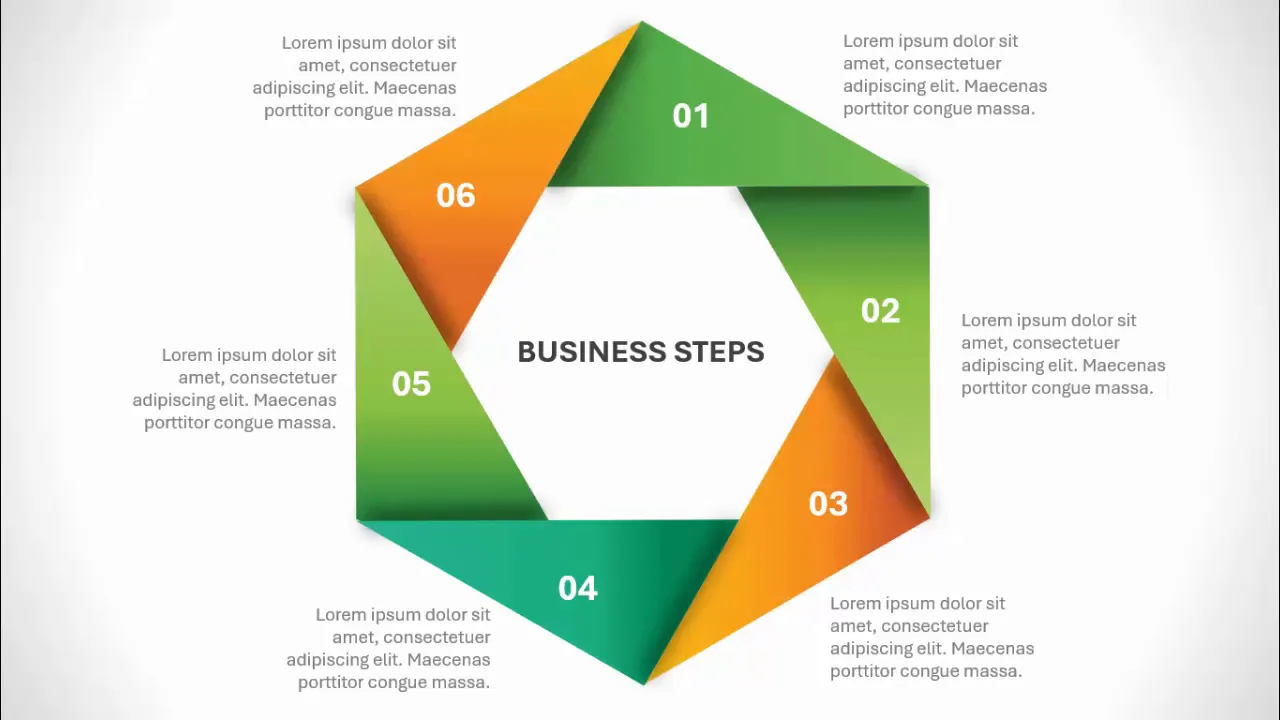
Table of Contents
- Why Use Hexagon Infographics in PowerPoint?
- Preparing Your PowerPoint Slide
- Creating the Six-Step Hexagon Shape
- Applying Gradient Colors to Hexagon Segments
- Adding Shadow Effects for Depth
- Inserting Text and Labels
- Final Touches and Basic Animation
- Frequently Asked Questions
- Conclusion
Why Use Hexagon Infographics in PowerPoint?
Infographics are powerful tools that help break down complex information into digestible visual elements. Among the many shapes available in PowerPoint, hexagons offer a unique blend of geometric appeal and versatility. Here’s why hexagon infographics are a great choice for your presentations:
- Visual Harmony: Hexagons tessellate neatly, allowing for clean, interconnected designs that portray steps or segments cohesively.
- Modern Appeal: The six-sided shape is visually interesting and modern, making your slides look fresh and professional.
- Flexibility: Hexagons can be arranged in various configurations, perfect for representing processes, stages, or options.
- Space Efficiency: Their compact shape allows you to fit multiple segments in a balanced layout without cluttering the slide.
Using a six-step hexagon infographic is particularly effective for presentations that require outlining processes, options, or strategic plans in a step-by-step manner. It enhances audience engagement by guiding their eyes through each segment intuitively.
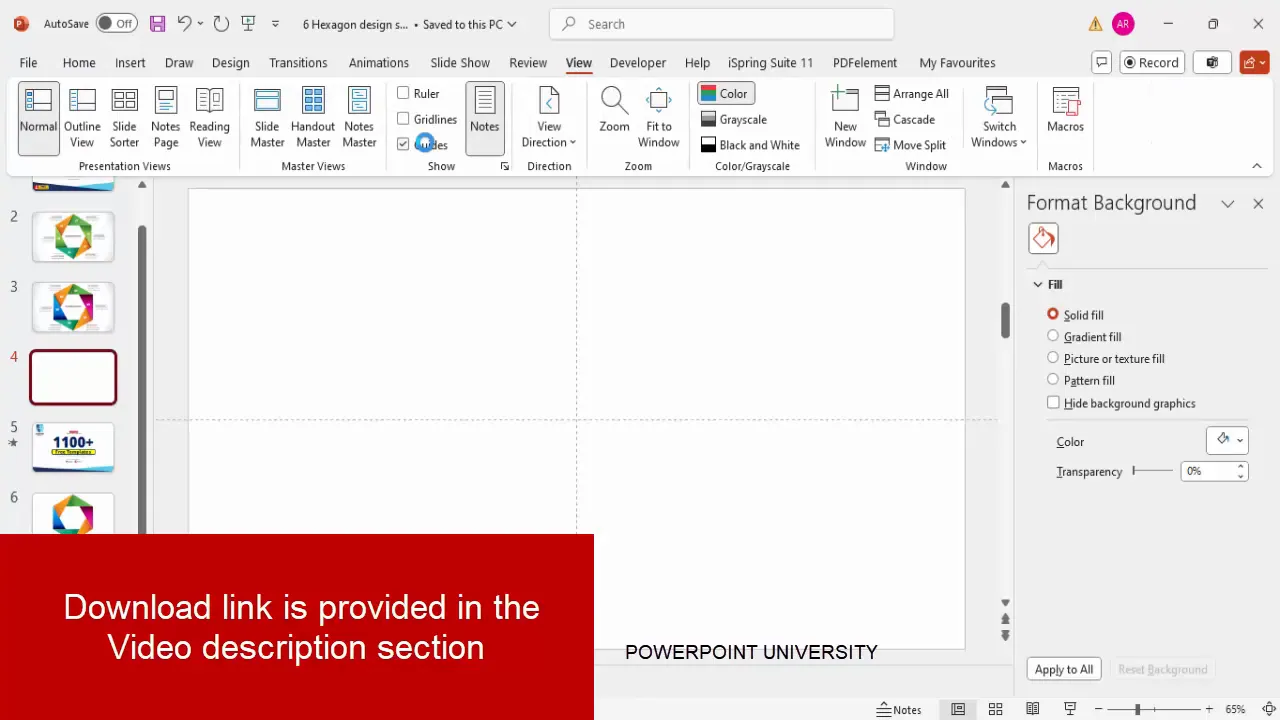
Preparing Your PowerPoint Slide
Before diving into the design, it’s essential to set up your PowerPoint slide for precision and ease of use. Here’s how to prepare your workspace:
- Add a New Slide: Start with a fresh slide to avoid clutter and confusion.
- Enable Guides: Go to the View tab and enable Guides. These help you align shapes perfectly, maintaining symmetry and balance.
Guides act as invisible rulers, ensuring your shapes are centered and evenly spaced, which is crucial when working with geometric designs like hexagons.
Creating the Six-Step Hexagon Shape
The core of this infographic is the hexagon divided into six segments. To create this, we’ll use a combination of triangles and a hexagon shape, then merge and fragment them to form the six distinct parts.
Step 1: Insert and Customize the Triangle Shape
- Go to Insert > Shapes and select the Triangle.
- Draw the triangle and set its dimensions: height to 5.15 and width to 6 (these are approximate values to maintain proportion).
- Align the triangle to center and middle using the Align options.
- Remove the outline by selecting Shape Outline > No Outline.
- Make the triangle slightly transparent for easier alignment with other shapes later.
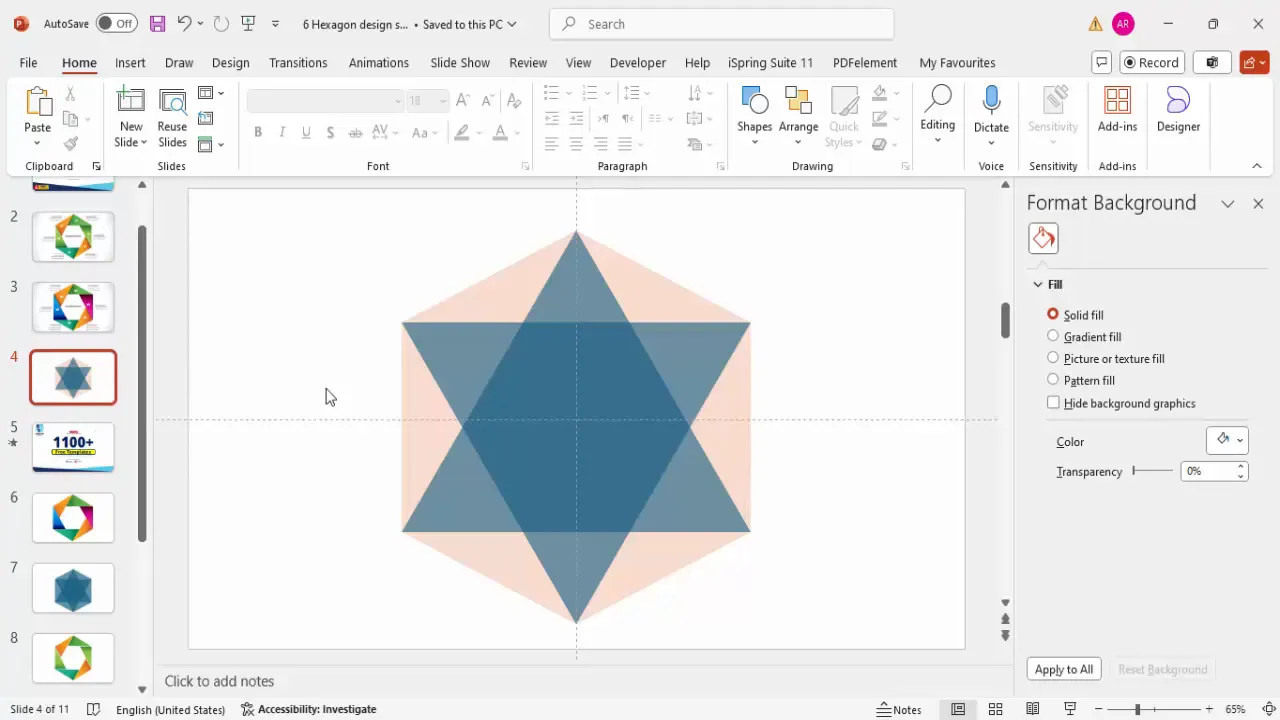
Step 2: Duplicate and Rotate the Triangle
To form the six segments, duplicate the triangle and rotate it around a central point.
- Press Ctrl + D to duplicate the triangle.
- Hold the Alt key and press the right arrow key 12 times to rotate the triangle by 30 degrees each time (12 x 30° = 360°, full circle).
- Arrange the triangles in a circular formation so they overlap and form a star-like shape.
Step 3: Insert the Hexagon Shape
- Insert a Hexagon from Insert > Shapes.
- Rotate the hexagon so that one of its corners points directly upwards (use Alt + right arrow six times to rotate by 180 degrees).
- Set the hexagon’s height and width to 6.
- Make the hexagon transparent and remove its outline for easy alignment.
- Position the hexagon on top of the star-like triangle arrangement to form the core shape.
Step 4: Align and Adjust Shapes
Make sure all triangles and the hexagon are perfectly aligned, with corners matching precisely to create a seamless six-segment hexagon.
Step 5: Duplicate the Slide for Backup
Before proceeding with merging and fragmenting shapes, duplicate your slide. This acts as a backup in case you want to revert or try a different approach without losing your progress.
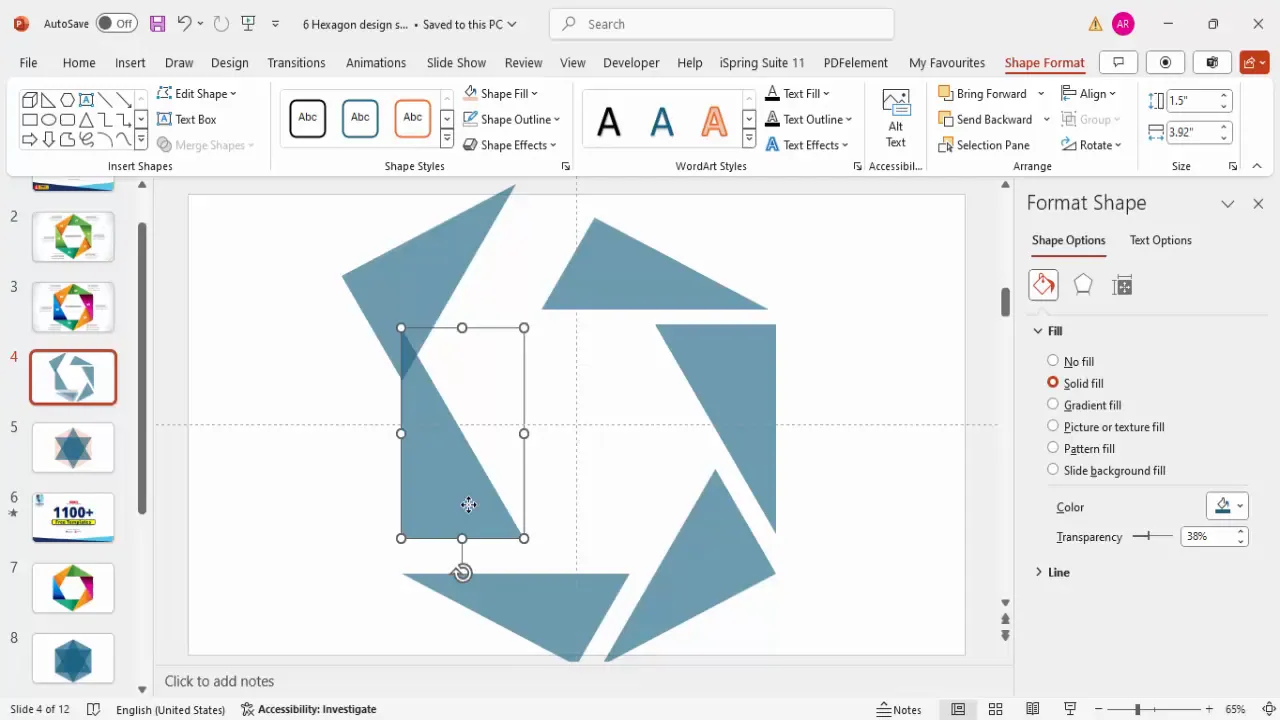
Step 6: Merge and Fragment the Shapes
Now, select all the shapes (press Ctrl + A) and use the Merge Shapes > Fragment option in the Shape Format tab. This will break the complex shape into individual segments.
Delete the center hexagon piece that remains after fragmentation, as it’s no longer needed.
Step 7: Union Segments to Form Six Parts
Merge specific fragmented pieces to form the six distinct hexagon segments:
- Select two adjacent pieces and use Merge Shapes > Union.
- Repeat this process until you have six unified shapes representing each step or segment of the hexagon.
Applying Gradient Colors to Hexagon Segments
With the six segments ready, it’s time to bring the infographic to life by applying beautiful gradient fills that add depth and visual interest.
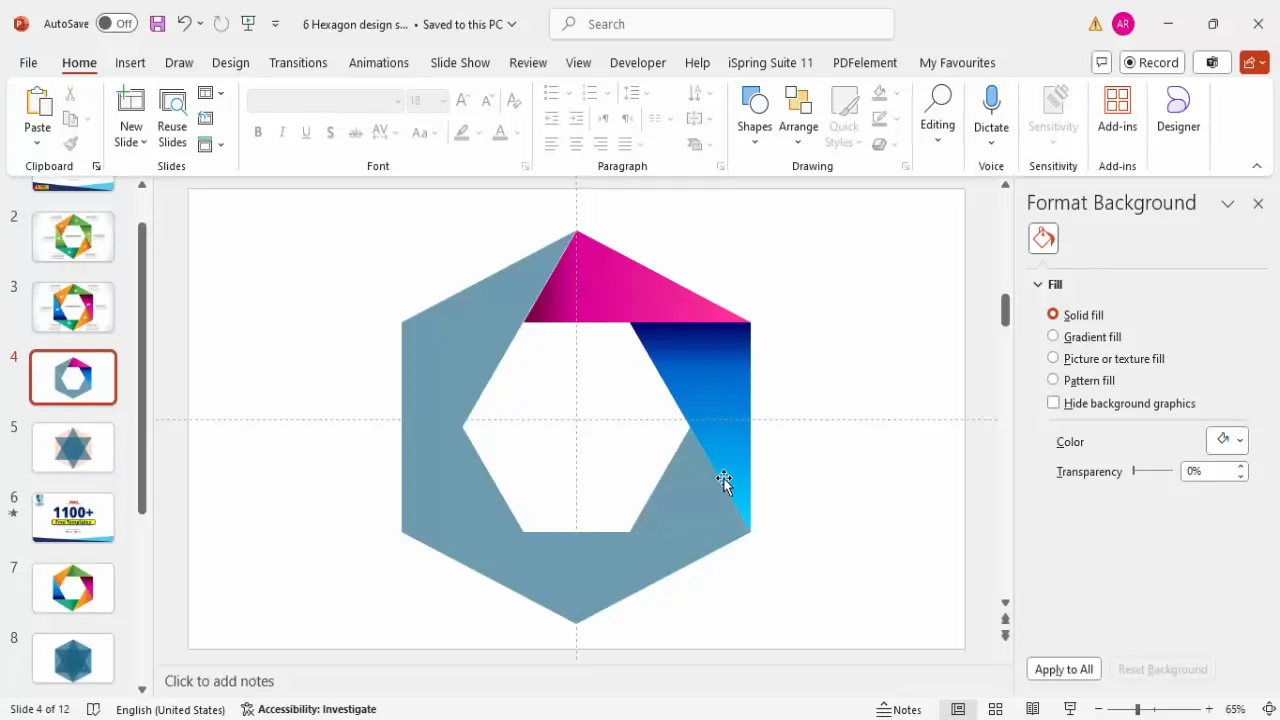
Step 1: Select a Segment and Apply Gradient Fill
- Click on a segment and go to Shape Format > Shape Fill > Gradient Fill.
- By default, PowerPoint shows four gradient stops; adjust this to three stops for a smooth transition.
- Add an additional stop by clicking on the gradient bar.
Step 2: Choose Gradient Colors
Choose a color scheme for each segment. For example, you can select a dark purple, a medium purple, and a light purple for the first segment. The first stop should be the darkest color on the left, moving to lighter shades on the right.
Step 3: Set Gradient Direction
Ensure the gradient type is Linear and adjust the direction so the darker color is on the left side of the segment, fading to lighter shades on the right. This gives a subtle 3D effect.
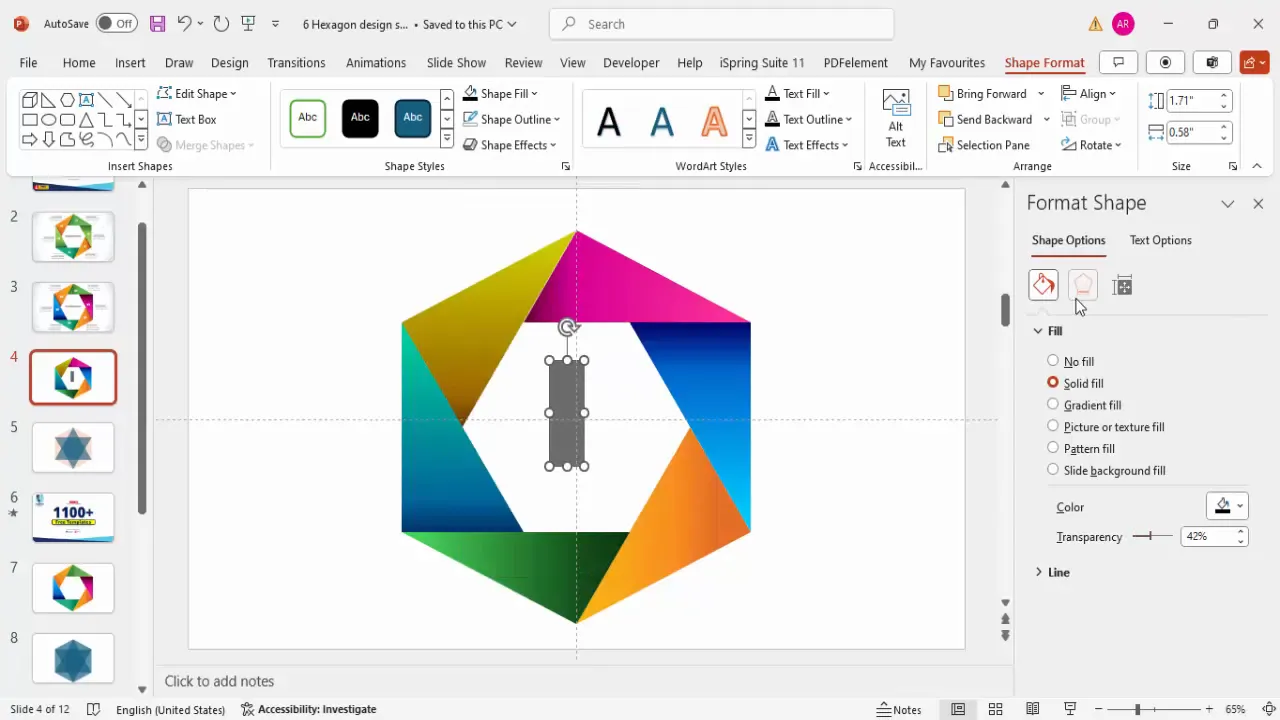
Step 4: Copy Gradient to Other Segments
Use the Format Painter tool to copy the gradient fill to other segments. Then, customize each segment’s gradient colors to create a diverse palette.

Color Combinations to Try
| Segment | Dark Color | Medium Color | Light Color |
|---|---|---|---|
| 1 | Dark Purple | Medium Purple | Light Purple |
| 2 | Dark Blue | Medium Blue | Light Blue |
| 3 | Dark Teal | Medium Teal | Light Teal |
| 4 | Dark Green | Medium Green | Light Green |
| 5 | Dark Orange | Medium Orange | Light Orange |
| 6 | Dark Brown | Medium Brown | Light Brown |
This approach creates a vibrant and engaging infographic that clearly differentiates each step while maintaining a cohesive look.
Adding Shadow Effects for Depth
To enhance the visual appeal and add a sense of depth to your infographic, you can add subtle shadow effects behind each hexagon segment.
Step 1: Insert Shadow Shape
- Go to Insert > Shapes and select the Rectangle.
- Draw a small rectangle near the edge of a hexagon segment where you want the shadow to appear.
- Remove the outline by selecting Shape Outline > No Outline.
- Fill the rectangle with black and adjust transparency to make it subtle.
Step 2: Apply Soft Edges
Go to Shape Effects > Soft Edges and increase the soft edges to blur the shadow, making it look natural.
Step 3: Position and Duplicate Shadows
- Rotate and position the shadow rectangles to align with each hexagon segment.
- Duplicate the shadow shapes (Ctrl + D) and rotate them accordingly for all six segments.
- Send the shadow shapes to the back (Right-click > Send to Back) so they don’t cover your colored segments.
Inserting Text and Labels
Adding descriptive text and labels is critical for conveying the meaning behind each segment of your infographic. Here’s how to add clear, readable text to your hexagon infographic.
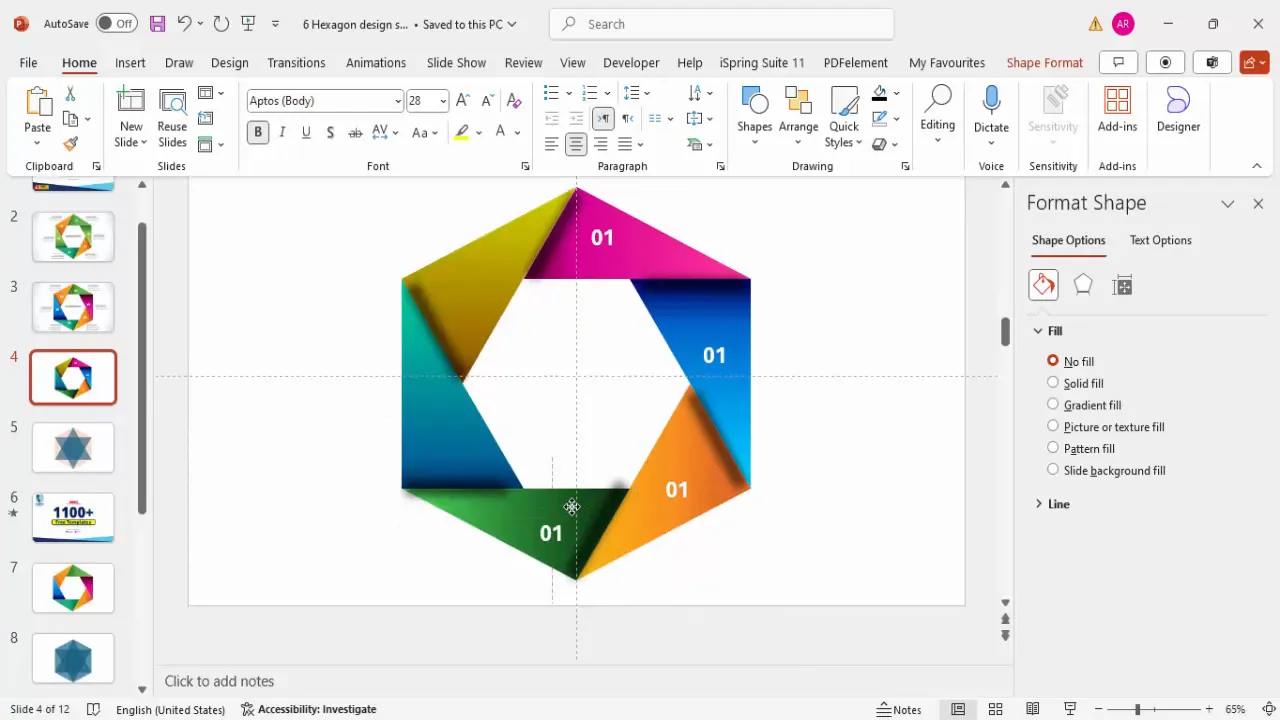
Step 1: Add Option Numbers
- Insert a text box and type “01” (or the corresponding step number).
- Center-align the text, make it bold, and increase the font size to around 28 points for visibility.
- Set the font color to white for strong contrast against the colored background.
- Duplicate this text box for all six segments and update the numbers accordingly (01, 02, 03, etc.).
Step 2: Add Detailed Descriptions
- Insert smaller text boxes near each segment to add detailed descriptions or options.
- Use a smaller font size (12 to 14 points) to fit the text comfortably without overcrowding.
- Align the text boxes to the right or left as needed to maintain a clean layout.
- Duplicate and edit each description for all six steps.
Final Touches and Basic Animation
Once your infographic is visually complete, consider adding basic animation effects to engage your audience further. Simple entrance animations can help emphasize each step sequentially during your presentation.
- Use Animations > Appear or Fade for each hexagon segment and corresponding text.
- Set animation timing to trigger On Click so you control the flow during your presentation.
- Test your animation sequence in Slide Show mode to ensure smooth transitions.
Adding animation not only makes your slide dynamic but also directs audience attention step-by-step, enhancing comprehension.
Frequently Asked Questions
What is the benefit of using gradient fills instead of solid colors?
Gradient fills add depth and a more modern, polished look to shapes compared to flat colors. They help create the illusion of light and shadow, making your infographic visually appealing and professional.
Can I customize the number of steps in the hexagon infographic?
Yes! Although this tutorial focuses on six steps, you can adjust the number of segments by changing the number of duplicated and rotated triangles before merging. For example, for a four-step infographic, rotate four triangles at 90-degree increments.
How do I ensure my infographic is aligned and symmetrical?
Using PowerPoint’s Guides and Align tools is crucial. Enable guides from the View tab, and use Align Center and Align Middle to position shapes precisely. This ensures a balanced and professional look.
Is it possible to animate the infographic automatically?
Yes, you can set animations to play With Previous or After Previous under the Animations tab for automatic progression. However, manual control with On Click is often preferred to engage the audience interactively.
Can I download pre-made hexagon infographic templates?
Absolutely! Many PowerPoint template websites, including POWERPOINT UNIVERSITY, offer free downloadable hexagon infographic templates. These can save time and provide inspiration for your custom designs.
Conclusion
Creating a six-step hexagon shape infographic in PowerPoint is a fantastic way to visually communicate processes, options, or stages in a presentation. By following this detailed guide, you now have the skills to design a vibrant, professional-looking infographic using PowerPoint’s built-in shapes, gradient fills, and shadow effects.
This PowerPoint animated slide design combines geometric precision with creative color usage, making your presentations more engaging and easier to follow. Remember to leverage PowerPoint’s alignment tools and the format painter to maintain consistency and speed up your workflow.
With a little practice, you’ll be able to customize this infographic further, adding your brand colors, icons, or animations to tailor it perfectly to your audience’s needs. Whether for corporate presentations, educational content, or marketing pitches, this hexagon infographic design will help you deliver your message with clarity and style.
Ready to enhance your PowerPoint skills and create more stunning slides? Explore additional templates and tutorials to keep your presentations fresh and impactful.
Check out the full video: Create 6 Step Hexagon Shape Infographic Slide in PowerPoint


