
If you’re looking to elevate your PowerPoint presentations with engaging visuals and dynamic content, learning PowerPoint Design Animation is a must. In this detailed guide, you’ll discover how to create an amazing animated infographic in PowerPoint, perfect for comparing products, services, or any other two elements you want to showcase side by side. This tutorial walks you through designing a modern slide layout and adding smooth animations that bring your infographic to life.
Whether you’re a seasoned presenter or just starting out, mastering these techniques will make your presentations stand out, helping you communicate your message more effectively. Let’s dive in!
Table of Contents
- Getting Started: Setting Up Your Slide
- Creating the Base White Shape with Shadow
- Designing Product Labels and Colorful Bubbles
- Adding Subtle Rounded Rectangle Background Elements
- Creating Animated Sliding Bars
- Animation Techniques and Fine-tuning
- Finalizing the Animated Infographic
- Frequently Asked Questions (FAQ)
- Conclusion
Getting Started: Setting Up Your Slide
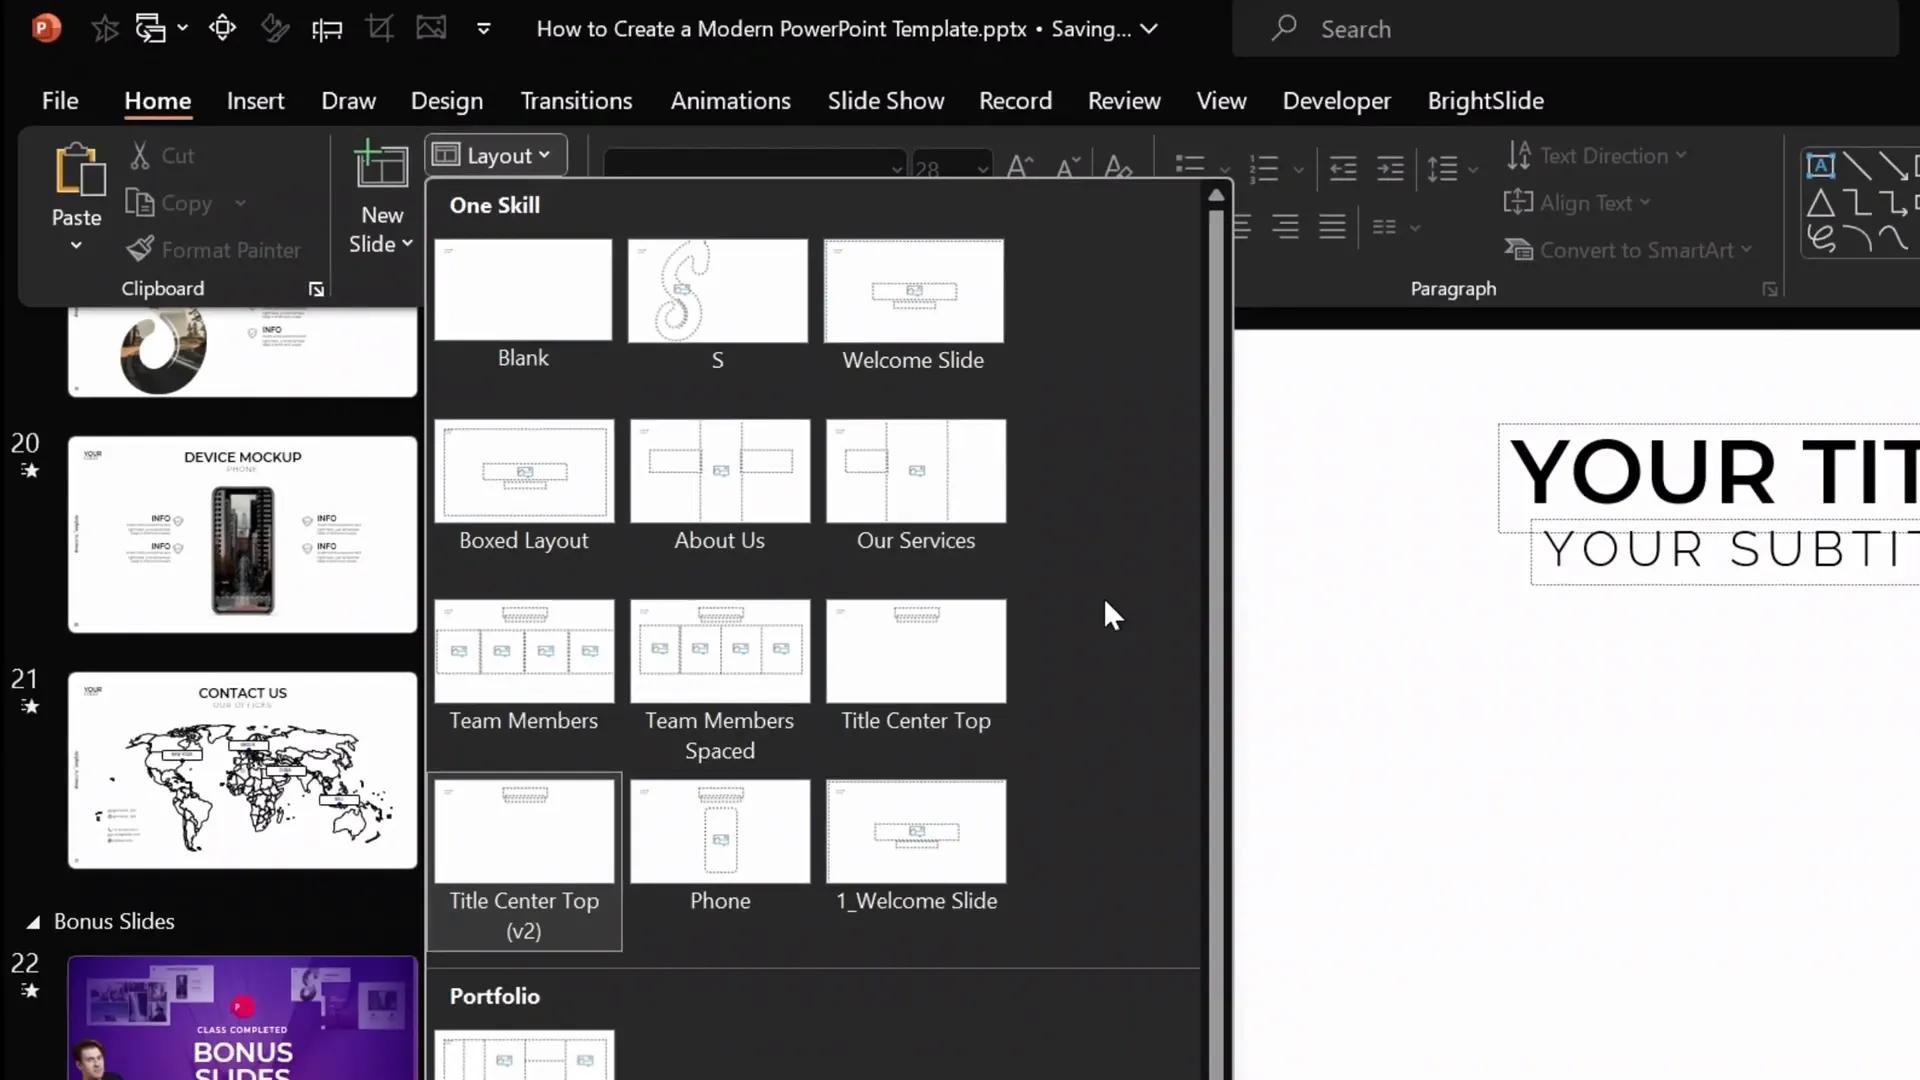
The first step in creating your animated infographic is to insert a new slide with a custom layout that supports the design elements you want to include. This tutorial assumes you have a slide master with modern layouts that include placeholders for titles, subtitles, logos, and custom slide numbering.
To insert a new slide:
- Navigate to the bottom of your slide list in PowerPoint.
- Press Enter to add a new slide.
- The slide will include placeholders for the title, subtitle, logo, and a custom slide number.
This custom slide layout is created using the Slide Master view in PowerPoint. If you’re interested in designing your own modern slide layouts, consider taking a free PowerPoint master class on Skillshare that covers professional template creation in detail.
Once the slide is inserted, fill in the title and subtitle placeholders with your desired text to set the context for your infographic.
Creating the Base White Shape with Shadow
The core visual element in the center of the slide is a white rectangle with a subtle shadow, which acts as the foundation for your infographic. Here’s how to create it:
- Turn on the grid and guides in PowerPoint for precise alignment. In this example, the grid consists of 18 columns and 8 rows.
- Insert a rectangle shape in the center of the slide, sized to span 2 columns in width and 6 rows in height.
- Fill the rectangle with a solid white color and remove any outline by setting the line to No Line.
- Add a shadow effect with the following settings:
- Shadow preset: Center
- Transparency: 20%
- Blur: 100 points
- Size: 70
This shadow creates a soft glow around the white rectangle, making it stand out subtly against the background without harsh edges.
If you want to learn how to create custom grids like this, the modern PowerPoint template class on Skillshare is a great resource.
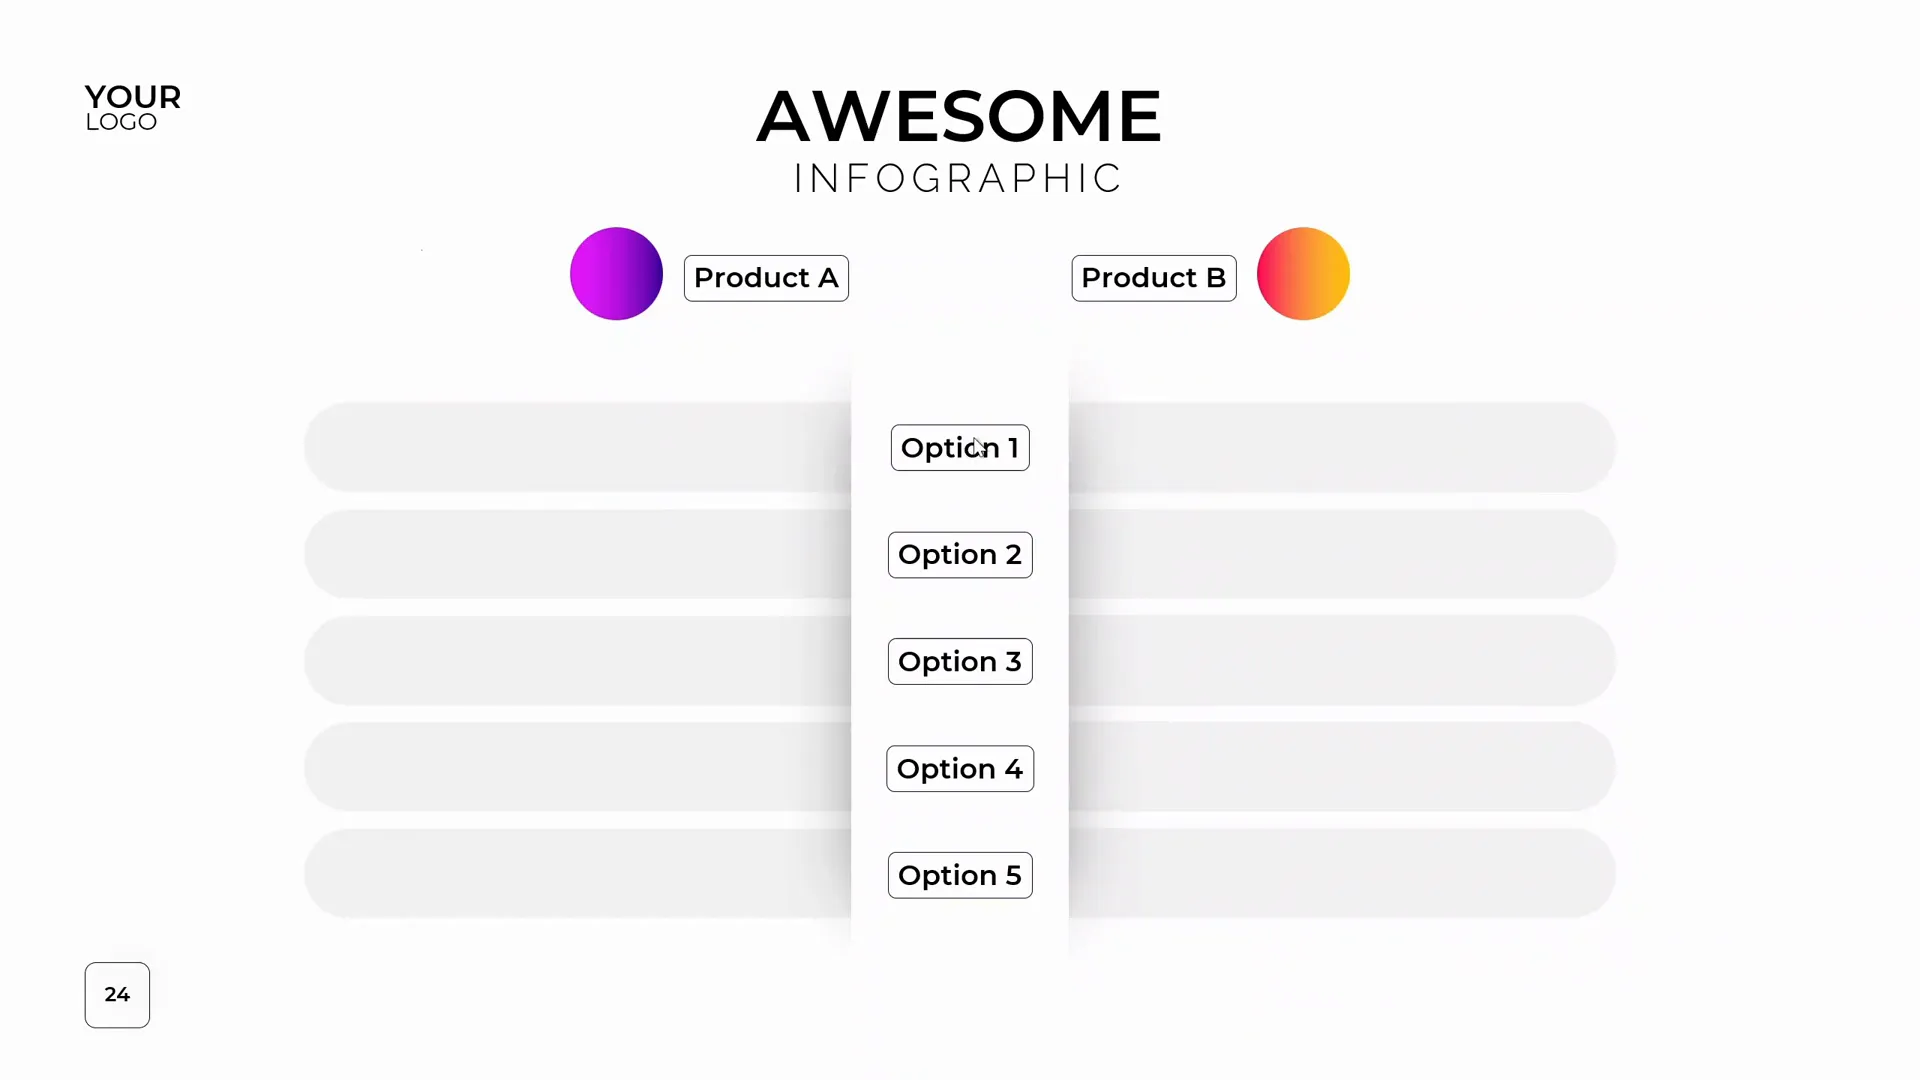
Designing Product Labels and Colorful Bubbles
Next, you’ll add product labels and colorful bubbles to enhance the infographic’s visual appeal and clearly identify the compared items.
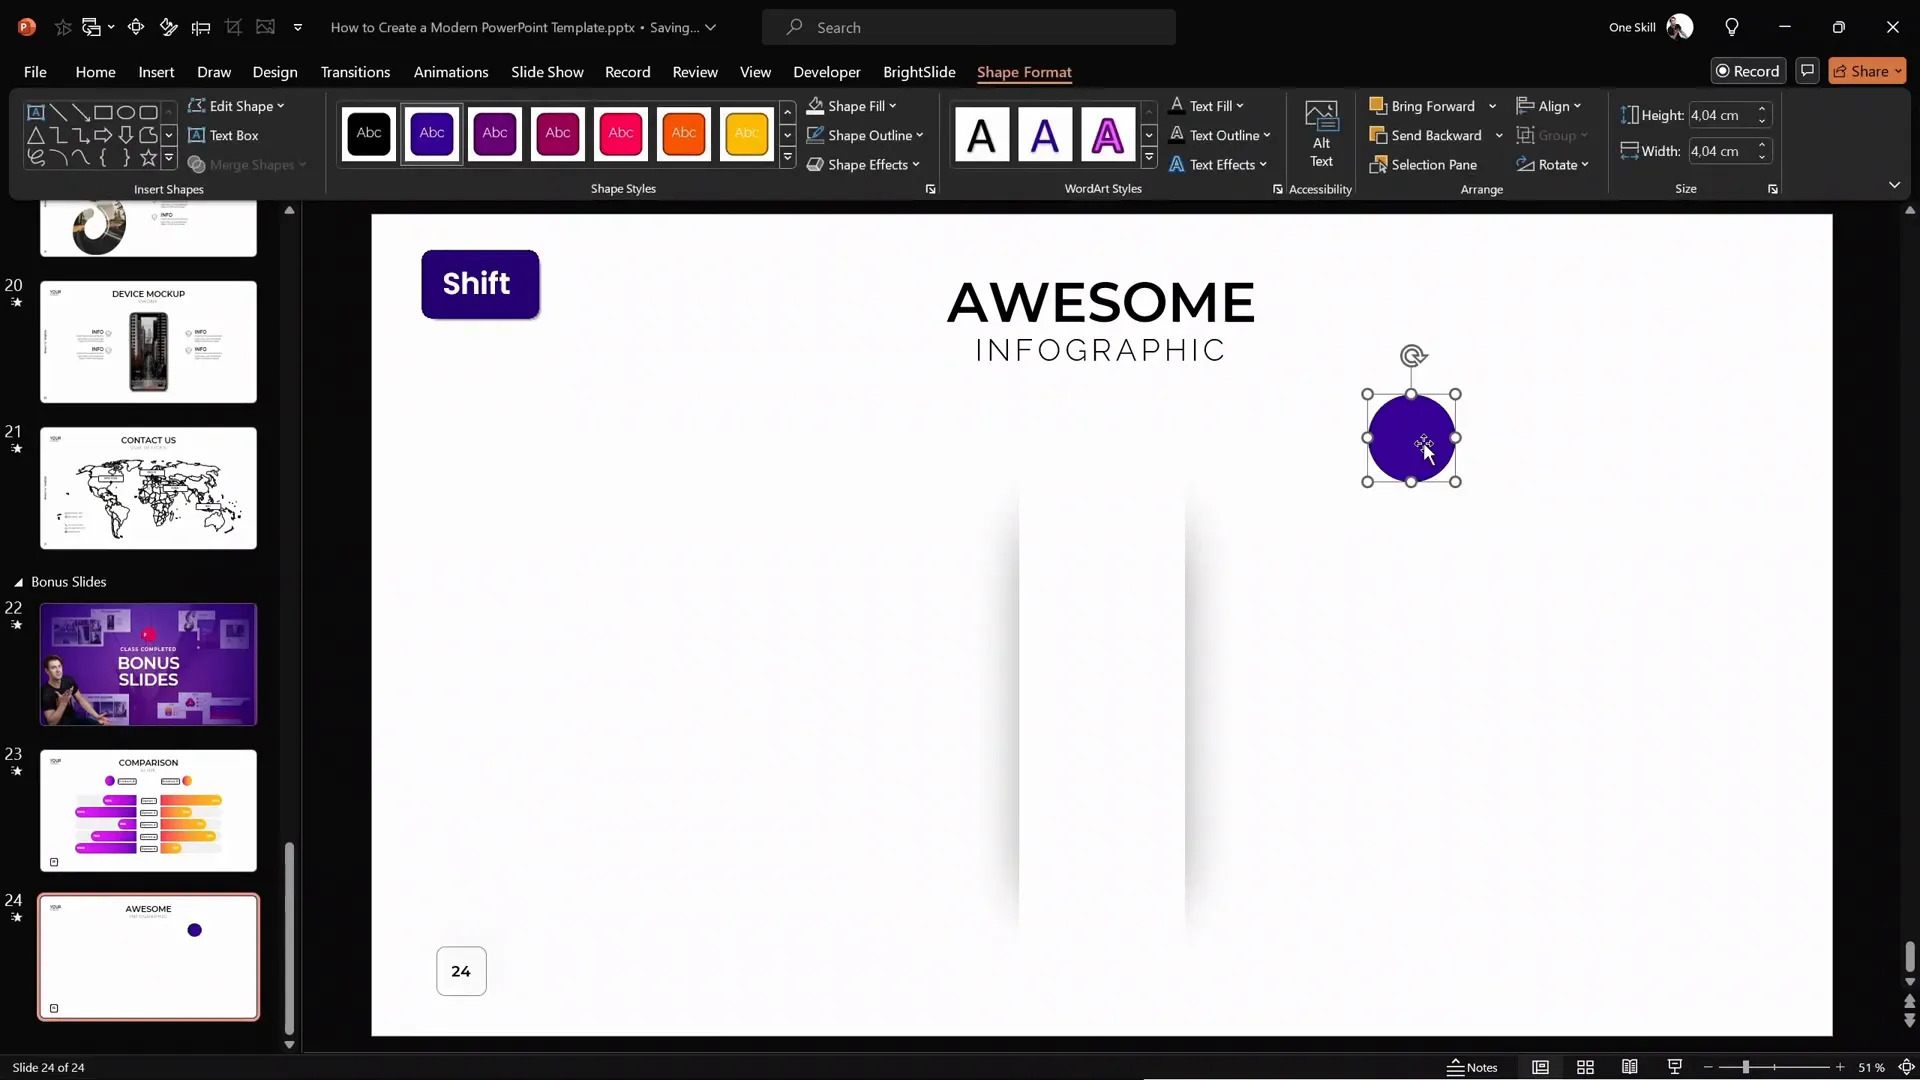
Creating the Bubbles
- Go to Insert > Shapes and select the Circle tool.
- Hold down the Shift key while drawing to create a perfect circle.
- Fill the circle with a vibrant gradient fill. You can use the Format Painter tool to copy a gradient style from an existing shape, saving time and keeping styles consistent.
Creating the Labels
- Insert a small rounded rectangle shape next to the bubble.
- Double-click inside the shape to type your label text.
- Use Format Painter or the shortcut
Ctrl + Shift + Cto copy the label’s style andCtrl + Shift + Vto paste it onto new labels. - Group the bubble and label together by selecting both and pressing
Ctrl + Gfor easier manipulation.
For efficiency, you can copy these grouped elements from a previous slide if you have already created them.
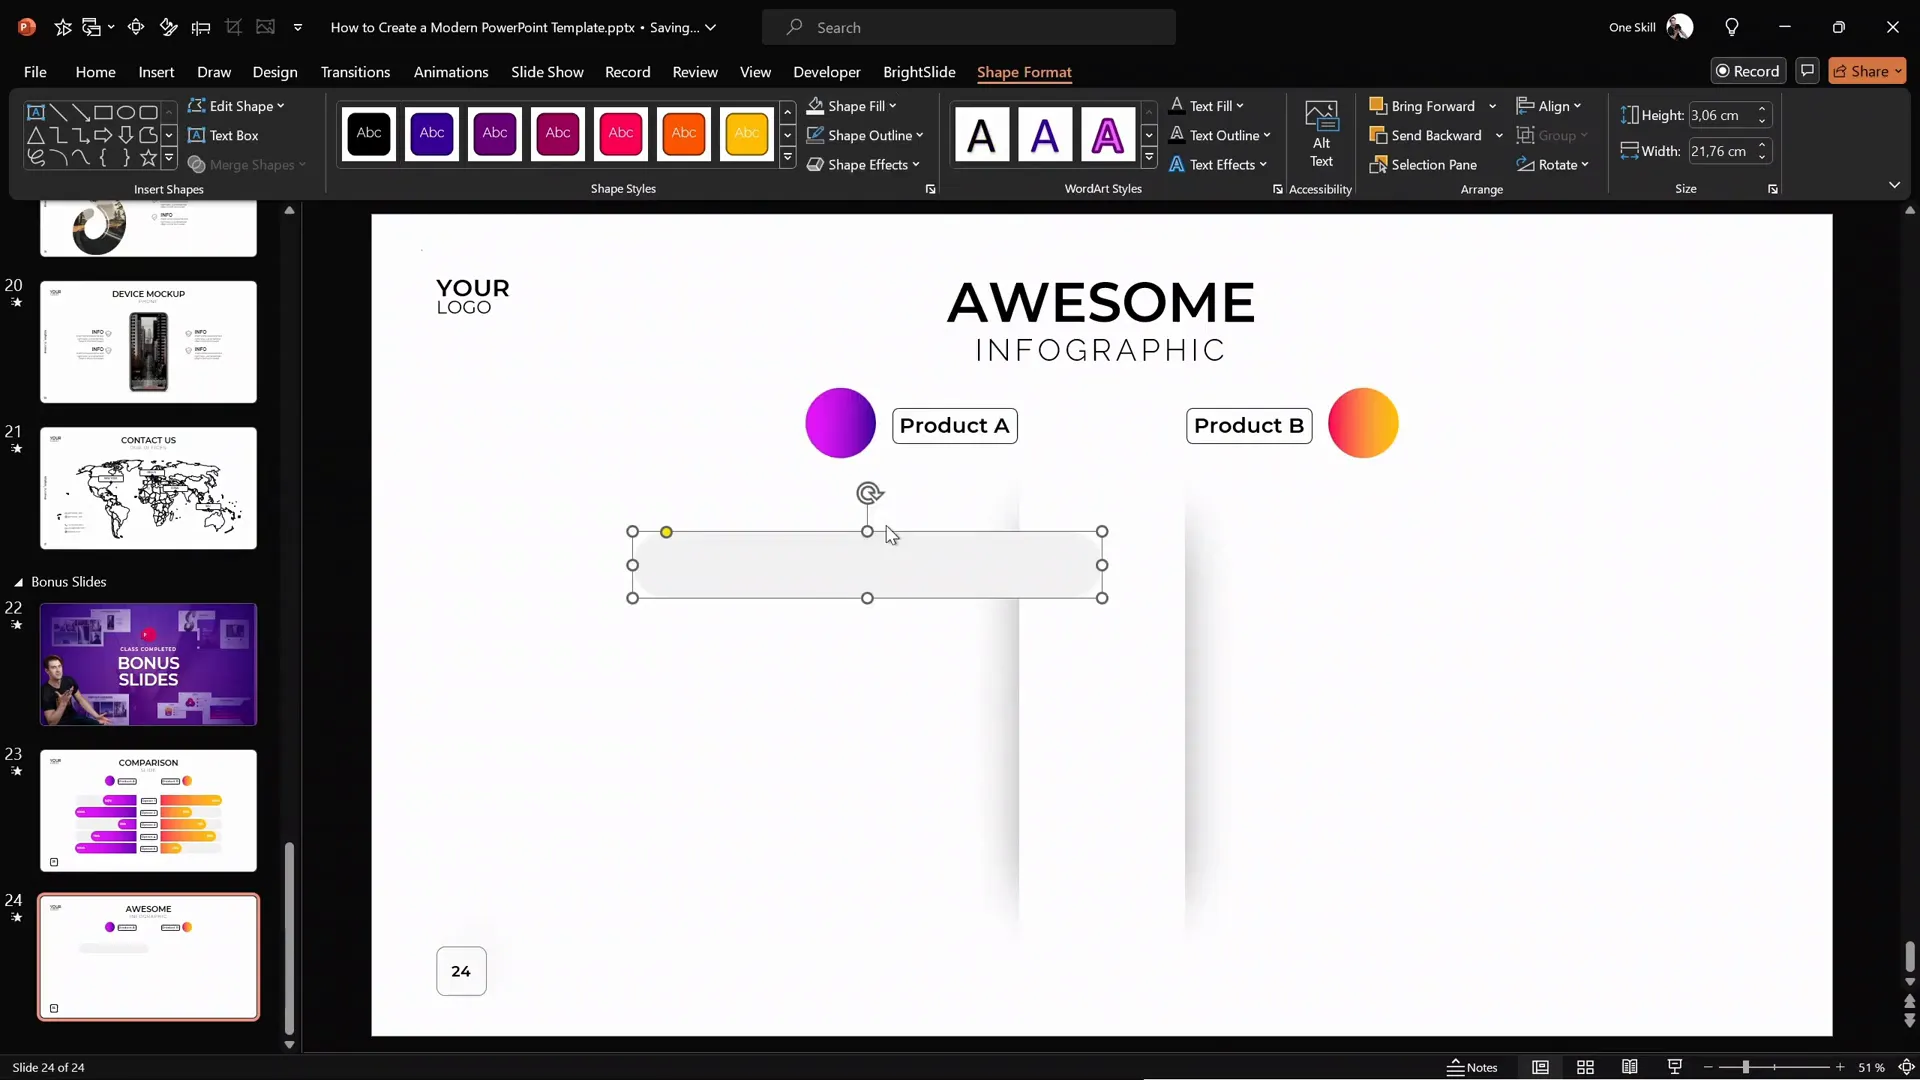
Adding Subtle Rounded Rectangle Background Elements
To add depth and structure to the infographic, insert subtle gray rounded rectangles in the background on both sides of the white shape.
- Insert a rounded rectangle shape.
- Use the yellow adjustment handle to make the corners fully rounded.
- Stretch the rectangle horizontally to your desired width.
- Remove the outline by setting No Line.
- Fill it with a light shade of gray.
- Send this shape to the back so the white rectangle remains on top.
- Hold Ctrl + Shift and drag the shape to create multiple copies aligned perfectly in a straight line.
- After finishing one side, select all gray shapes and duplicate them to the other side, ensuring symmetry.
- Bring the white rectangle to the front again to keep it visually dominant.
If you have the free BrightSlide PowerPoint add-in, you can quickly select all shapes with the same fill color by using the Select Object > Fill Color feature, which speeds up this process.
For consistency, you can copy these rounded rectangles from a previous slide where you have the design finalized.
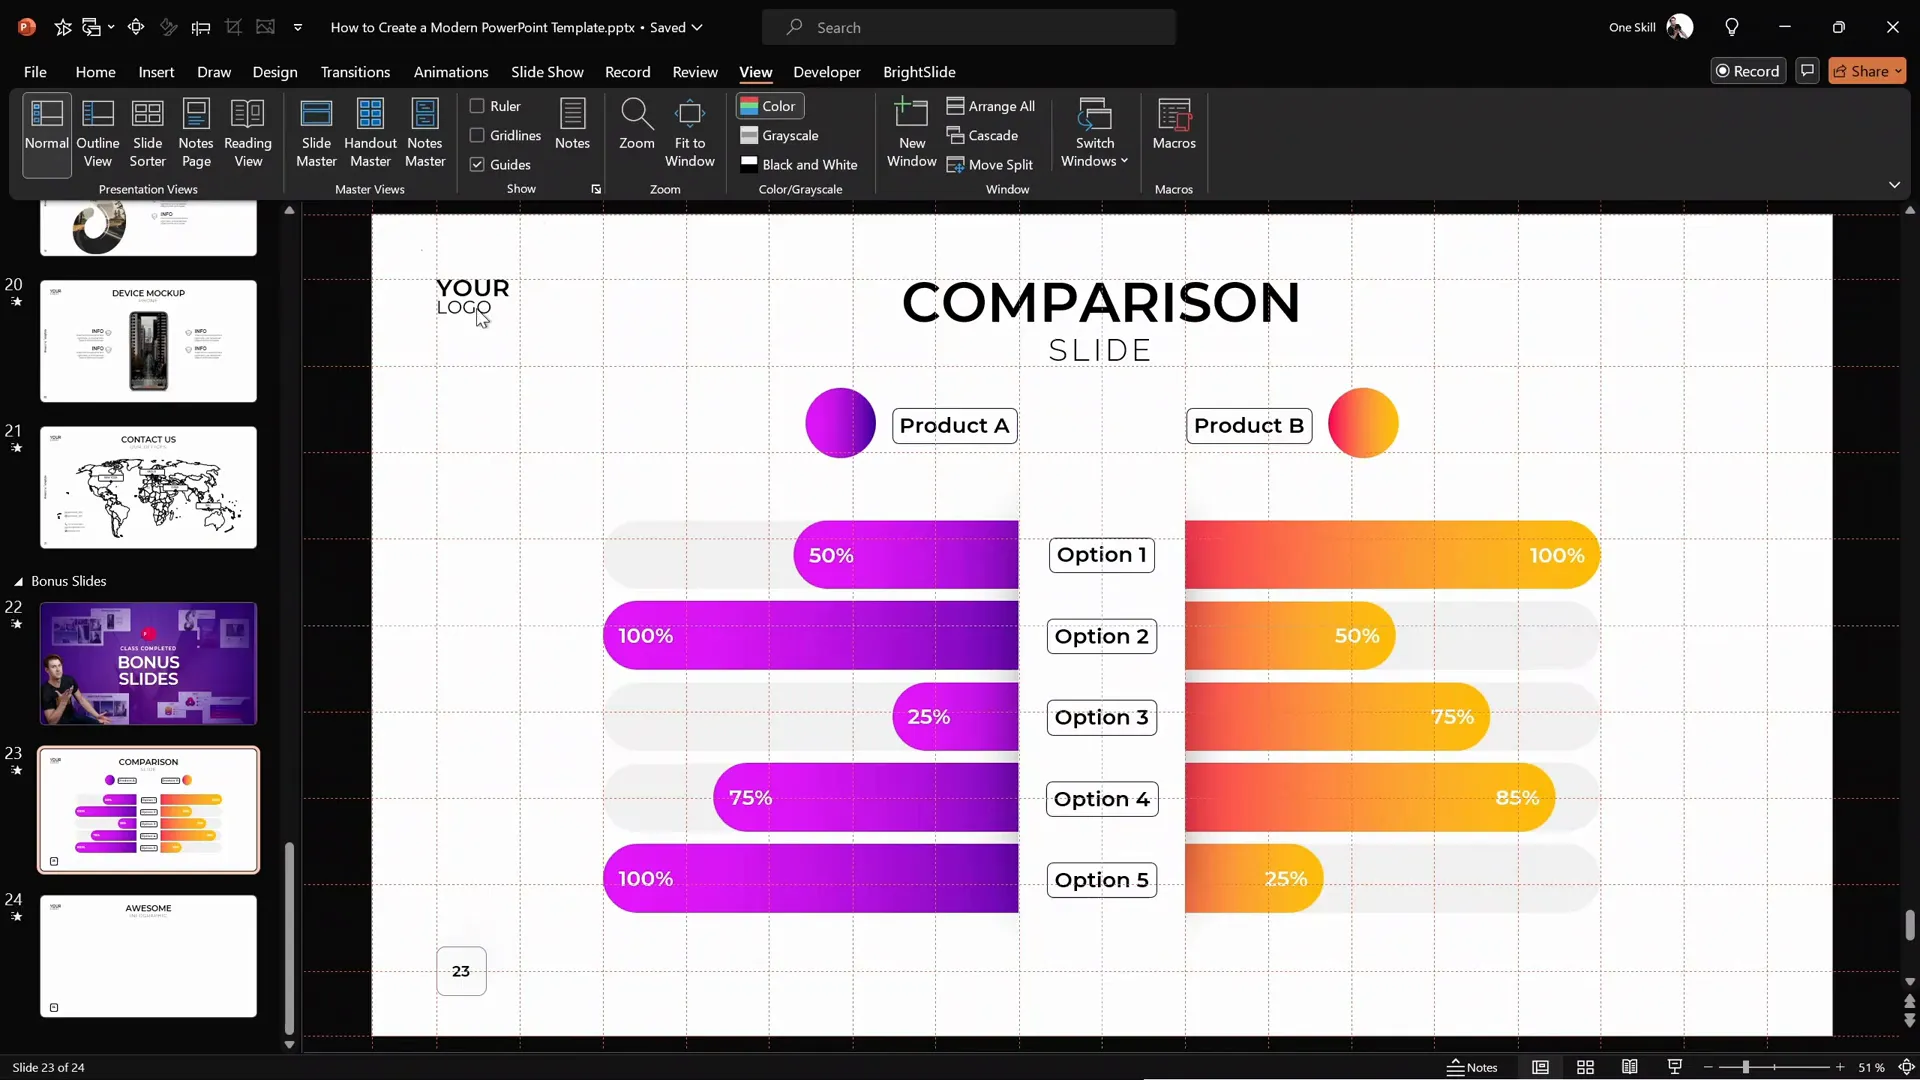
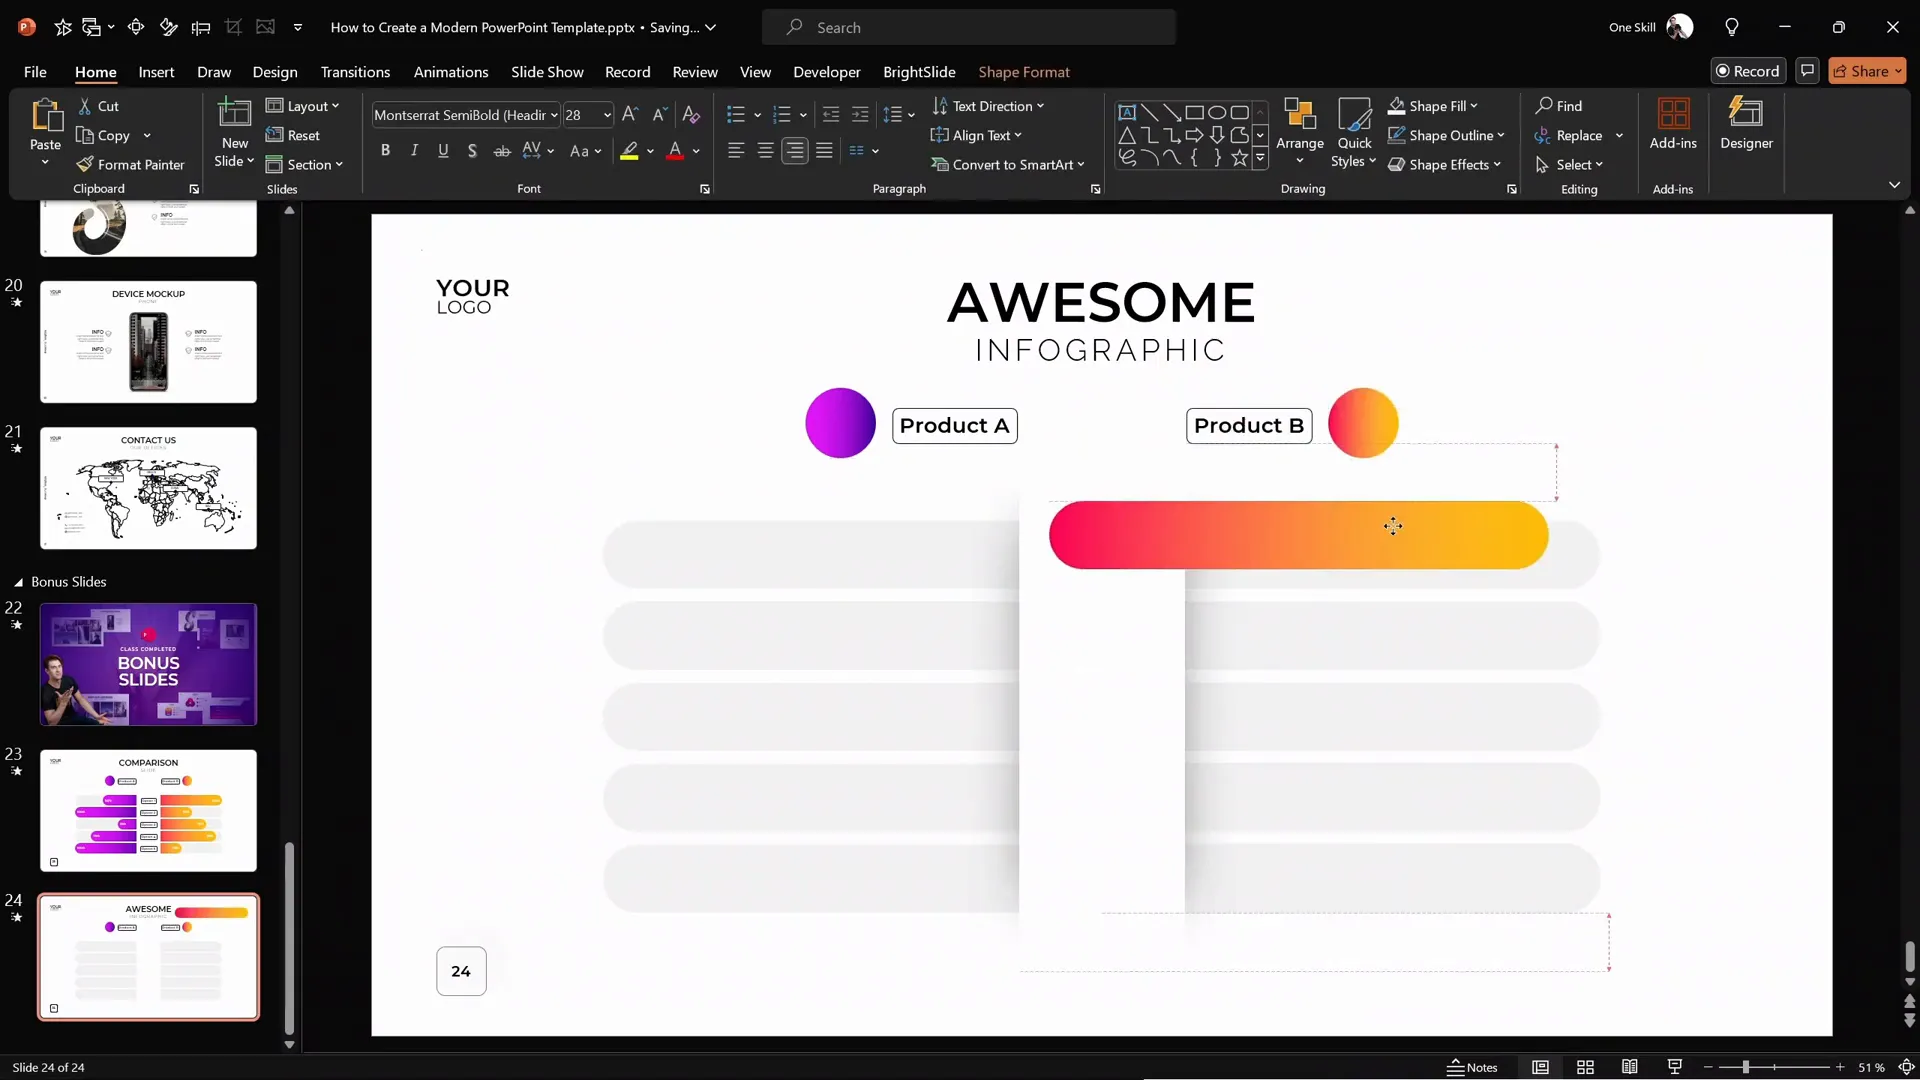
Creating Animated Sliding Bars
The heart of the animated infographic is the sliding colored bars that extend from behind the white shape, dynamically illustrating comparative values like percentages. Here’s how to create these bars:
- Duplicate one of the gray rounded rectangles and fill it with a vibrant gradient color (e.g., orange or purple).
- Align the colored rectangle precisely over the gray background rectangle using the Align tools or BrightSlide productivity shortcuts (hold
Ctrland use arrow keys for pixel-perfect movements). - Adjust the length of the colored rectangle to represent the value you want to display (e.g., 75% width). Double-click inside the shape and type the percentage.
- Ensure the white rectangle with the shadow remains on top to mask the left edge of the colored bar.
Animation Techniques and Fine-tuning
Animating the sliding bars to create a smooth, professional effect involves combining two animations: a motion path and a wipe effect. This combination creates a masked slide-out effect that looks polished and modern.
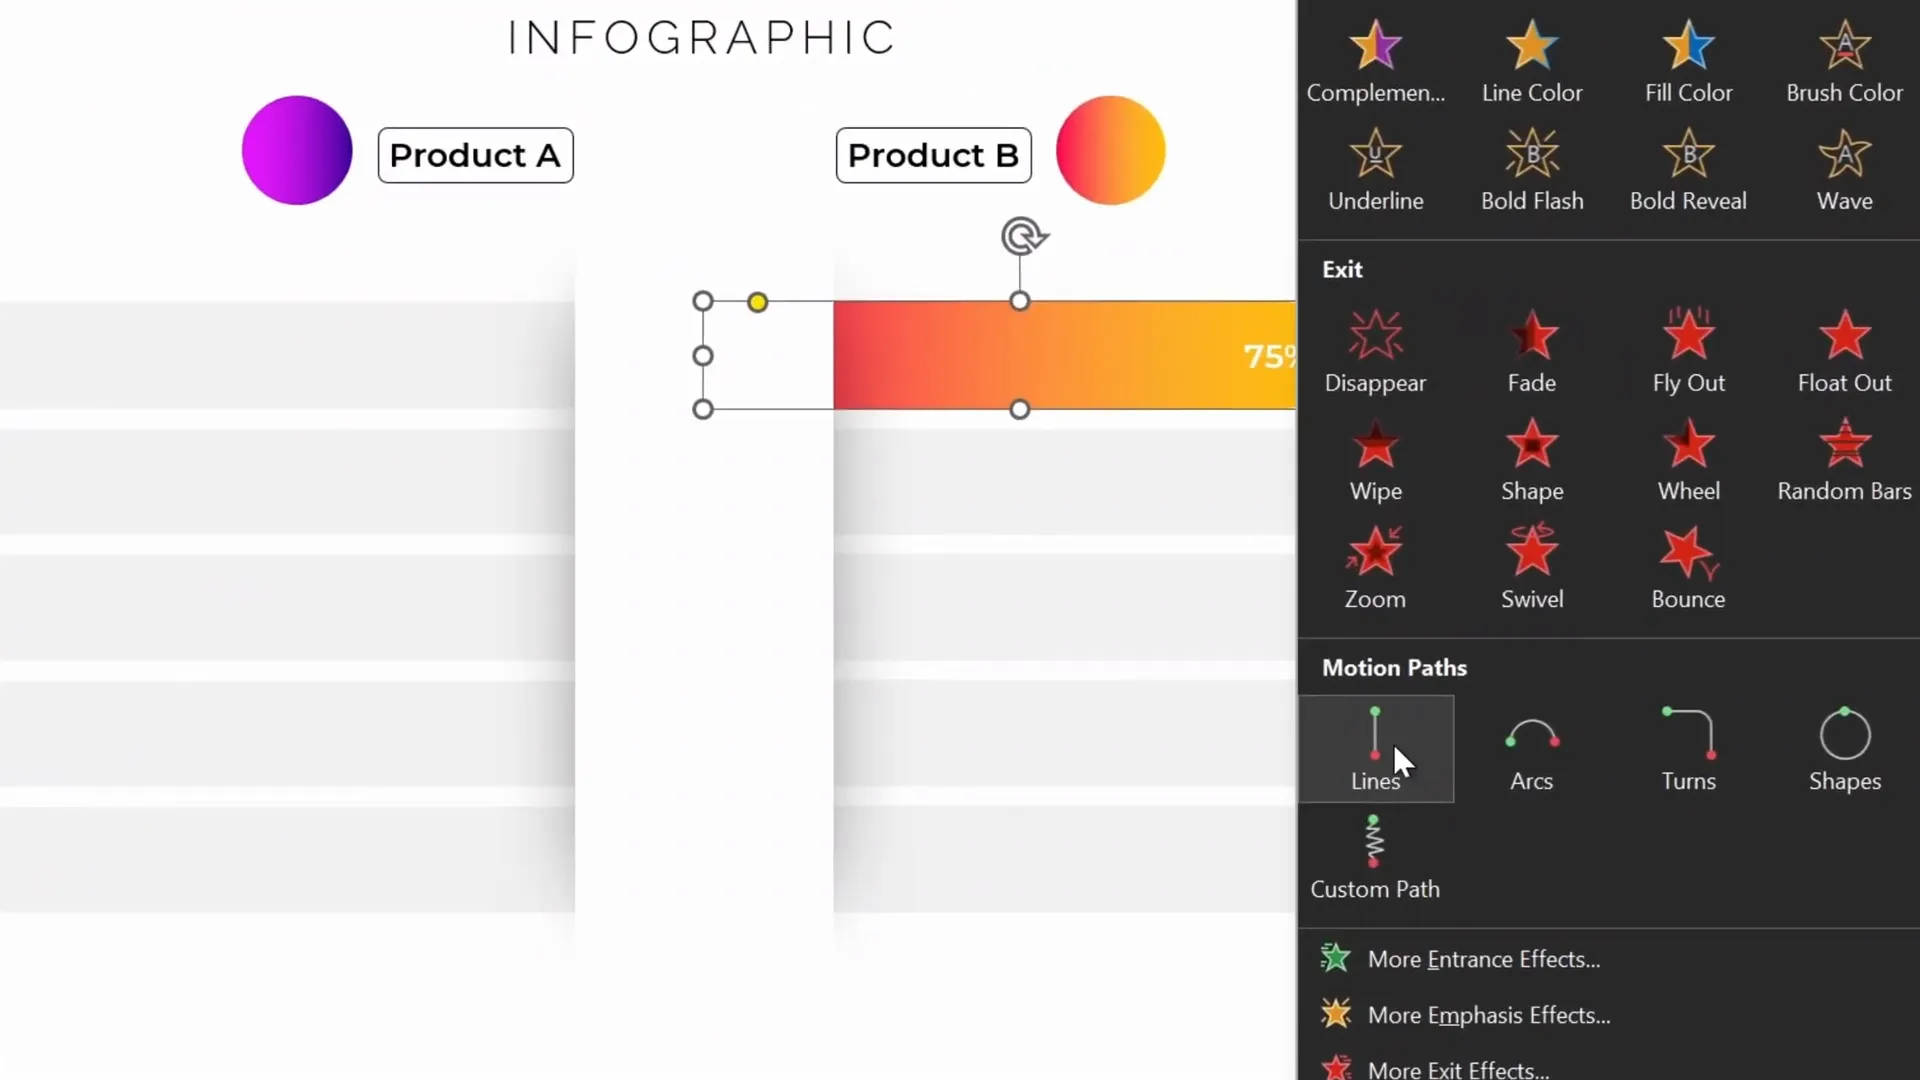
Step 1: Apply a Motion Path Animation
- Select the colored rounded rectangle.
- Go to Add Animation and choose the Motion Path: Line animation.
- Adjust the direction of the motion path to slide outward from the white shape. If the default direction is incorrect, select Reverse Path Direction.
- Set the animation duration to 1 second for smooth movement.
- Double-click the motion path animation in the Animation Pane and select Play Maximum’s Movement for a softer landing effect.
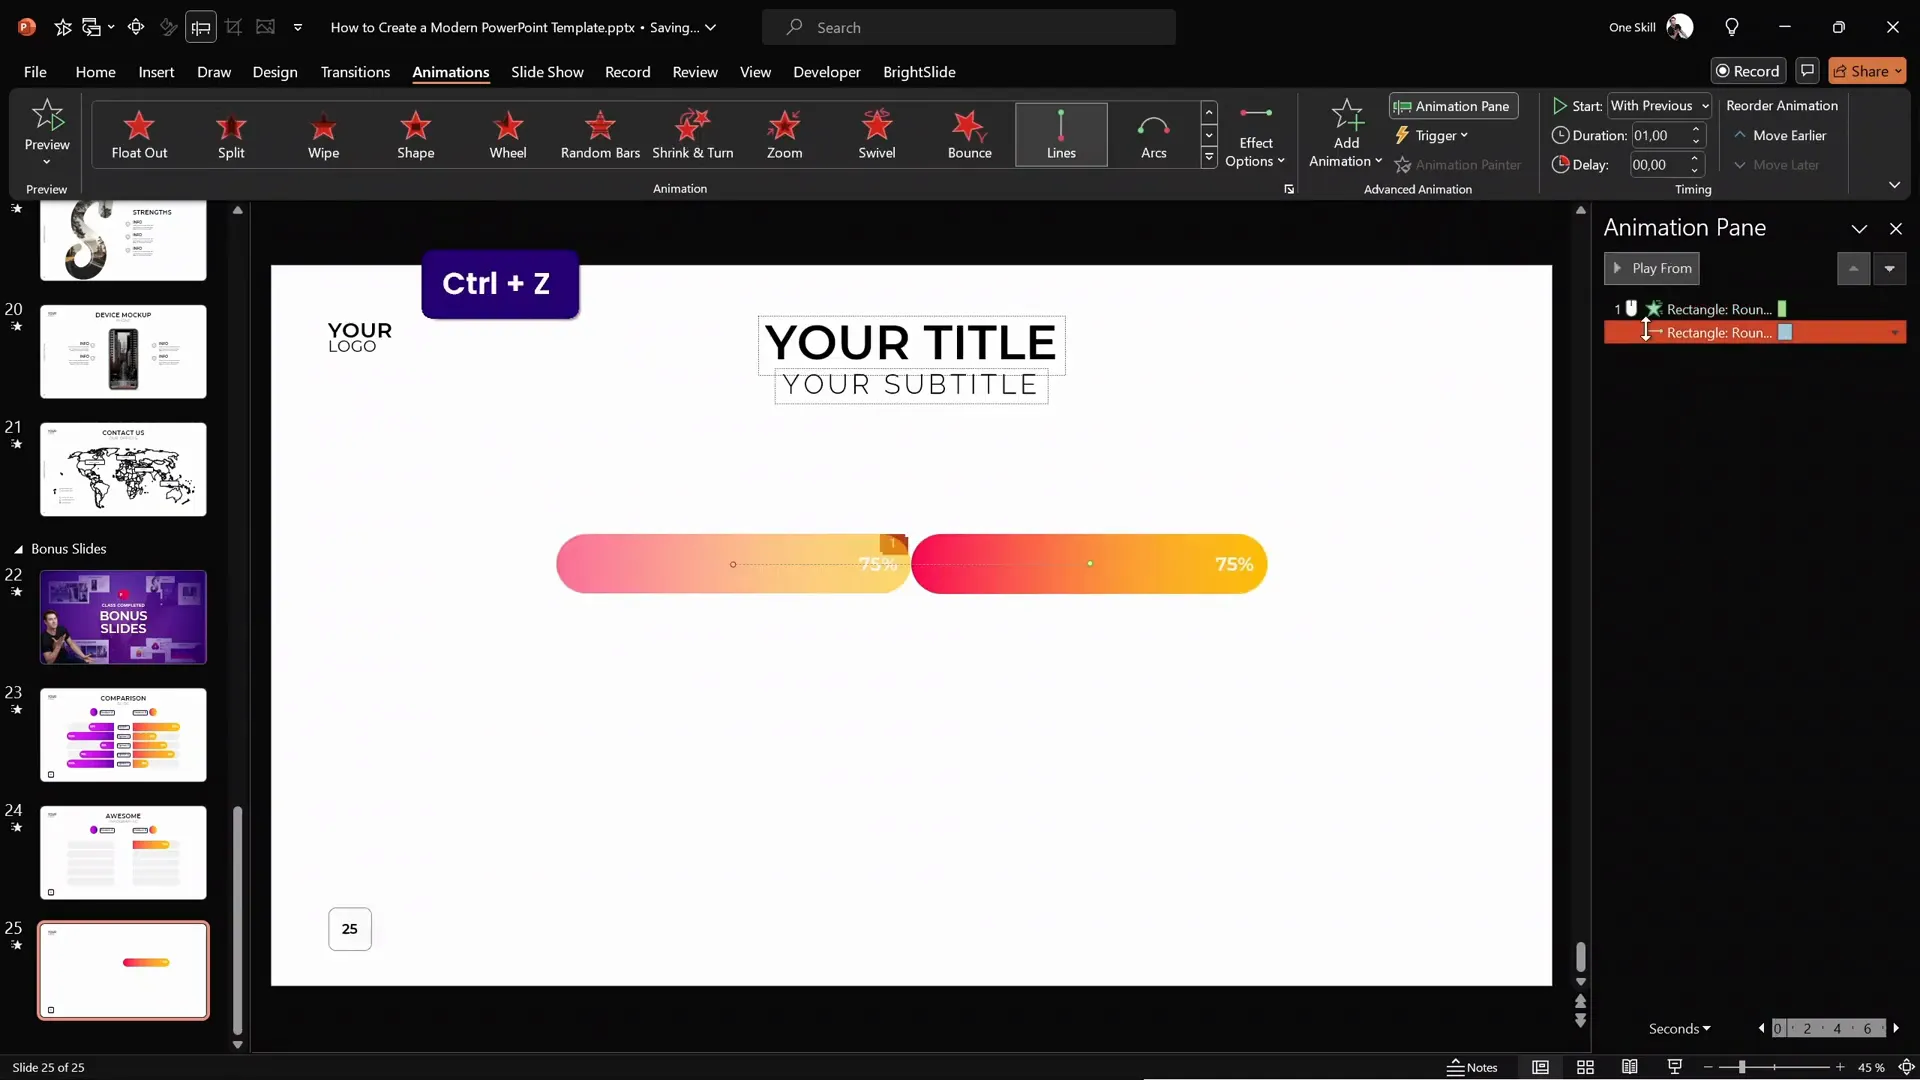
Step 2: Add a Wipe Entrance Animation
- With the shape still selected, add a Wipe entrance animation.
- Set the direction of the wipe to be from the right (or left for the opposite side bar).
- Adjust the wipe animation duration to 0.6 seconds.
- In the Animation Pane, set the wipe animation to start With Previous along with the motion path animation.
Combining these two animations creates a moving mask effect, where the bar appears to grow out from behind the white shape cleanly, hiding any unwanted edges.
Understanding the Animation Interaction
To better understand how the animations work together:
- The motion path moves the colored bar outward horizontally.
- The wipe animation acts as a mask that reveals the bar from one side, hiding the starting edge.
This combination makes the sliding bar animation appear seamless and professional.
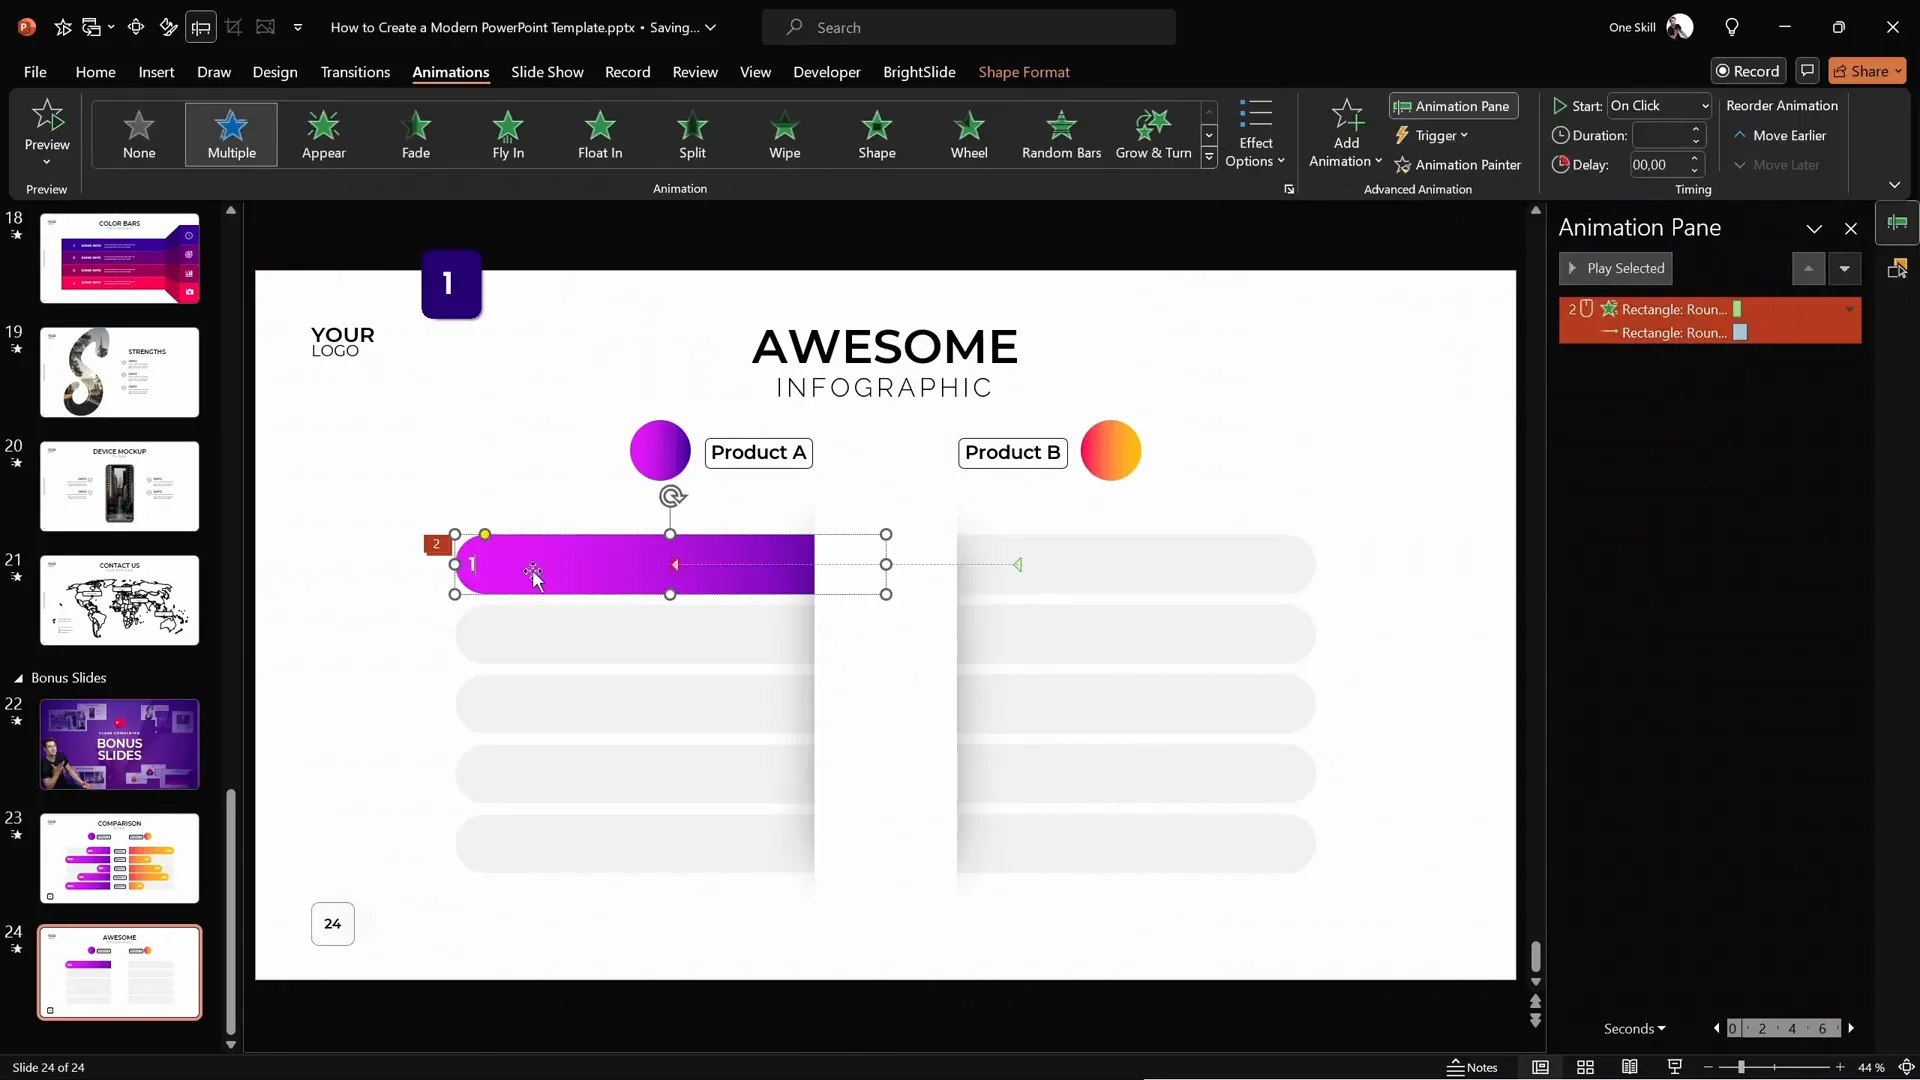
Duplicating and Animating the Opposite Side
- Duplicate the colored sliding bar to create the counterpart on the opposite side of the white shape.
- Align it with the corresponding gray background bar.
- Apply the same animations, but reverse the direction:
- Motion path slides the bar to the right.
- Wipe animation reveals the bar from the left.
- Adjust the bar length and text as needed (e.g., 100%).
- Use the Selection Pane to name the bars (e.g., Right One and Left One) for easier animation management.
Finalizing the Animated Infographic
To make the infographic more interactive and visually informative:
- Set the animations for the left and right sliding bars to start simultaneously by setting the wipe animation on the left bar to start With Previous.
- Add product labels and bubbles without animations to keep the focus on the sliding bars.
- Duplicate and create as many animated sliding bars as your infographic requires (in the example, there are five options).
Once complete, preview your slide full screen to ensure all animations play smoothly and simultaneously on a single mouse click.
Frequently Asked Questions (FAQ)
What is PowerPoint Design Animation and why should I use it?
PowerPoint Design Animation refers to the use of animation effects to enhance the visual appeal and clarity of PowerPoint slides. Using animations like motion paths and wipes can help engage your audience, illustrate concepts dynamically, and make data comparisons more intuitive.
Can I create these animations without third-party add-ins?
Yes, all the animations demonstrated in this tutorial can be created using native PowerPoint features. However, add-ins like BrightSlide can speed up your workflow by providing helpful shortcuts for alignment and selection.
How do I keep my animations smooth and professional-looking?
Use subtle animation durations (around 0.6 to 1 second), combine animations thoughtfully (like a wipe with a motion path), and avoid overly flashy or distracting effects. Consistency in style and timing is key.
What if I want to compare more than two products or services?
You can create as many animated sliding bars as needed by duplicating the existing shapes and animations, adjusting their positions and values accordingly. Just maintain consistent design and animation timing for a cohesive look.
Can I use this technique for other types of infographics?
Absolutely! This approach works well for any infographic that benefits from comparative bars or dynamic visualizations, such as survey results, performance metrics, or feature comparisons.
Conclusion
Congratulations! You now have the knowledge and skills to create a stunning animated infographic in PowerPoint using PowerPoint Design Animation techniques. By combining clean, modern slide layouts with thoughtful animation, you can present comparisons and data in an engaging and visually appealing way.
Remember, the key steps include setting up a custom slide layout, creating a central white shape with subtle shadowing, designing colorful labels and bubbles, adding background elements for depth, and applying motion path and wipe animations to sliding bars for dynamic effects.
For further learning, consider exploring PowerPoint master classes on platforms like Skillshare, which offer in-depth tutorials on slide design and animation mastery.
Thank you for reading, and happy PowerPoint designing!


