
PowerPoint is an incredibly versatile tool that goes beyond just basic slide creation. Mastering key PowerPoint functions like creating dynamic pie charts can elevate your presentations, making data visualization both engaging and professional. In this comprehensive guide, you’ll learn how to create beautiful, 3D-looking pie charts in PowerPoint, complete with shadow effects, custom colors, and animations—all without leaving the PowerPoint environment.
This tutorial covers everything from setting up your slide background to applying advanced 3D formatting and animations, ensuring you can create pie charts that impress your audience and effectively communicate your data insights.
Table of Contents
- Getting Started: Setting Up Your Slide
- Creating the Base Pie Chart with 3D Effects
- Adding Depth and Shadow Effects
- Customizing Colors and Gradients for Visual Appeal
- Duplicating and Scaling Pie Charts for Multiple Data Sets
- Adding Text Labels and Percentages
- Enhancing Your Chart with Headlines and Connectors
- Animating Your Pie Charts for Impact
- Frequently Asked Questions (FAQ)
- Conclusion
Getting Started: Setting Up Your Slide
Before diving into creating pie charts, it’s crucial to prepare your PowerPoint slide properly. This foundation sets the tone for your entire design and helps you align your pie charts perfectly.
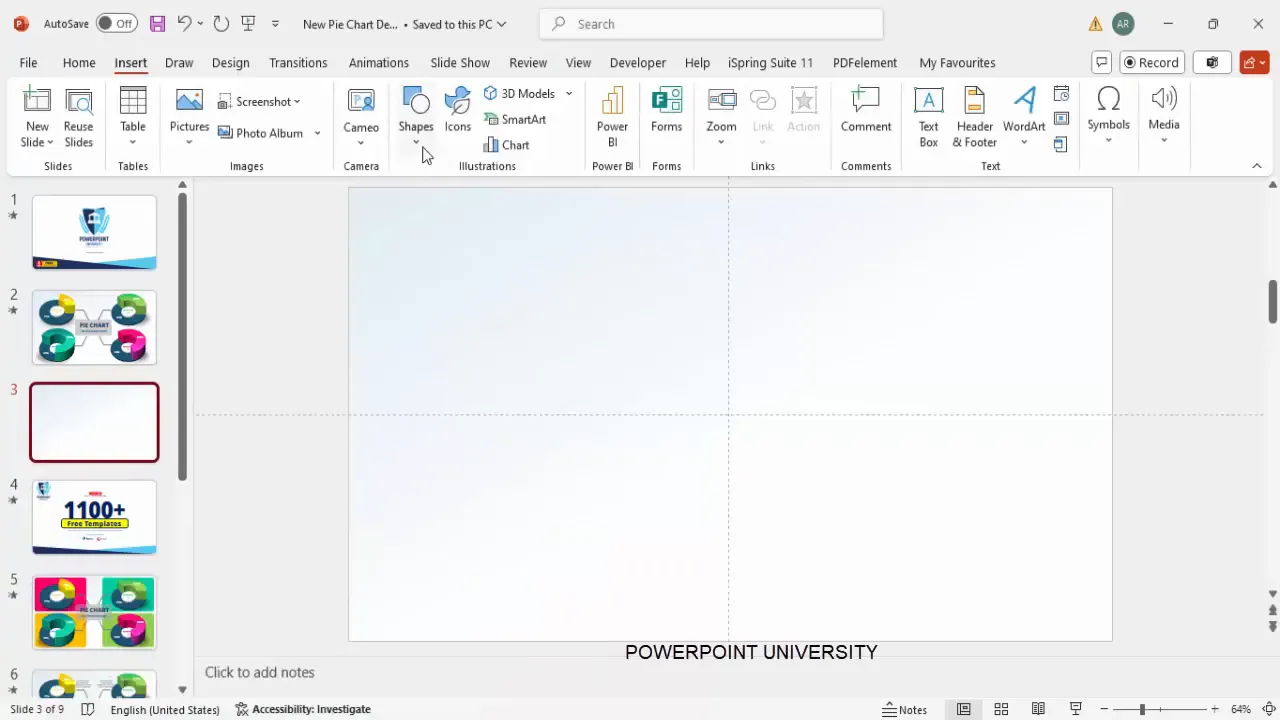
Step 1: Add a New Slide
Start by adding a new slide to your presentation. You can do this by clicking on the Home tab and selecting New Slide. Choose a blank layout or one that suits your content needs.
Step 2: Set a Gradient Fill Background
To make your pie charts pop, change the slide background to a gradient fill. Here’s how:
- Right-click on the slide background and select Format Background.
- Choose Gradient Fill and customize the gradient stops, colors, and direction.
- Pick colors that complement your pie chart color scheme for a harmonious look.
Step 3: Enable Guides for Precise Alignment
Go to the View tab and enable Guides. This feature helps you align your shapes and text perfectly in the center or at other key points on the slide.
Creating the Base Pie Chart with 3D Effects
Now that your slide is ready, let’s create the base shape of the pie chart using PowerPoint’s basic shapes and 3D formatting.
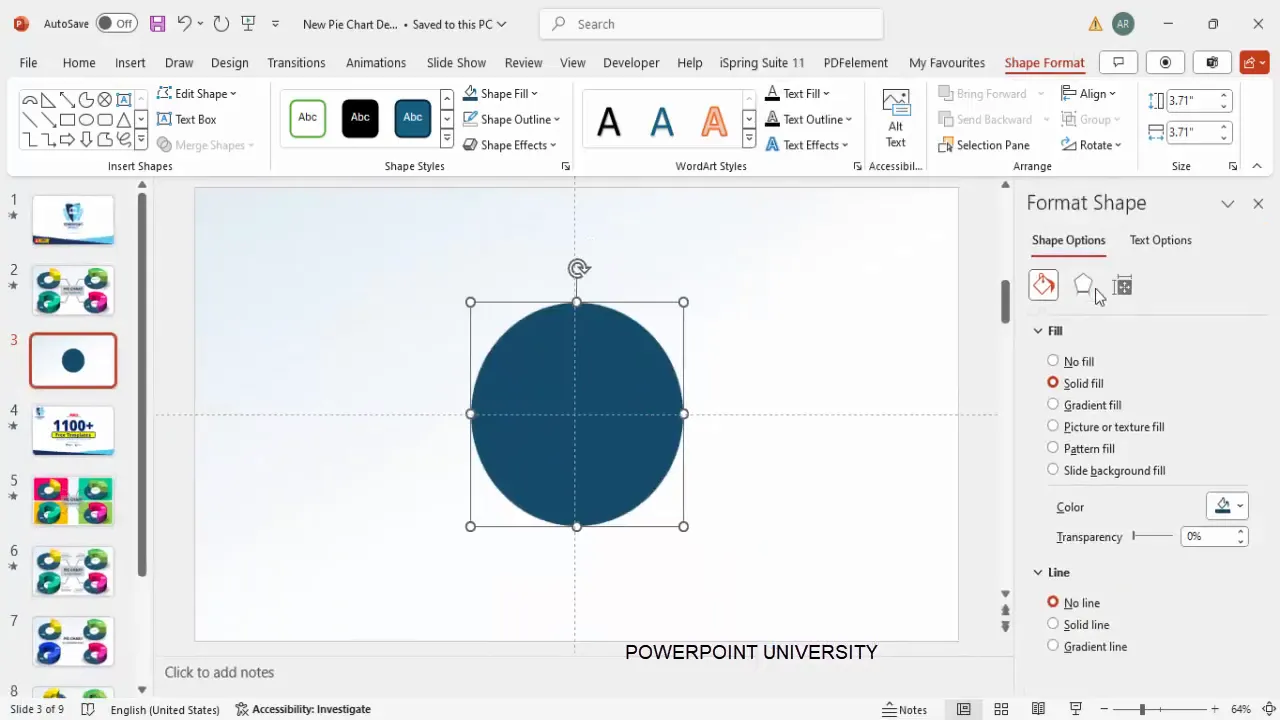
Step 1: Insert an Oval Shape
Go to Insert > Shapes > Basic Shapes and select the Oval shape. Draw a small oval that will serve as the base of your pie chart.
Step 2: Remove Shape Outline and Center Align
Remove the shape outline by selecting No Outline in the Shape Outline menu. Then, use the Align tools to center the shape both horizontally and vertically on the slide.
Step 3: Apply a Dark Fill Color
Fill the oval with a dark color for contrast. For example, use a dark blue fill to make the pie chart visually appealing.
Step 4: Add 3D Rotation
Right-click the oval and select Format Shape. Under Effects, navigate to 3D Rotation and choose the Perspective Relaxed preset. This gives the oval a subtle 3D perspective.
Step 5: Add Depth
Still under 3D Format, increase the depth to around 11-12 points. This adds thickness to your pie chart base, enhancing the 3D effect.
Adding Depth and Shadow Effects
Depth and shadows bring realism and polish to your pie charts. Here’s how to add these finishing touches:
Step 1: Duplicate the Base Oval and Create a White Center
Duplicate the dark oval by selecting it and pressing Ctrl + D. Change the duplicate’s fill color to white and reduce its size while holding the Shift key to maintain proportions. Center this smaller oval exactly on top of the original to create a “donut” effect.
Step 2: Create the Pie Slice Shape
Insert a Block Arc shape from Insert > Shapes > Basic Shapes. Adjust its size to match the diameter of the oval (around 3.71 inches in width and height for consistency).
Step 3: Apply 3D Rotation to the Slice
Use the Format Painter to copy the 3D rotation effect from the base oval to the slice shape. This keeps the 3D perspective consistent across your chart components.
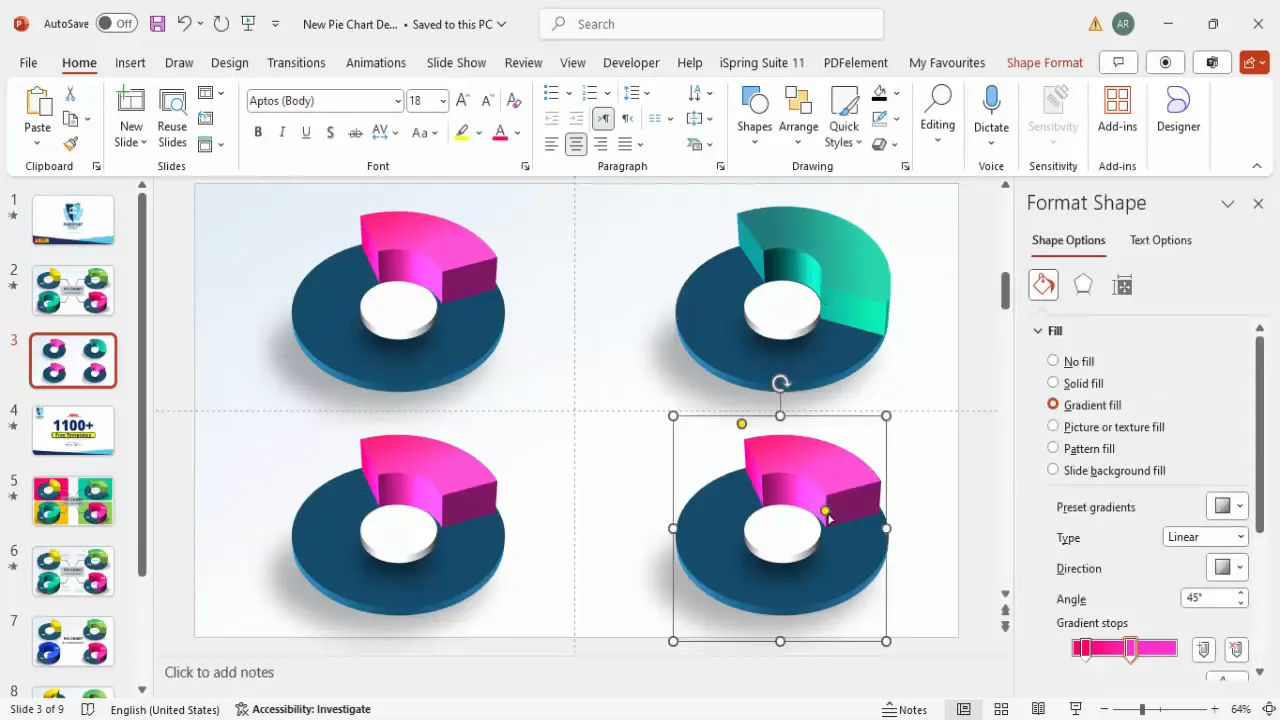
Step 4: Add Gradient Fill to the Slice
Fill the slice with a gradient of two colors. For example, use light pink and dark pink stops to create a smooth color transition.
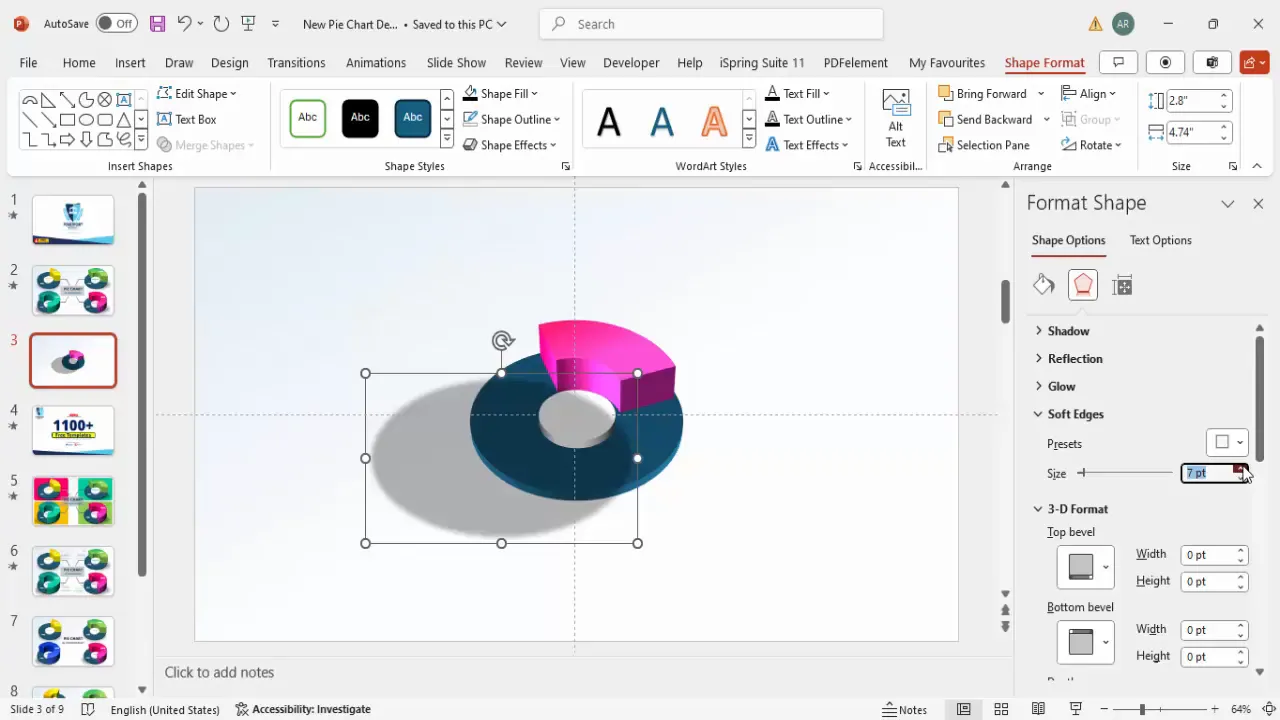
Step 5: Adjust Slice Size and Depth
Place the slice exactly on top of the base oval and adjust its width from both ends as needed to represent your data slice. Increase the slice’s depth under 3D Format effects to around 50 points for a pronounced 3D look.
Step 6: Add Shadow Effects
- Insert an oval shape for the shadow under the pie chart, fill it with black, and set transparency to 70%.
- Apply a soft edge effect to blur the shadow edges.
- Send the shadow object to the back to keep it beneath the pie chart.
- Repeat a smaller shadow effect for the white center oval to add dimension.
Customizing Colors and Gradients for Visual Appeal
Colors are essential for making your pie charts vibrant and easy to interpret. PowerPoint’s gradient options allow you to create beautiful color blends.
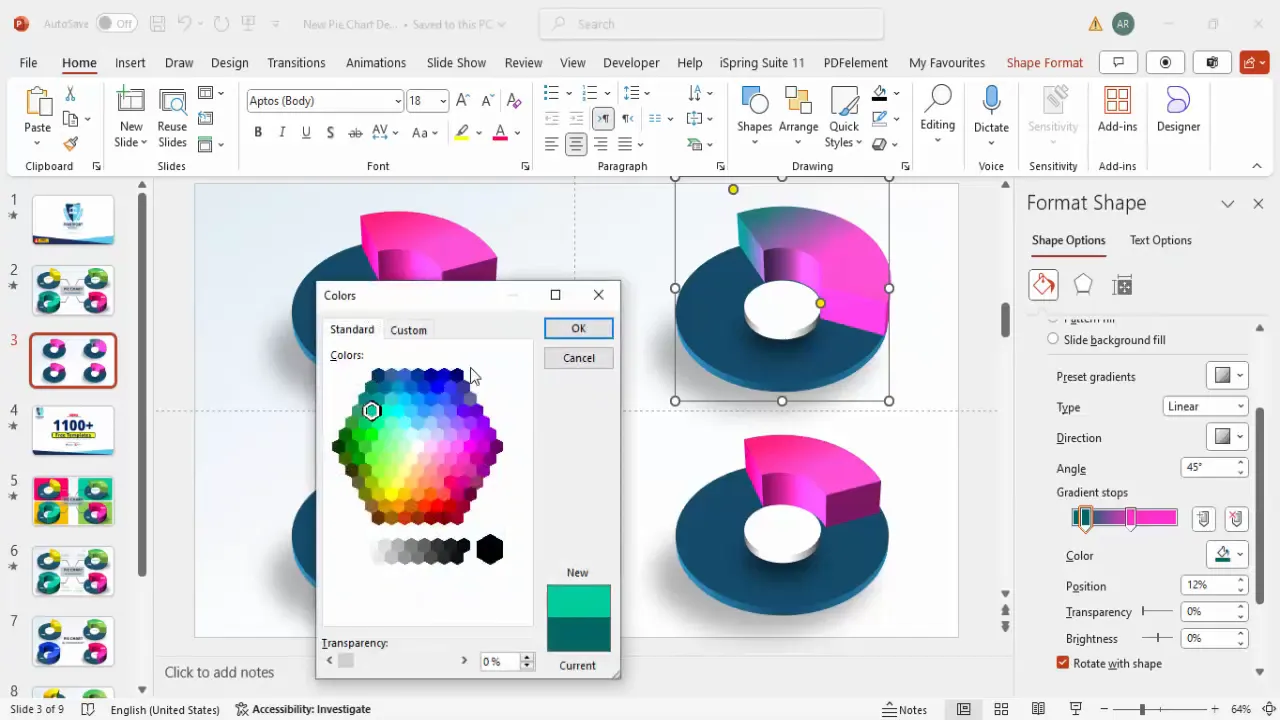
How to Customize Colors
- Use the Gradient Fill option in the Format Shape pane.
- Choose two contrasting colors that represent your data categories.
- Adjust gradient stops to control the color transition direction and intensity.
- For darker or lighter shades, use the More Colors option or adjust lighting and material effects under 3D Format.
Color Combinations Examples
| Combination | Light Color | Dark Color |
|---|---|---|
| Pink Gradient | Light Pink | Dark Pink |
| Green Gradient | Light Green | Dark Green |
| Orange Gradient | Light Orange | Dark Orange |
| Blue Gradient | Light Blue | Dark Blue |
Feel free to experiment with different gradient directions to suit your design needs.
Duplicating and Scaling Pie Charts for Multiple Data Sets
If you want to showcase multiple products or data categories, duplicating your pie chart design is a huge time saver.

Step 1: Select All Chart Components
Press Ctrl + A to select all objects that make up your pie chart (base oval, white center, slice, shadows).
Step 2: Move and Duplicate
- Move the entire group aside to create space for additional charts.
- Hold Ctrl + Shift and drag to the right to duplicate the whole chart.
- Repeat this process to create as many pie charts as needed.
Step 3: Resize Charts
Use the small orange handles on the bounding box to adjust the size of individual pie charts as needed. Ensure all charts remain aligned for a clean layout.
Step 4: Change Colors for Differentiation
Change the gradient colors of slices in the duplicated charts to represent different data categories or products. Use the color combinations table above for inspiration.
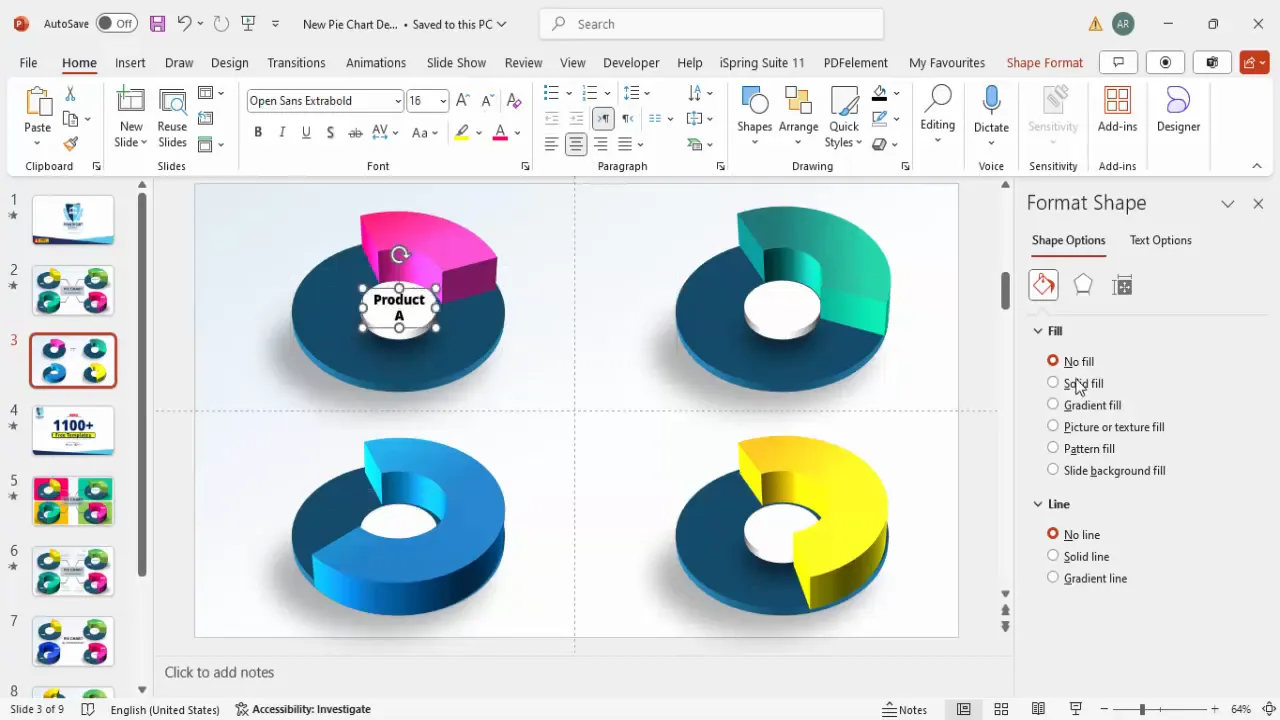
Adding Text Labels and Percentages
Labels and percentages help clarify what each pie chart and slice represent.
Step 1: Insert Text Boxes
- Go to Insert > Text Box and click on the slide to add a text box.
- Type the product or category name (e.g., Product A).
- Format the text using a clean, readable font like Open Sans Extra Bold and center-align it.
- Adjust the font size to fit nicely above or below the pie chart.
Step 2: Apply 3D Rotation to Text
For consistency, apply the same Perspective Relaxed 3D rotation effect to your text labels under Text Options > Effects > 3D Rotation.
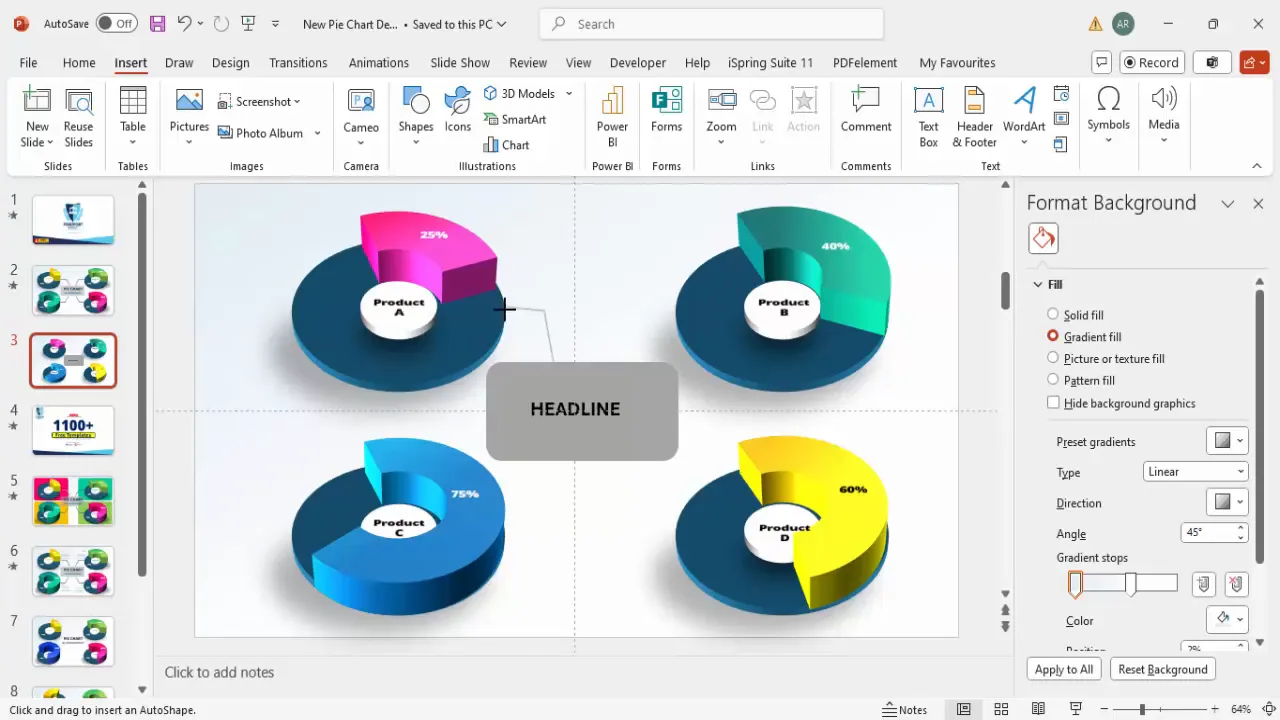
Step 3: Add Percentage Labels
- Duplicate the product name text box and place it near the corresponding pie slice.
- Change the text to the percentage value (e.g., 25%, 40%, 60%, 75%).
- Use a bold font style and adjust the color for readability, such as black or a contrasting color.
Enhancing Your Chart with Headlines and Connectors
Adding a headline and visual connectors can help your audience understand the data story more clearly.
Step 1: Add a Headline
- Insert a small rectangle shape near your pie charts.
- Remove the outline and fill the shape with a neutral gray color.
- Insert a text box inside the rectangle and type your headline or chart title.
- Center-align the text and make it bold with a larger font size.
Step 2: Create Connector Lines
- Go to Insert > Shapes > Lines and select the Freeform Shape tool.
- Draw a slightly curved line from the headline to each pie chart or percentage label.
- Double-click to finish the line.
- Duplicate and flip the connectors as needed to maintain symmetry and balance.
Animating Your Pie Charts for Impact
Adding animations can make your presentation more engaging by revealing data dynamically.
Step 1: Open the Animation Pane
Go to the Animations tab and enable the Animation Pane to manage your effects easily.
Step 2: Add Entrance Effects
- Select the pie chart or slice you want to animate.
- Click Add Animation and select an entrance effect like Peek In, Random Bars, or Zoom.
- Set the animation to start After Previous for smooth sequencing.
Step 3: Copy Animation to Other Objects
Use the Animation Painter tool to copy animation settings from one object to others, ensuring consistency and saving time.
Step 4: Preview Your Animation
Click Play All in the Animation Pane to see how your pie charts animate on slide load.
Frequently Asked Questions (FAQ)
Q1: Can I create pie charts with live data in PowerPoint?
PowerPoint itself does not support live data linking for pie charts like Excel does. However, you can embed Excel charts into PowerPoint and update them in Excel to reflect changes. The method described here is for creating fully customizable, visually appealing pie charts directly within PowerPoint.
Q2: How do I make sure my pie chart slices are accurate to data?
While this tutorial focuses on design, for accurate data representation, you can calculate slice sizes in degrees or percentages and manually adjust the shapes accordingly. Alternatively, use Excel to create precise pie charts and import them into PowerPoint if data accuracy is paramount.
Q3: Can I use these pie chart designs for presentations on different devices?
Yes, these charts are created entirely within PowerPoint, so they will display correctly on any device with PowerPoint installed. Just ensure that your fonts and colors are compatible and test your slides on the target device before presenting.
Q4: How do I save my pie chart templates for future use?
After creating your pie chart, save the slide as a PowerPoint template (.potx) or save the slide individually and reuse it in other presentations by importing the slide.
Q5: Can I animate pie chart slices separately to highlight segments?
Absolutely! By grouping slices separately or ungrouping your pie chart shapes, you can apply individual animations to each slice to emphasize specific data points during your presentation.
Conclusion
Mastering PowerPoint functions like creating beautiful and interactive pie charts empowers you to present data in a visually compelling and professional manner. By following this step-by-step guide, you can design 3D pie charts with custom colors, shadows, labels, and animations—all within PowerPoint without needing additional software.
Remember, effective data visualization is not just about aesthetics but also about clarity and audience engagement. Use these techniques to enhance your presentations, make your data stand out, and communicate your message with confidence.
Practice these steps, experiment with colors and effects, and soon you’ll be creating stunning pie charts that captivate your audience every time.
Check out the full video: Create Beautiful Pie Chart in PowerPoint


