
If you’re looking to elevate your presentations and master the art of PowerPoint slide design, creating engaging infographic slides is a key skill. In this comprehensive guide, we’ll walk you through how to create an eye-catching eight options infographic slide in PowerPoint. This method not only enhances the visual appeal of your slides but also organizes information clearly and effectively.
Whether you’re designing for business, education, or creative projects, this tutorial will equip you with practical steps to design a professional infographic slide with interactive options. Follow along as we break down each phase—from creating shapes to adding icons and applying smooth morph transitions—so you can replicate this dynamic slide effect in your own presentations.
Let’s dive into the detailed process of crafting this infographic slide, while also exploring best practices for PowerPoint slide design to ensure your presentations stand out.
Table of Contents
- Getting Started: Setting Up Your Slide
- Building the Structure with Shapes and Guides
- Customizing Shapes for Visual Appeal
- Color Coding and Adding Depth
- Adding the Central Shape
- Incorporating Icons for Clarity
- Adding Text Labels and Grouping
- Applying the Morph Transition Effect
- Conclusion
- Frequently Asked Questions
Getting Started: Setting Up Your Slide
The first step to creating a professional infographic slide is setting up a clean workspace in PowerPoint. Start by adding a new slide to your presentation. To ensure precision in placing objects, enable guides for alignment:
- Go to the View tab.
- Enable Guides to help align your shapes and text accurately.
Using guides early on is a crucial best practice in PowerPoint slide design, as it keeps your elements neatly organized, avoiding a cluttered or misaligned look.
Building the Structure with Shapes and Guides
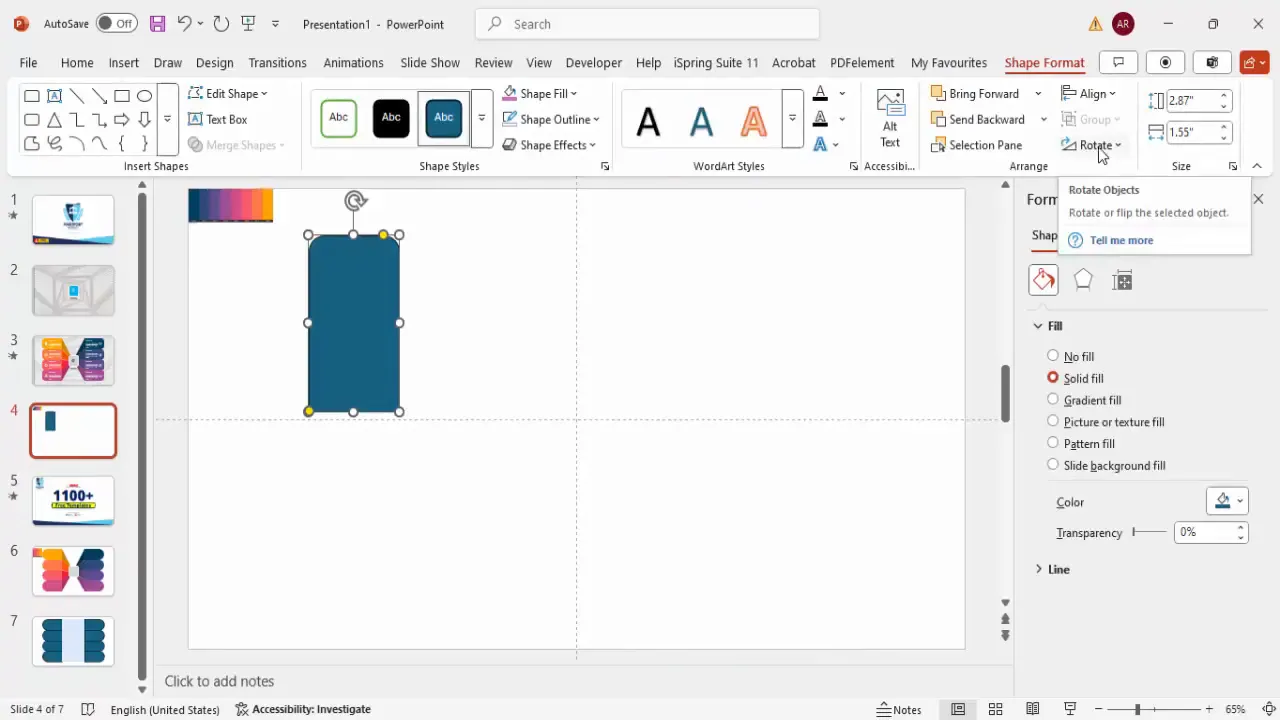
Next, you’ll begin creating the core visual elements of the infographic using PowerPoint shapes. Here’s how:
- Go to the Insert tab and select Shapes.
- Choose a Rectangle shape from the options.
- Draw a rectangle near the top corner of the slide.
- Rotate the rectangle by 90 degrees to align it vertically using the Rotate option under the Shape Format tab.
- Adjust the height of the rectangle as needed to suit your design.
After creating the first rectangle, duplicate it four times to create a vertical stack of rectangles. Hold Ctrl + Shift while dragging the shape down to duplicate it precisely in line.
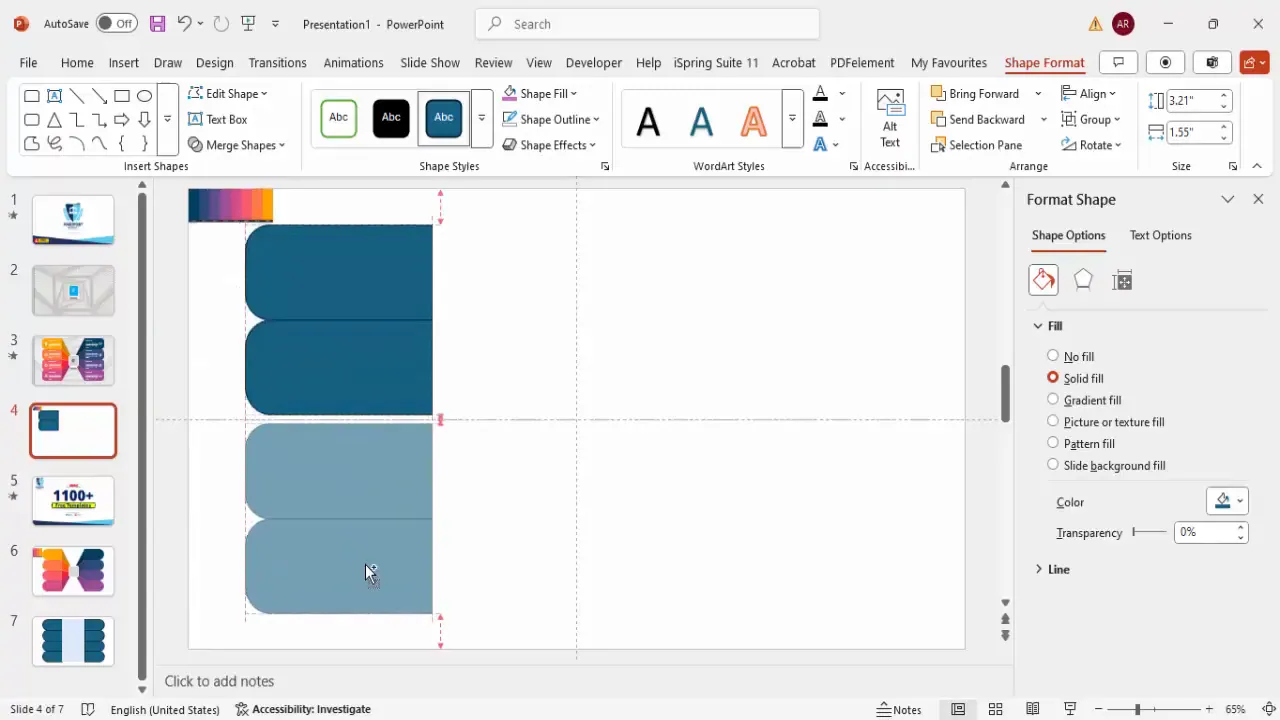
To add a more dynamic look, adjust the curvature of the rectangles by dragging the small orange adjustment points on the shape. This subtle design tweak creates a smoother, more visually appealing edge.
Then, select two rectangles and duplicate them together to create a second set below the first, aligning all rectangles centrally along the vertical axis. Use the Align function in the Shape Format tab to ensure perfect alignment.
Customizing Shapes for Visual Appeal
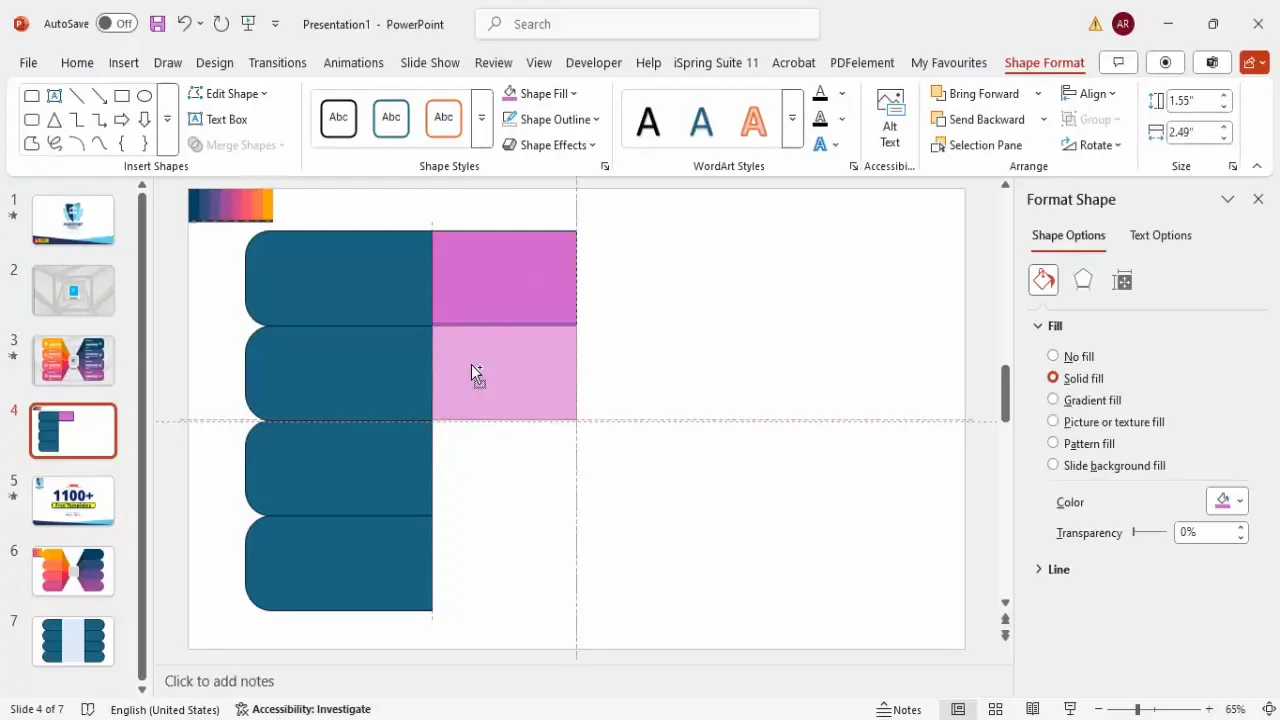
With the basic layout in place, you can add horizontal rectangles between the vertical ones to form the infographic’s arms or sections. Follow these steps:
- Insert another rectangle with the same height as the vertical rectangles.
- Apply a different fill color to distinguish these horizontal segments.
- Duplicate this horizontal rectangle multiple times, arranging them evenly between the vertical stacks.
- Use the Align tools to ensure all shapes are perfectly lined up horizontally and vertically.
Alignment is a key element in PowerPoint slide design, and using the built-in alignment tools guarantees a professional and polished look.
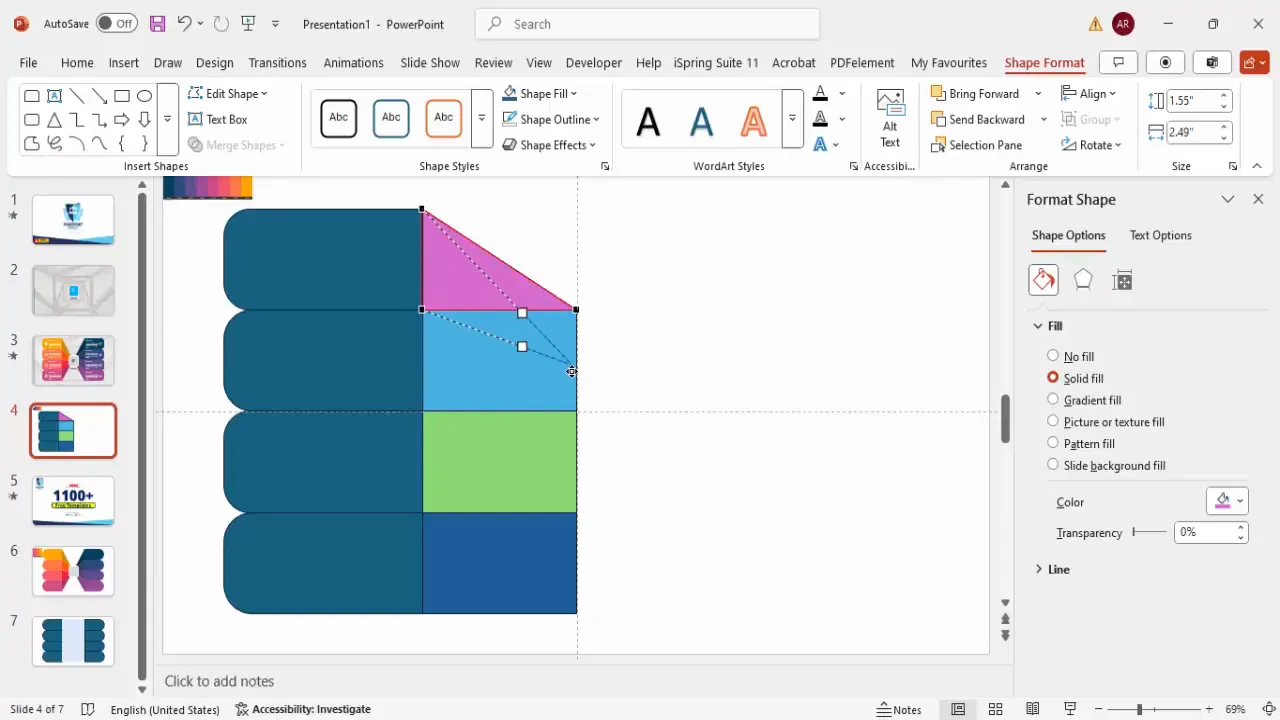
Once all rectangles are placed and aligned, you can further customize the shapes by editing points:
- Select a shape, right-click, and choose Edit Points.
- Delete specific points (usually corners) to transform rectangles into right triangles or other shapes.
- Drag the remaining points to reposition and refine the shape.
This allows you to create unique shapes that form the infographic’s directional arrows or pointers, enhancing the visual flow of your slide.
Color Coding and Adding Depth
Color plays a vital role in infographic design. Assign distinct colors to each option to make the slide visually vibrant and easy to navigate. Here’s how to effectively use color coding and shading:
- Assign different fill colors to each shape, using contrasting or complementary colors for visual interest.
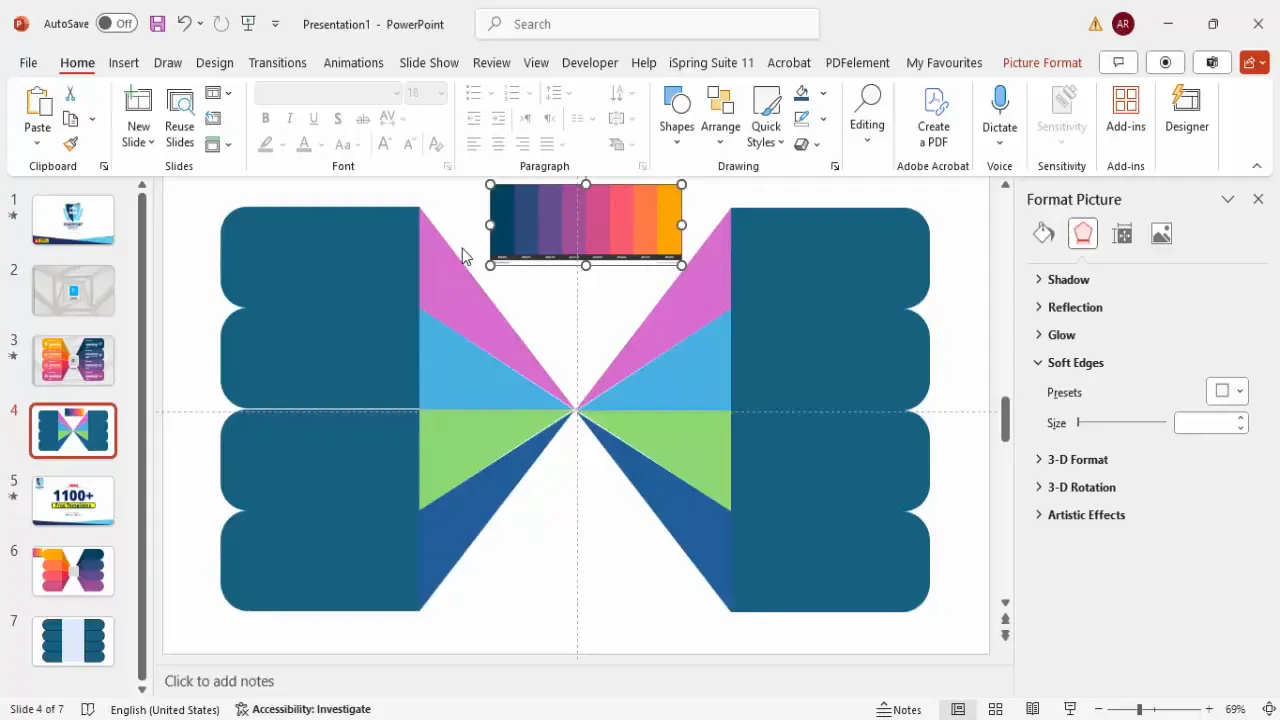
- Use the Eyedropper tool to pick colors from a palette or an image to maintain consistency.
- To add depth, apply darker shades of the base colors to certain shapes by adjusting the color’s brightness or saturation.
- Remove shape outlines by setting the outline to No Outline for a cleaner look.
Adding subtle shading and adjusting color depth creates a sense of dimension, making your infographic look more professional and engaging.
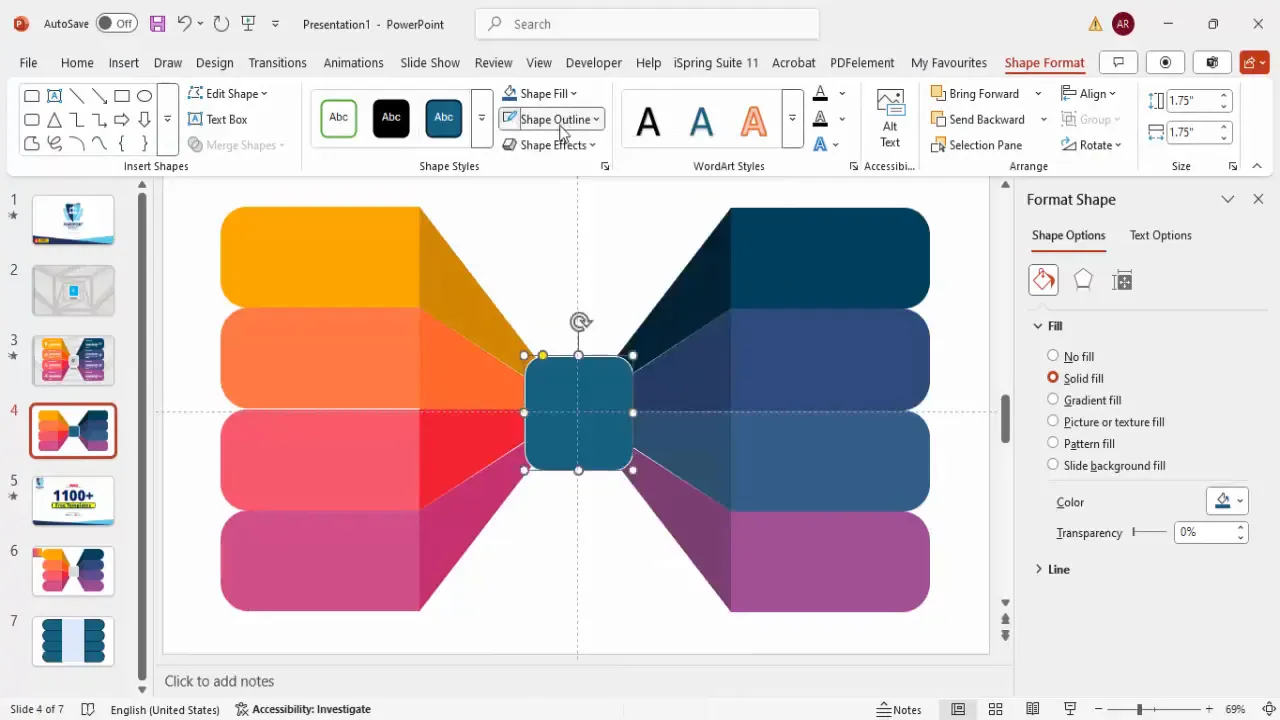
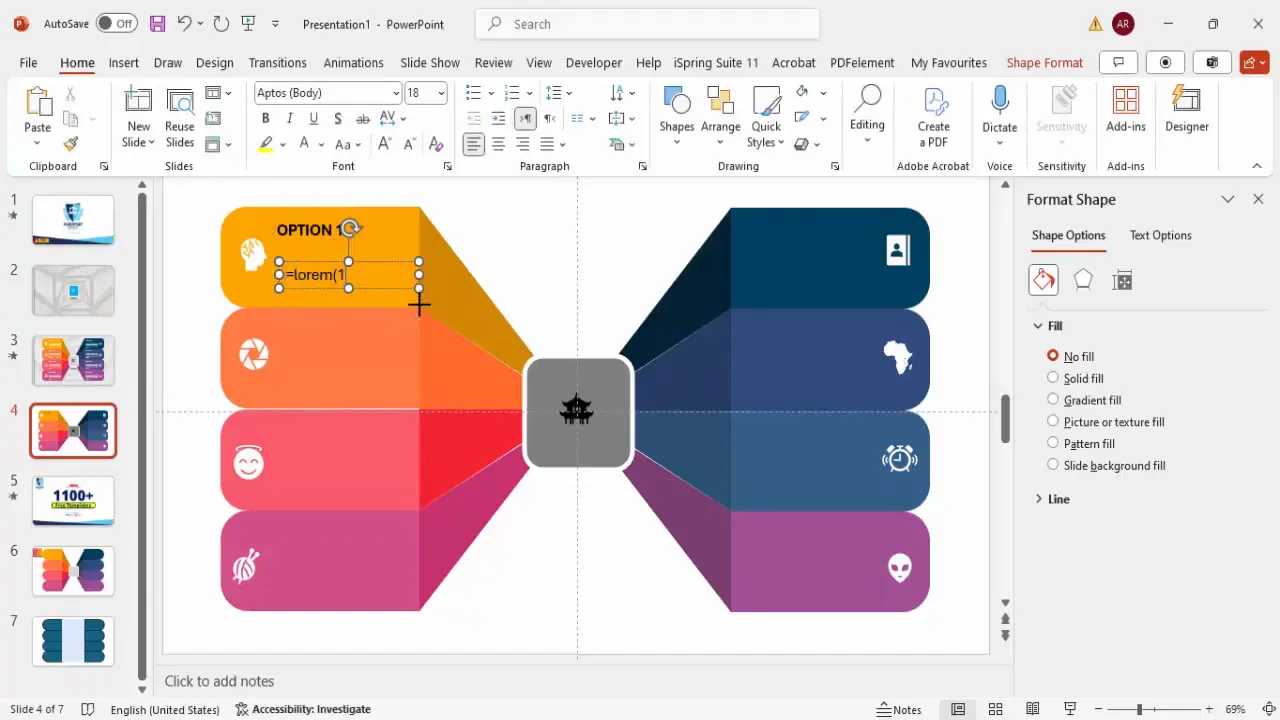
Adding the Central Shape
To bring the infographic together, add a central shape that acts as the pivot or focal point. This shape can be a rectangle or an oval placed exactly at the center of your slide:
- Insert your chosen shape in the center.
- Apply a white outline with increased weight to make it stand out.
- Fill it with a color of your choice that complements the surrounding shapes.
This central shape serves as the anchor for your eight options and enhances the overall balance of the slide.

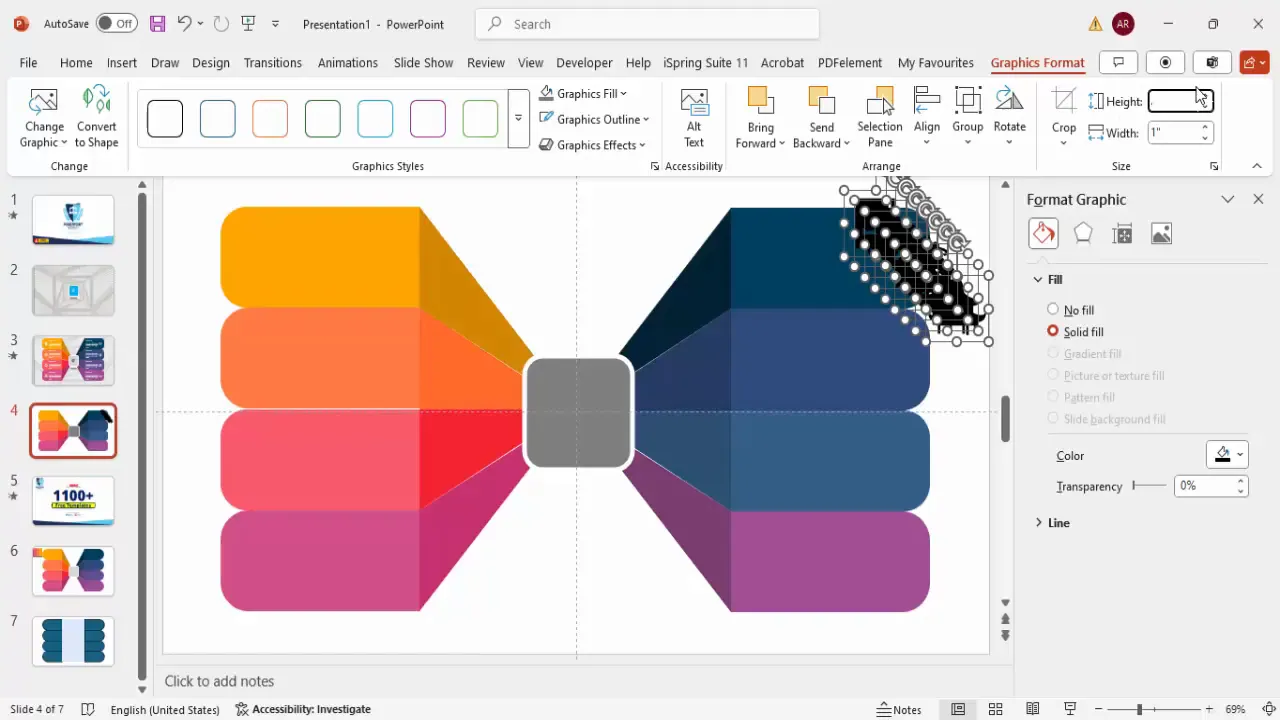
Incorporating Icons for Clarity
Icons are powerful visual cues that help convey meaning quickly and add a professional touch to your infographic. Follow these tips to add icons effectively:
- Go to the Insert tab and select Icons.
- Choose nine icons that match your presentation’s theme or the nature of your options.
- Insert the icons and resize them uniformly (e.g., height and width at 0.6 inches) for consistency.
- Place one icon in the center shape and one icon for each of the eight options.
- Make all icons white for high contrast and visibility against colored backgrounds.
Icons help users quickly identify each option’s purpose, making your infographic user-friendly and visually appealing.
Adding Text Labels and Grouping
Next, add descriptive text labels to each option to clarify their meaning. Here’s how to do it neatly and efficiently:
- Insert a text box near each option and type the label, such as “Option 1,” “Option 2,” etc.
- Make the text bold for emphasis.
- Adjust font size to fit neatly within the space.
- Change the font color to white to ensure readability against colored backgrounds.
- Align the text left for a clean, professional look.
- Group the text box with its corresponding icon using Ctrl + G to keep them together when moving.
- Duplicate and update the text labels for all eight options.
Grouping related elements reduces the chance of misalignment and makes future edits easier.
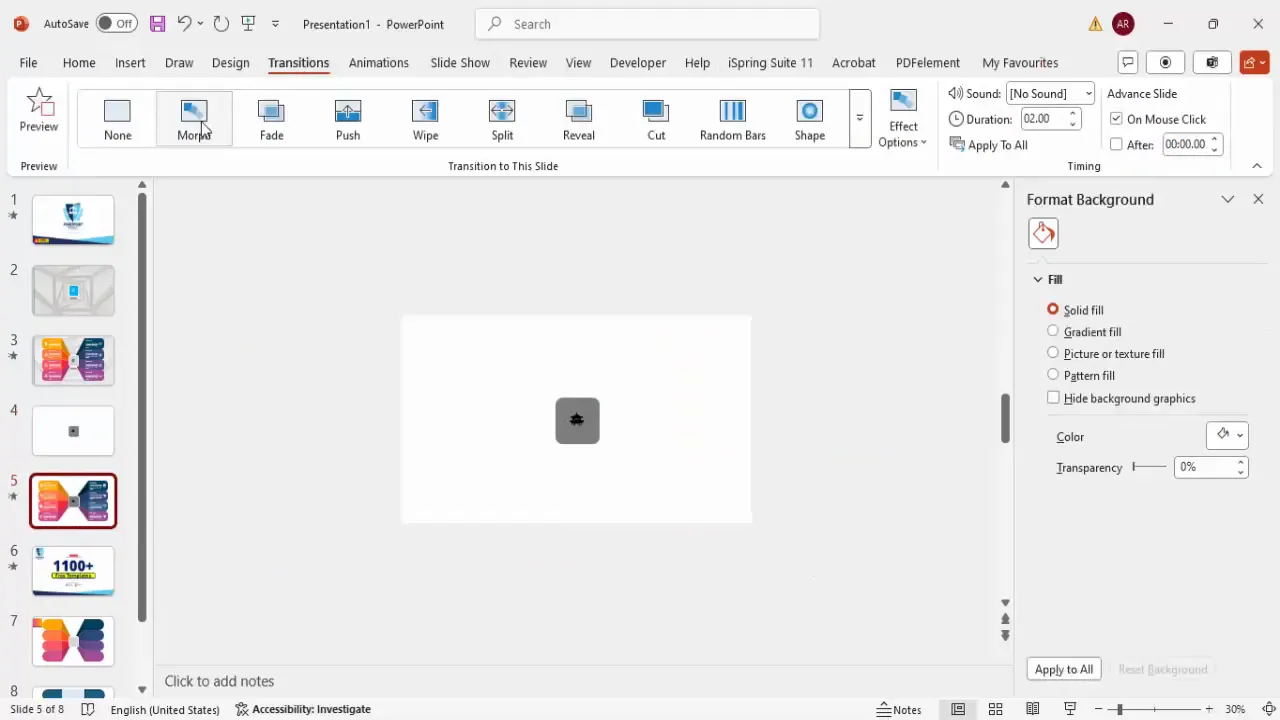
Applying the Morph Transition Effect
To create a dynamic and interactive slide, use PowerPoint’s Morph transition. This effect animates the transition between slides, making your infographic more engaging:
- Duplicate your completed infographic slide.
- On the first slide, move all option shapes outside the slide boundaries, leaving only the center shape visible.
- Leave the second slide unchanged.
- Select the second slide, go to the Transitions tab, and choose Morph transition.
- Set the transition duration to 1 second for a smooth effect.
- Play the slide show to see the options animate in from the sides to the center.
This morphing effect adds professional polish to your presentation and helps maintain audience interest.
Conclusion
Mastering PowerPoint slide design means not only knowing how to use tools but also understanding how to present information clearly and attractively. Creating an eight options infographic slide involves careful planning, precise alignment, effective use of shapes, colors, icons, and smart animation techniques like morph transitions.
By following this step-by-step guide, you can build professional infographic slides that enhance your presentations and captivate your audience. Remember to always use guides for alignment, group related elements, and use color and shading thoughtfully to add depth and clarity.
Experiment with different color schemes, icons, and text labels to customize the infographic to your unique content needs. With practice, these techniques will become second nature, enabling you to produce visually stunning and effective PowerPoint presentations.
Frequently Asked Questions
What is the Morph transition in PowerPoint and how does it work?
The Morph transition is a powerful animation effect in PowerPoint that smoothly animates the movement, resizing, and transformation of objects between slides. When you duplicate a slide and rearrange objects, Morph automatically animates the changes, creating seamless transitions that look professional and engaging.
Can I customize the colors of the infographic shapes?
Yes, you can fully customize the colors of all shapes in your infographic. Use the Eyedropper tool to pick colors from an image or palette, or manually select colors that match your brand or presentation theme. Adding shading by adjusting color brightness adds depth and richness to your design.
How do I ensure all shapes and text are aligned properly?
Use PowerPoint’s built-in alignment tools found under the Shape Format tab. The Align options include aligning objects left, right, center, top, bottom, or distributing them evenly. Enabling guides and snapping helps maintain consistent spacing and positioning.
Can I add interactive elements to the infographic?
Yes, besides animations like Morph, you can add hyperlinks or triggers to your infographic shapes or icons. This allows users to click on options to navigate to different slides or external resources, creating an interactive presentation experience.
Is this infographic slide design suitable for all types of presentations?
This design is versatile and can be adapted for business reports, educational content, marketing pitches, and more. Modify colors, icons, and text to suit your audience and purpose. The clean and modern look ensures broad applicability.
Where can I find free PowerPoint templates to practice these techniques?
Many sources offer free PowerPoint templates, including official Microsoft templates and community-driven sites. You can also find free templates from PowerPoint University, which provides over a thousand free templates designed for professional use.
Check out the full video: Create 8 Options Infographic Slide in PowerPoint


