
If you’re looking to elevate your PowerPoint Slide Design skills and create engaging, visually appealing infographic slides, you’re in the right place. In this comprehensive guide, I’ll walk you through the step-by-step process of designing a dynamic 5 options infographic slide in PowerPoint. This tutorial is perfect for professionals, educators, and anyone who wants to make their presentations stand out with creative visuals and interactive elements.
By the end of this guide, you’ll be able to create a slide that not only looks professional but also allows you to showcase multiple options or points with distinct colors and smooth animations. Let’s dive into the process and transform your PowerPoint presentations with this versatile infographic slide design.
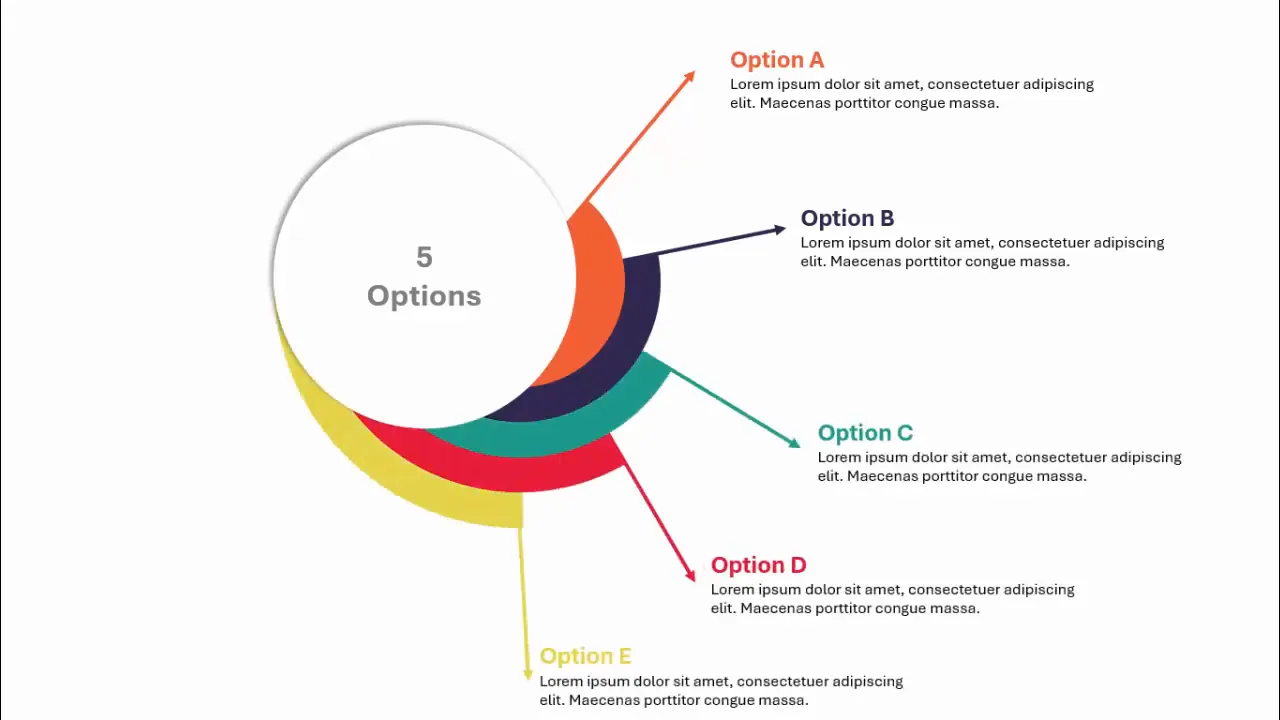
Table of Contents
- Introduction to the Infographic Slide
- Step 1: Preparing Your PowerPoint Slide
- Step 2: Creating the Partial Circles
- Step 3: Adding Arrows for Visual Direction
- Step 4: Grouping and Layering Shapes
- Step 5: Adding the Center Oval and Text Details
- Step 6: Customizing Colors and Text
- Step 7: Enhancing with Animations and Effects
- Frequently Asked Questions
- Conclusion
Introduction to the Infographic Slide
The infographic slide we’ll create is designed to present five distinct options or categories in a visually compelling way. Each option will have its own color and arrow indicator, allowing your audience to easily differentiate between the points. This type of slide is ideal for business presentations, project proposals, educational content, or any scenario where you want to break down information into clear, digestible segments.
What makes this slide design effective is the combination of simple geometric shapes, thoughtful color coordination, and interactive elements that engage your viewers. The slide changes visually as you click through each option, highlighting the selected section with a unique color combination.
Step 1: Preparing Your PowerPoint Slide
Before diving into the design, it’s important to set up your PowerPoint workspace properly for precise alignment and ease of editing. Here’s how to get started:
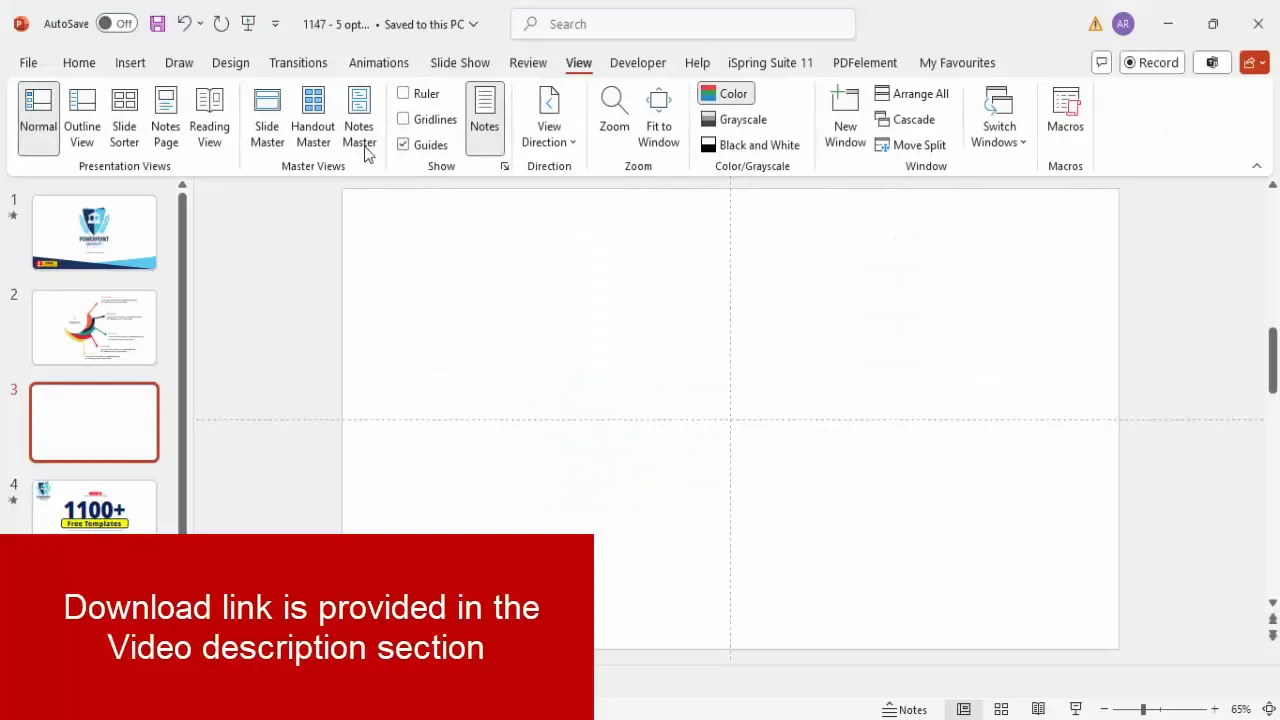
- Add a new slide: Start with a blank slide to have a clean canvas.
- Enable guides: Go to the View tab and enable Guides. These will help you align your shapes perfectly in the center.
Setting guides ensures that all your shapes and elements will be perfectly centered and aligned, creating a professional and balanced look.
Step 2: Creating the Partial Circles
The core visual of this infographic slide is made up of layered partial circles, each with different sizes and colors. These circles create a dynamic, layered effect that forms the base of each option.
- Insert the first partial circle: Go to Insert > Shapes and select the Partial Circle from Basic Shapes. Click on the slide center to place it.
- Remove the outline: Select the shape and set the shape outline to “No Outline” for a clean look.
- Align the shape: Use Align Center and Align Middle to position it perfectly in the slide center.
- Set size: Adjust the height and width to 1.5 inches (or your preferred unit) for the smallest circle.
- Duplicate and resize: Press Ctrl + D to duplicate the partial circle and increase its size sequentially to 2, 2.5, 3, and 3.5 inches respectively for the five options.
- Apply different colors: Change the fill colors for each circle to distinguish the options. You can use any color scheme that fits your presentation brand or theme.
- Send each larger circle to back: After resizing and coloring, send the larger circles to the back so the smaller ones appear on top, creating a layered effect.
This process gives you five concentric partial circles, each representing a different option with a unique color.
Tips for Working with Partial Circles
- Always align shapes at the center and middle to maintain symmetry.
- Use contrasting colors to make each option stand out clearly.
- Don’t worry about perfect colors initially; you can always adjust them later.
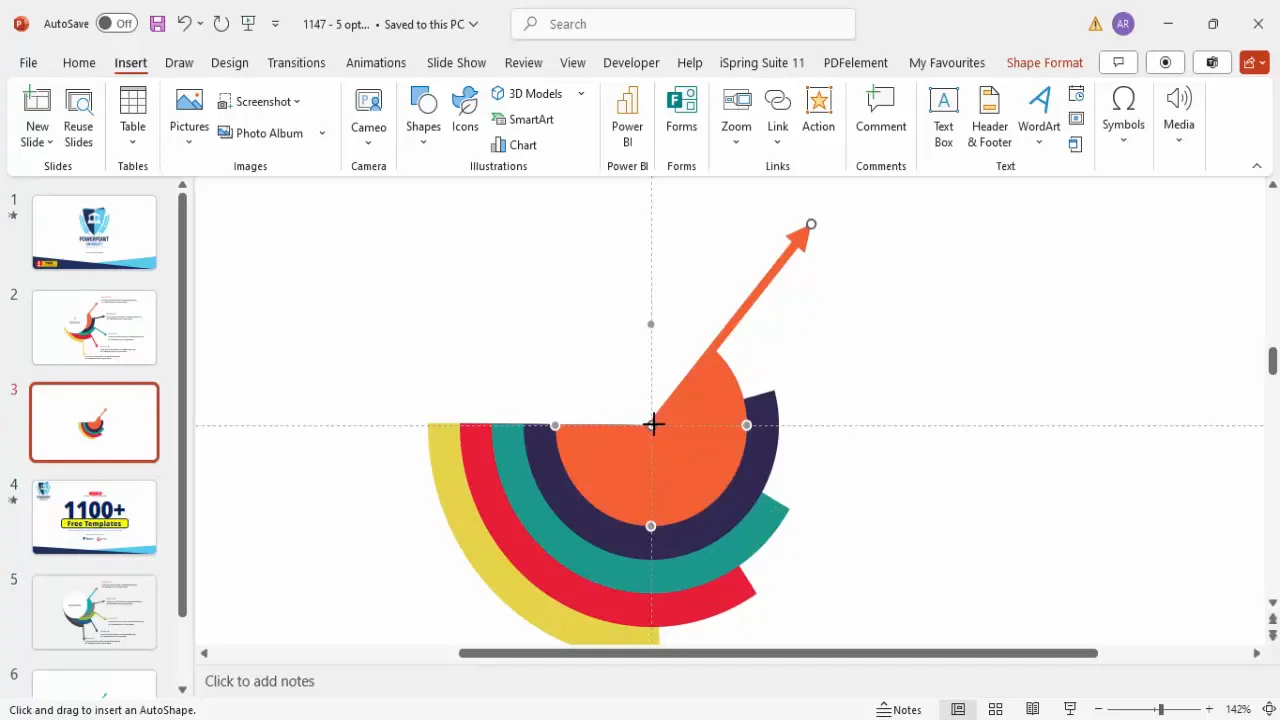
Step 3: Adding Arrows for Visual Direction
To enhance the infographic and guide the viewer’s attention, add arrows pointing from the center to each partial circle. These arrows act as visual cues linking the central concept to each option.
- Insert an arrow shape: Go to Insert > Shapes and select an arrow.
- Draw the arrow: Draw it from the slide center outward toward the edge of the partial circle.
- Format the arrow: Set the arrow’s outline color to match the color of the corresponding partial circle.
- Adjust outline width: Increase the outline width to about 0.25 inches (or four quarters) to make the arrows prominent.
- Repeat for all options: Add five arrows in total, each pointing to the respective partial circle with matching colors and outline widths.
The arrows visually connect the options to the center, making the infographic easy to follow and more engaging.
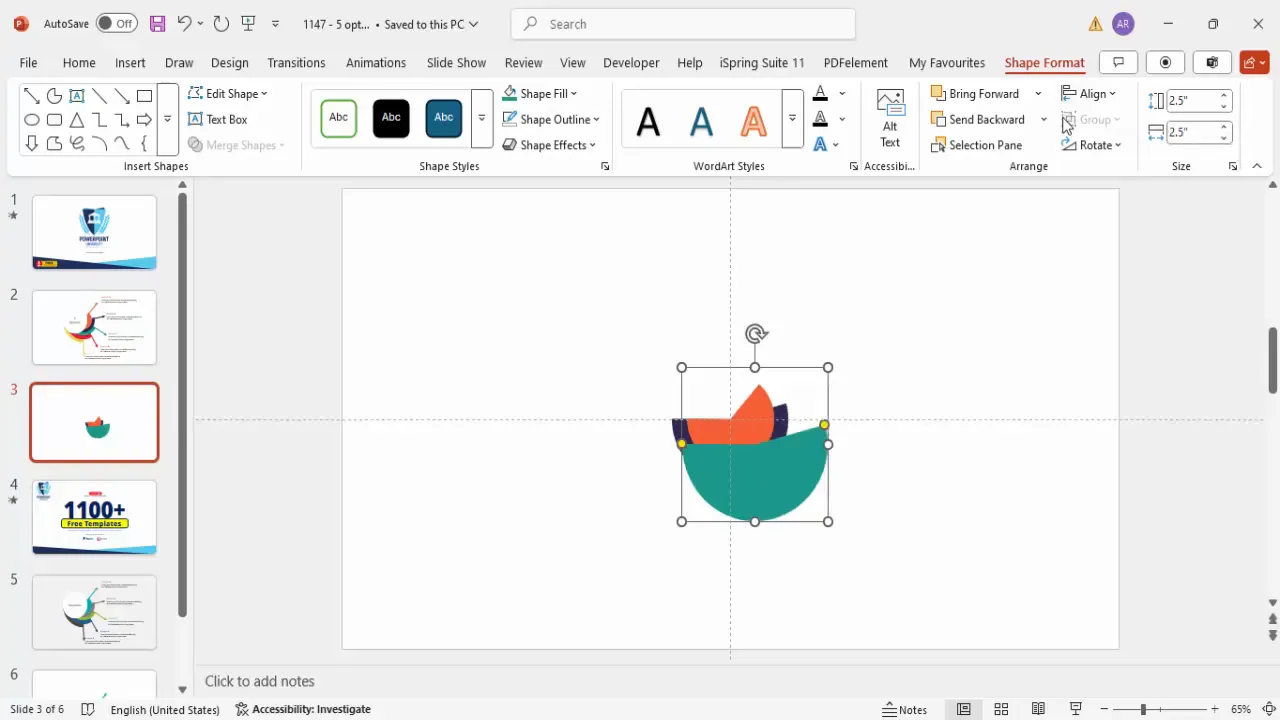
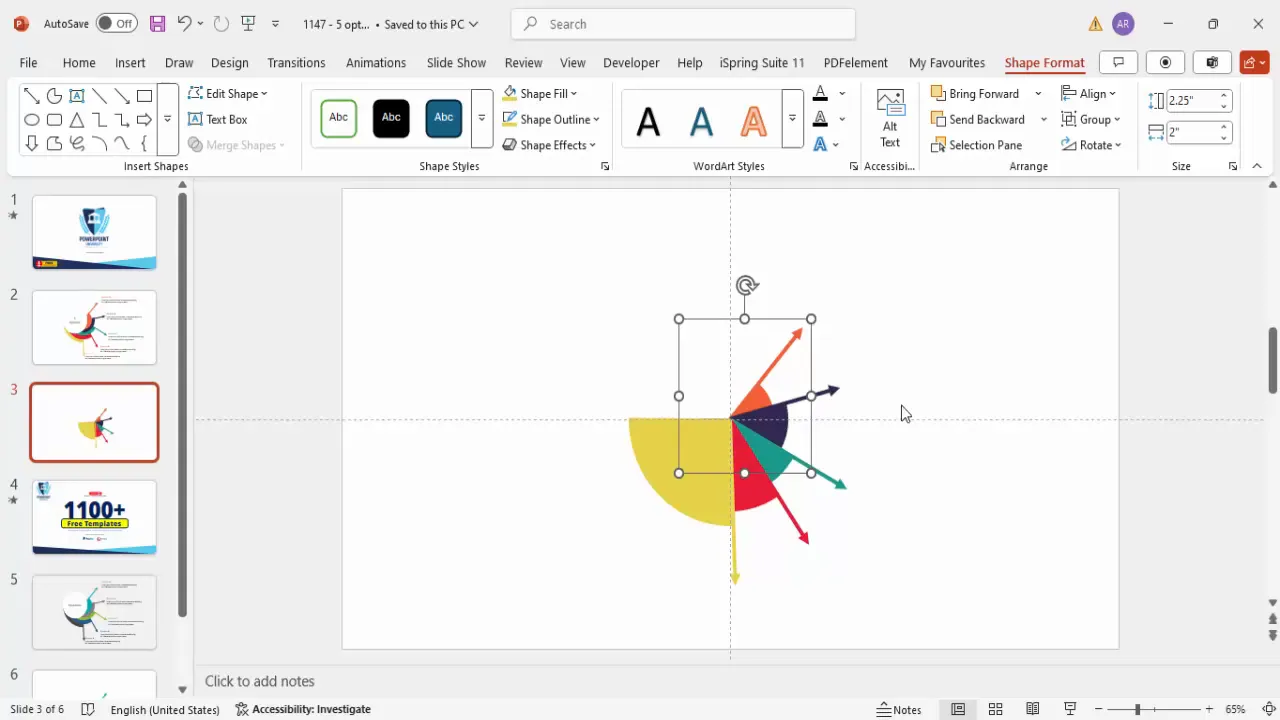
Step 4: Grouping and Layering Shapes
Grouping your shapes is crucial for easy management and consistent formatting. Here’s how to organize your infographic elements:
- Group each option’s elements: Select the partial circle and its corresponding arrow, then press Ctrl + G to group them.
- Repeat for all five options: You should have five groups, each containing a partial circle and an arrow.
- Manage layering: Use Send to Back options to layer the groups correctly so smaller circles appear on top of larger ones, maintaining the visual hierarchy.
Grouping allows you to move, resize, and format each option as a single unit, saving time and preventing accidental misalignment.
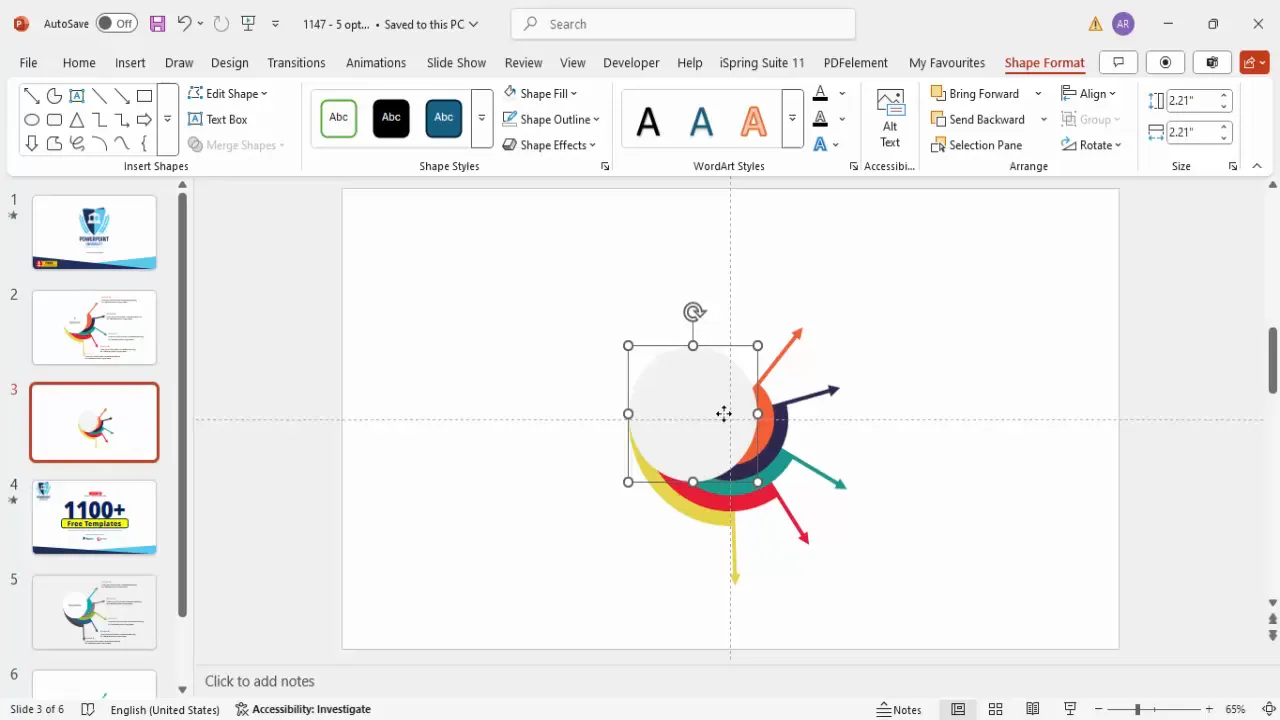
Step 5: Adding the Center Oval and Text Details
The center of the infographic slide features a small oval shape that anchors the design and adds focus.
- Insert an oval shape: Go to Insert > Shapes and select the oval shape.
- Draw the oval: Create a small oval in the center of the slide.
- Format the oval: Set the shape outline to “No Outline” or a subtle gray, and fill it with a neutral gray color.
- Group all elements: Select all the infographic elements including the oval, and press Ctrl + G to group them.
- Resize as needed: Hold the Shift key while resizing to maintain proportions and place it wherever it fits best on your slide.
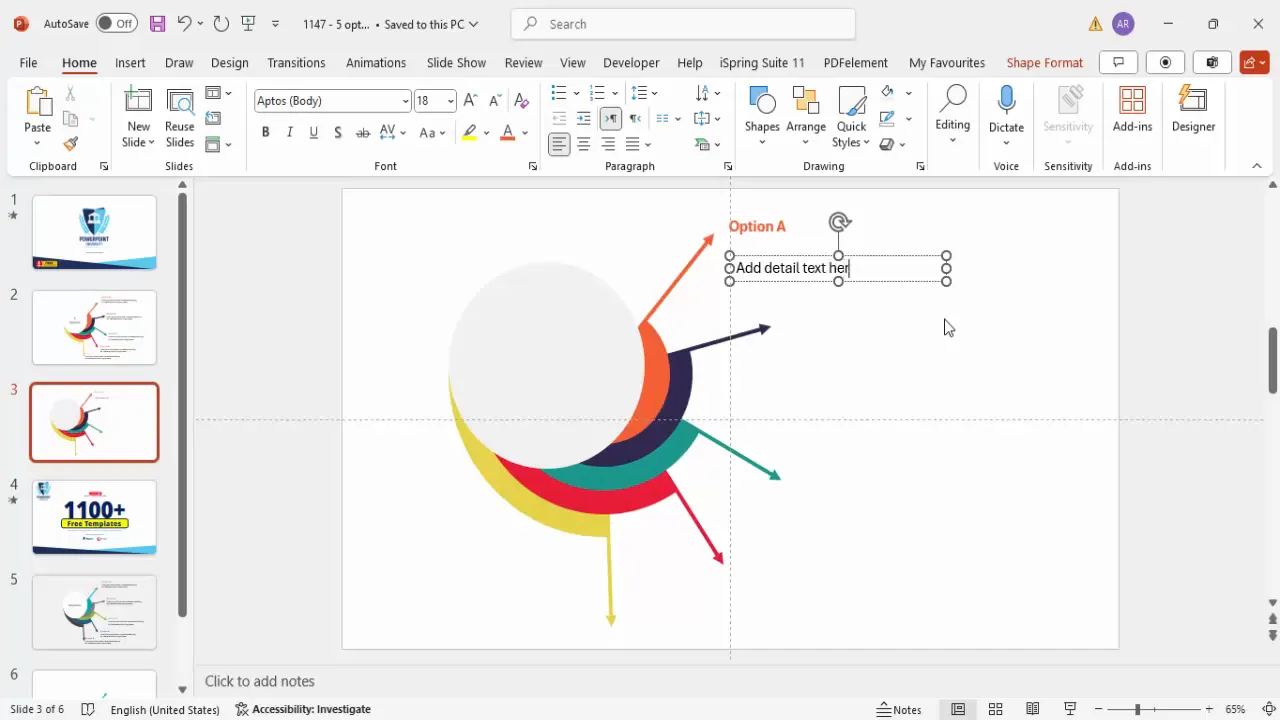
Adding Text Labels
To clearly indicate each option, add bold text labels and supporting details next to each arrow:
- Insert text boxes: Create a small text box next to each arrow for the option title (e.g., Option A, Option B, etc.).
- Format text: Make the option titles bold and use the corresponding option color for the text.
- Add detailed text: Insert another smaller text box below each option title for descriptive or supporting information. Adjust font size to keep text legible but unobtrusive.
- Duplicate and adjust: Once you create one set of option title and details, duplicate it with Ctrl + D and update the text and colors accordingly.
Step 6: Customizing Colors and Text
Colors and typography play a key role in PowerPoint Slide Design. Customizing these elements ensures your infographic matches your brand and communicates clearly.

| Option | Color | Text Color | Description |
|---|---|---|---|
| Option A | Orange | Orange | Bold title with matching color |
| Option B | Blue | Blue | Distinct color for clarity |
| Option C | Teal | Teal | Cool tone for contrast |
| Option D | Red | Red | Attention-grabbing color |
| Option E | Yellow | Yellow | Bright and energetic tone |
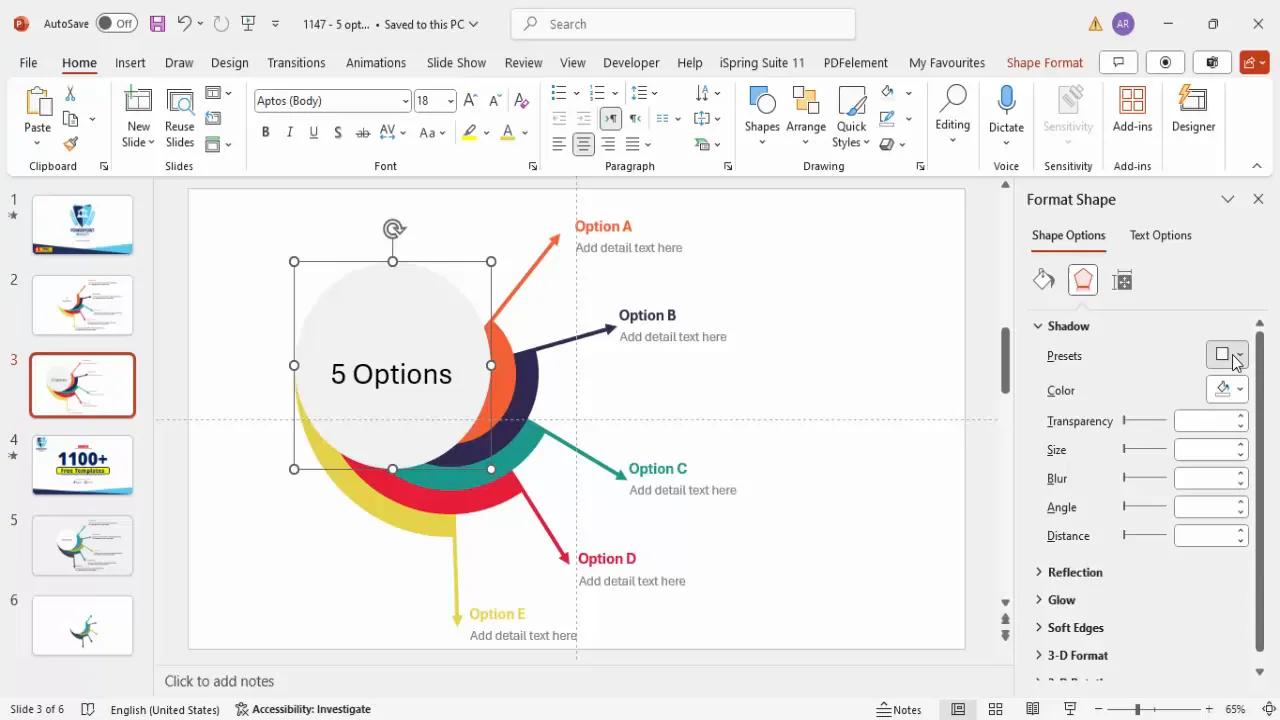
To add a professional touch, consider applying subtle effects such as shadows to your title text. This can be done by right-clicking the text box, selecting Format Shape, then navigating to Effects > Shadow, and choosing an offset such as “Top Left.”
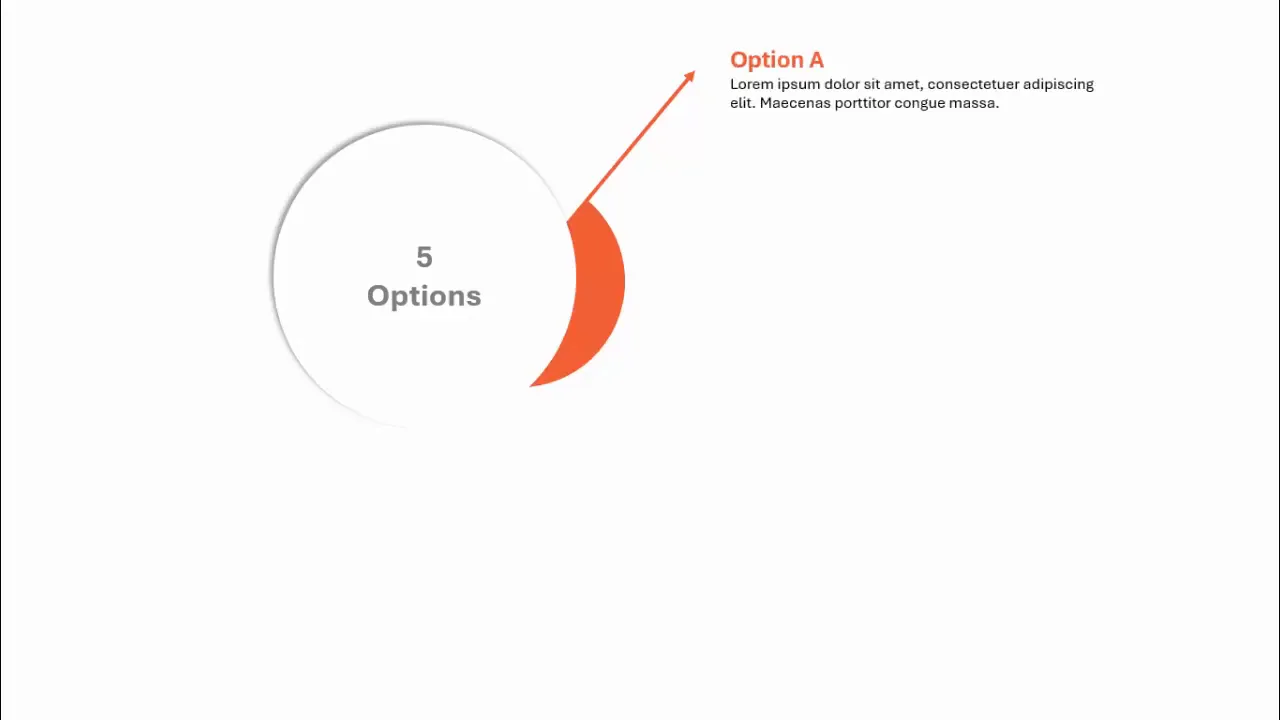
Step 7: Enhancing with Animations and Effects
Animations can bring your infographic slide to life by adding smooth transitions between options. Here’s how to add basic animation effects:
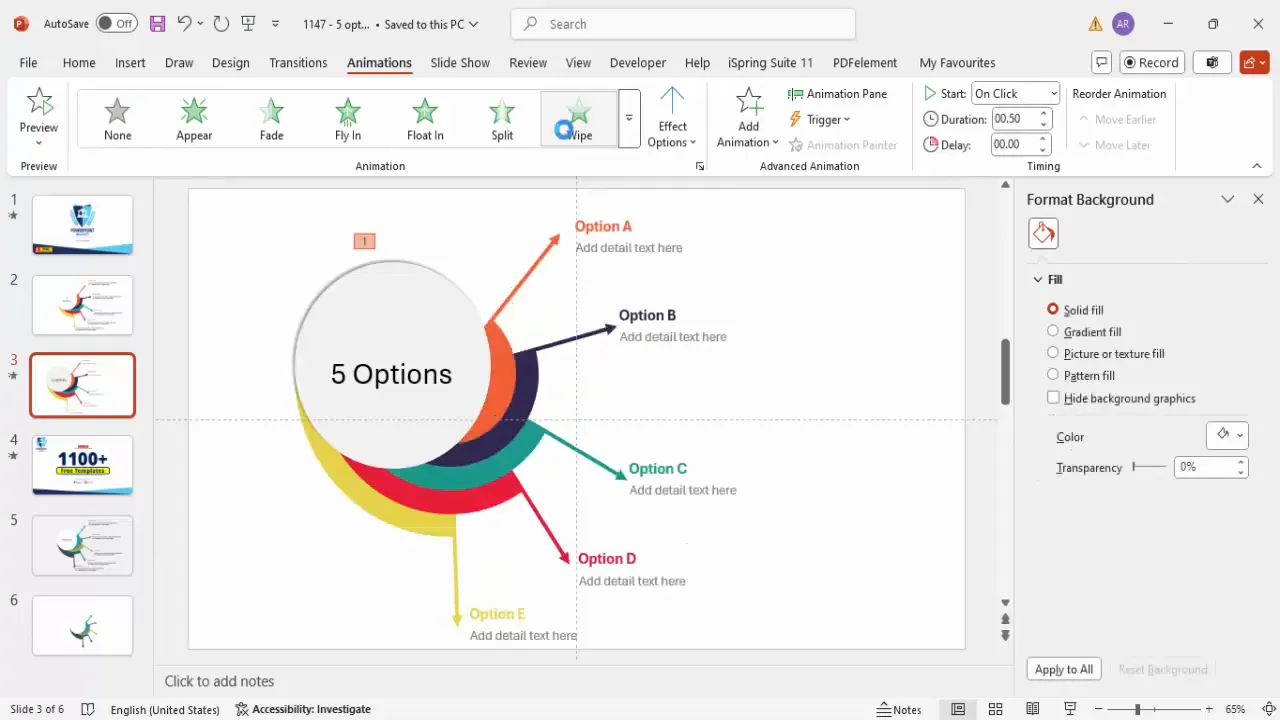
- Select the grouped option: Click on one of the grouped partial circle and arrow sets.
- Go to the Animations tab: Choose an animation effect such as Wipe.
- Configure animation direction: Adjust the direction of the wipe effect to flow naturally with your design.
- Repeat for other options: Apply the animation to each option group to create a sequential reveal as you click through the slide.
Animations should complement your slide’s purpose and not distract your audience. Keep them smooth, consistent, and professional.
Frequently Asked Questions
What is the benefit of using partial circles in a PowerPoint infographic slide?
Partial circles create a layered, dynamic visual effect that helps differentiate multiple options clearly. They add depth and structure to your slide without overwhelming the content.
Can I customize the colors to match my company branding?
Absolutely! One of the strengths of this design is its flexibility. You can easily change the fill colors and text colors to align with your brand’s color palette, making the infographic cohesive with your overall presentation.
How do I ensure my infographic is accessible and easy to read?
Use high-contrast colors for text and shapes, keep font sizes legible (minimum 24 pt for titles), and avoid clutter by spacing elements evenly. Adding clear arrows and labels also helps guide your audience’s attention.
Can I add more than five options to this infographic slide?
This design is optimized for five options to maintain clarity and balance. However, you can adapt the concept for more options by adjusting the size and number of partial circles and arrows, but be mindful of slide overcrowding.
How can I animate the slide to make it interactive during a presentation?
Use PowerPoint’s animation pane to add entrance animations like “Wipe” or “Fade” to each grouped option. Set them to trigger on clicks to reveal each option one by one, keeping your audience engaged.
Conclusion
Mastering PowerPoint Slide Design with infographic elements like this 5 options slide can significantly enhance the impact of your presentations. By combining simple shapes, thoughtful color choices, clear text, and subtle animations, you create slides that are not only visually attractive but also easy to understand and interact with.
This infographic slide design is versatile and can be adapted for various professional contexts—from business proposals to educational content. The structured step-by-step workflow outlined here ensures that even users with basic PowerPoint skills can create polished, engaging slides.
Remember, the key to great PowerPoint Slide Design is balance: simplicity, clarity, and visual appeal working together to support your message. Experiment with colors, shapes, and animations to make the infographic your own, and watch your presentations become more memorable and effective.
Happy designing!
Check out the full video: 5 Options Infographic Slide in PowerPoint


