
If you want to elevate your presentation game with professional, eye-catching infographic slides, mastering PowerPoint slide design is essential. This comprehensive guide will walk you through creating a vibrant and engaging 7-step infographic slide using PowerPoint’s built-in tools. Whether you’re designing for business, education, or creative projects, this tutorial will help you build a slide that effectively communicates your message while keeping your audience captivated.
This tutorial is inspired by the expert guidance from POWERPOINT UNIVERSITY, a trusted source offering over 1000 free PowerPoint templates and tutorials designed to make your presentations shine. Follow along to create your own customizable infographic slide that stands out and adds a wow factor to your decks.
Table of Contents
- Preparing the Slide and Setting the Background
- Building the Central Oval Shape and Trapezoid
- Creating the Rounded Bottom Shape
- Designing the 7-Point Star Structure for Options
- Merging and Fragmenting Shapes for the Infographic
- Adding Color and Layering for Depth
- Inserting Icons and Adding Text Boxes
- Grouping Elements for Easy Editing
- Applying Engaging Animations
- Final Tips and Best Practices for PowerPoint Slide Design
- Frequently Asked Questions
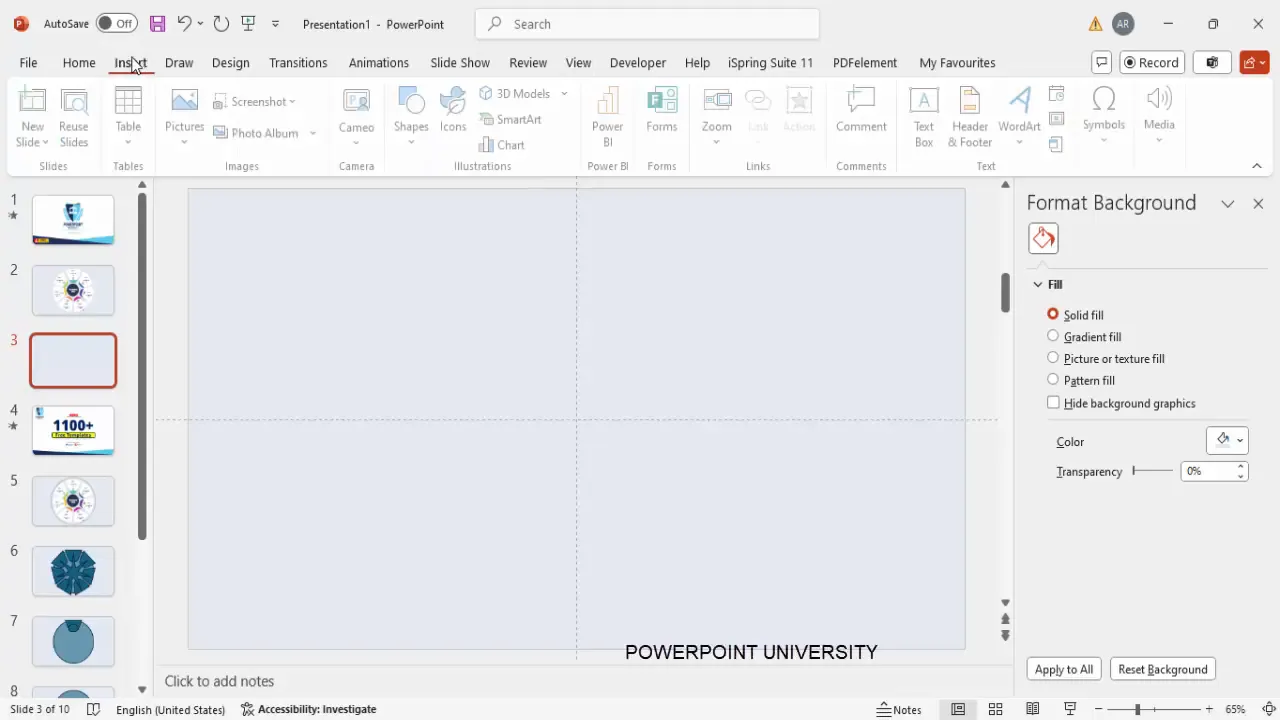
Preparing the Slide and Setting the Background
Start your design by adding a new slide and setting a clean, visually appealing background that complements your infographic elements. A light blue background works well to create a calming and professional tone without overpowering your content.
- Add a new slide in your PowerPoint presentation.
- Change the slide background color to a light blue shade of your choice.
- Enable guides by going to the View tab and checking the Guides option to help you align shapes precisely.
Using guides ensures your shapes and text align perfectly, which is crucial for clean, professional slide design.
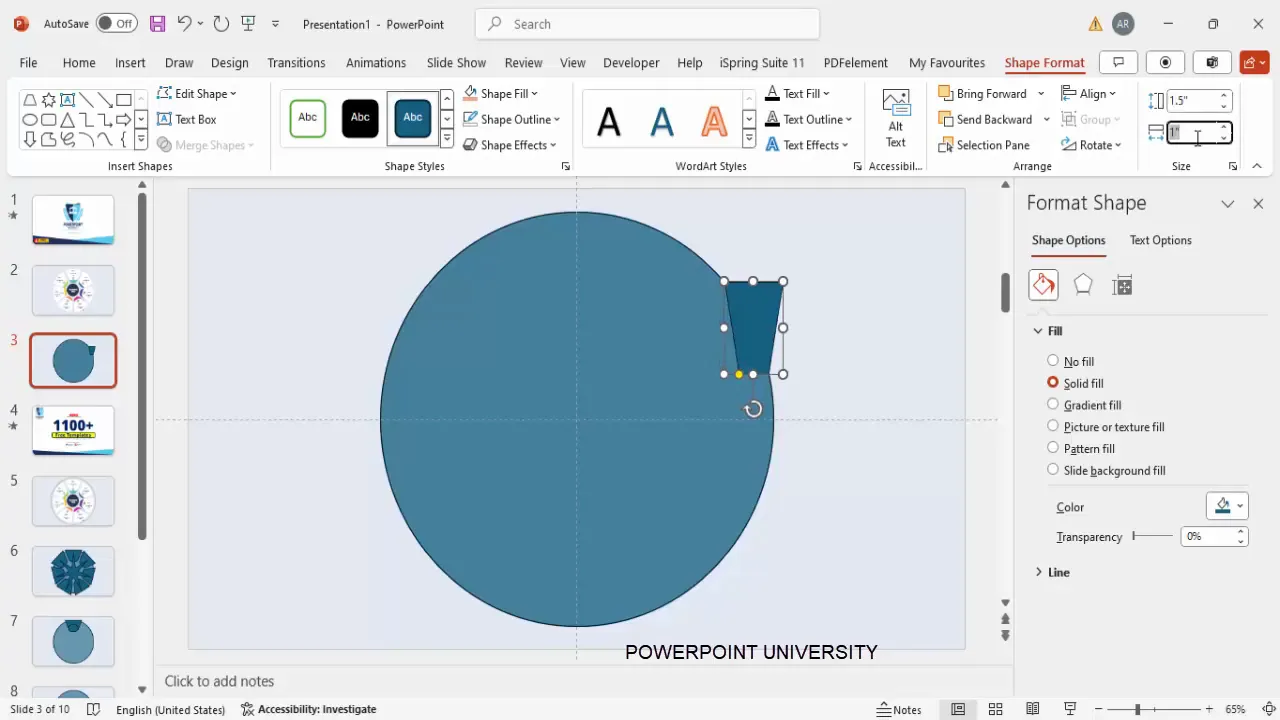
Building the Central Oval Shape and Trapezoid
The central oval shape will serve as the anchor for your infographic, containing your main title or business name. Around this, the trapezoid shapes will represent the step options.
Steps to Create the Central Oval
- Go to Insert > Shapes and select the Oval shape.
- Draw the oval in the center of your slide.
- Resize the oval to your desired dimensions suitable for your title.
- Add your business title or main heading inside the oval.
Creating and Positioning the Trapezoid
- Insert a trapezoid shape by selecting Insert > Shapes > Trapezoid.
- Set the height and width of the trapezoid to approximately 6.75 inches to maintain proportionality.
- Align the trapezoid in the center of the slide vertically and horizontally.
- Flip the trapezoid vertically by selecting Rotate > Flip Vertical.
- Adjust the trapezoid’s orange adjustment handle to elongate the bottom edge so it slightly extends outside the oval shape, ensuring it visually anchors the central oval.
- Remove the outline by setting Shape Outline to No Outline.
- Fill the trapezoid with a color that complements your theme, which you can adjust later.
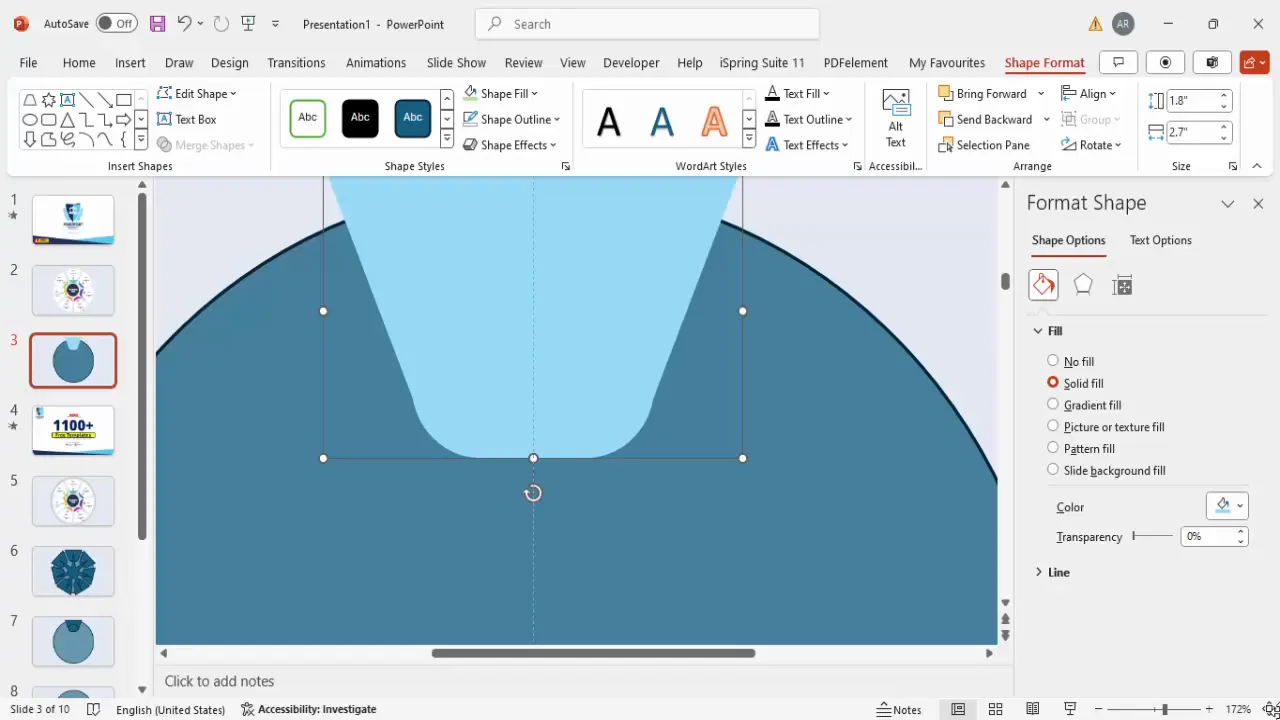
Creating the Rounded Bottom Shape
To add a smooth and professional look to the bottom of your trapezoid, create a rounded shape that blends seamlessly with the trapezoid’s bottom edge.
- Insert a Rounded Corner Rectangle from the shapes menu.
- Draw a small rounded rectangle and ensure the corners are fully curved by dragging the yellow adjustment handle.
- Remove the outline by setting Shape Outline to No Outline.
- Fill the shape with a complementary color.
- Align the rounded rectangle with the bottom edge of the trapezoid.
- Select both the trapezoid and the rounded rectangle, then use the Shape Format > Merge Shapes > Union command to combine them into a single smooth shape with a curved bottom.
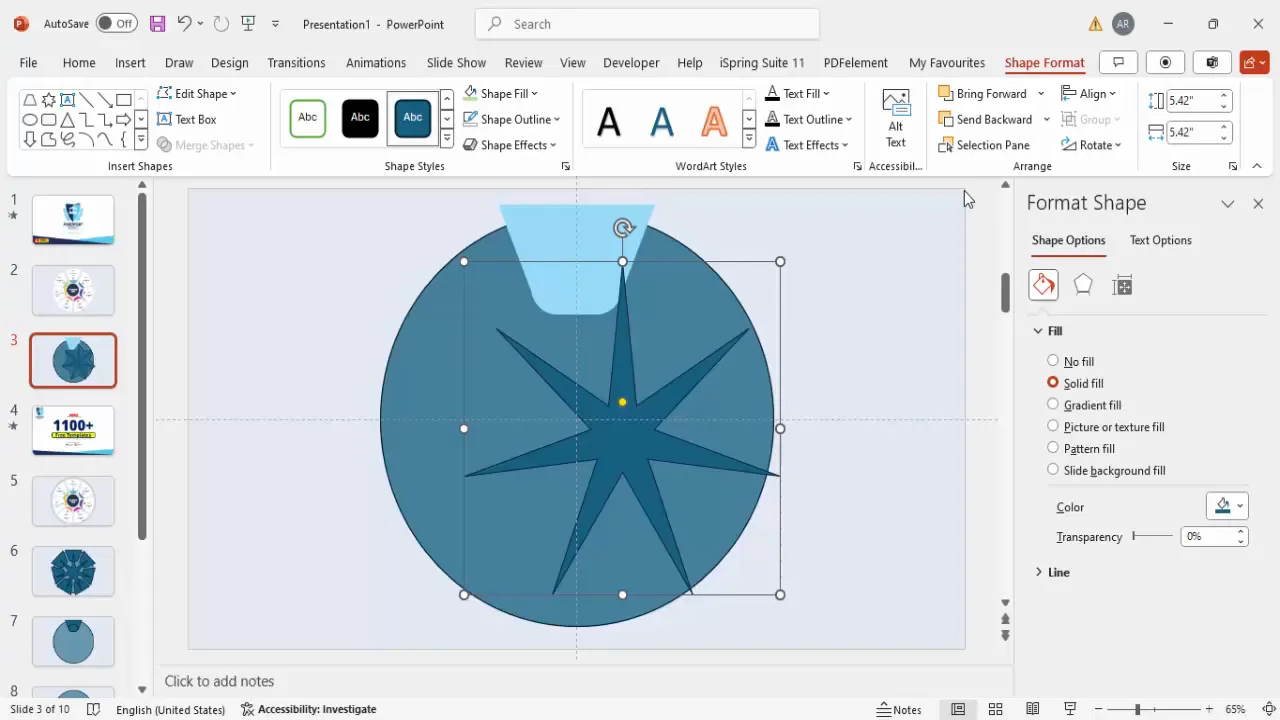
Designing the 7-Point Star Structure for Options
This is the creative part of the infographic where you design the 7 distinct option sections that radiate around the central oval. A 7-point star shape is an excellent base for this design.
- Go to Insert > Shapes > Stars and Banners and choose the 7-Point Star.
- Hold the Shift key while drawing the star to keep the proportions even.
- Center-align the star on the slide.
- The points of the star will serve as anchors for each option in your infographic.
- Duplicate the star multiple times using Ctrl + D and rotate each copy incrementally to create layered and overlapping shapes.
- Use the arrow keys combined with the Alt key to rotate shapes precisely in small increments for perfect alignment.
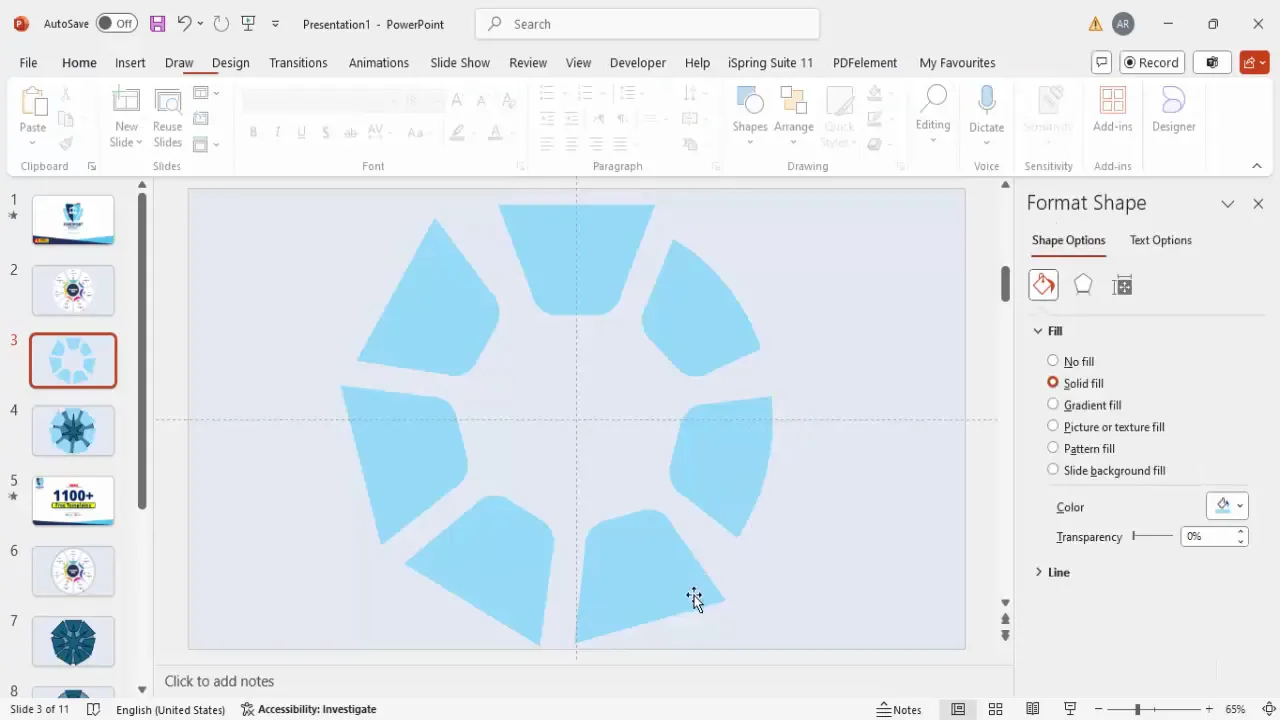
Merging and Fragmenting Shapes for the Infographic
Once the star shapes are positioned, you’ll need to merge and fragment them to create the segmented option areas of your infographic.
- Select all the star shapes on the slide.
- Navigate to Shape Format > Merge Shapes > Fragment.
- This splits the overlapping star shapes into individual segments.
- Delete any unwanted segments, leaving behind the 7 distinct option areas around the central oval.
After fragmenting, select all the remaining shape fragments and fill them with a base color, such as white, with zero transparency.
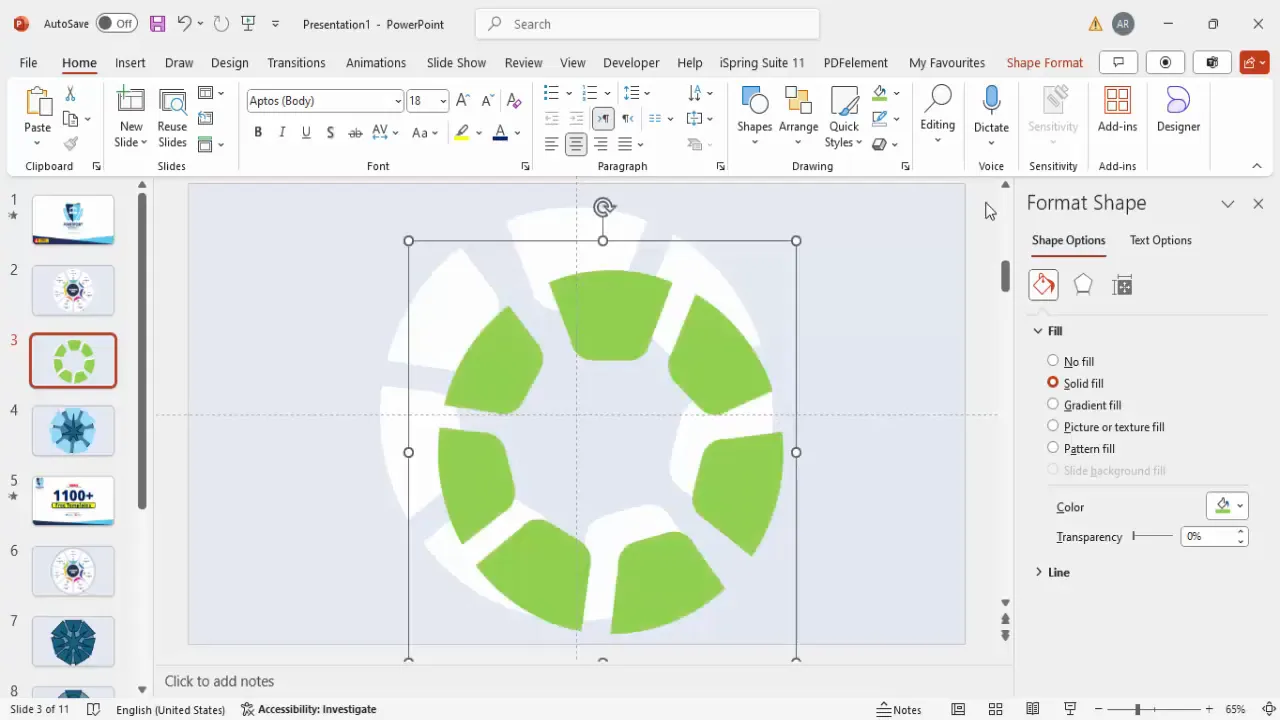
Adding Color and Layering for Depth
Color is crucial in making your infographic visually appealing and easy to understand. Use contrasting and complementary colors to differentiate each option while maintaining a harmonious palette.
- Duplicate the fragmented shape group.
- Reduce the size of the duplicate group by holding Shift and dragging inward while aligning it to the center.
- Send the smaller group to the back to create a layered effect.
- Ungroup the smaller shapes (Ctrl + Shift + G) to apply individual colors to each segment for a colorful infographic.
- Choose a different vibrant color for each of the 7 segments to make each step stand out.
Layering with varied colors and sizes adds depth and professionalism to your slide design.
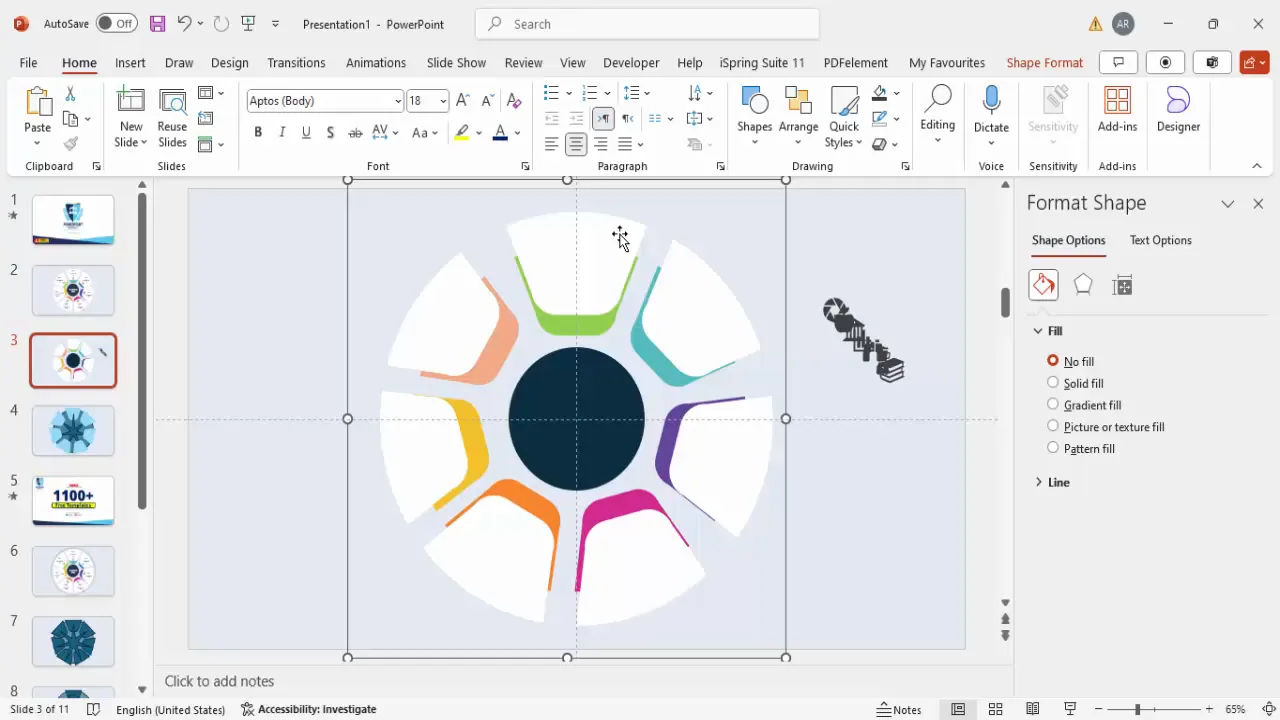
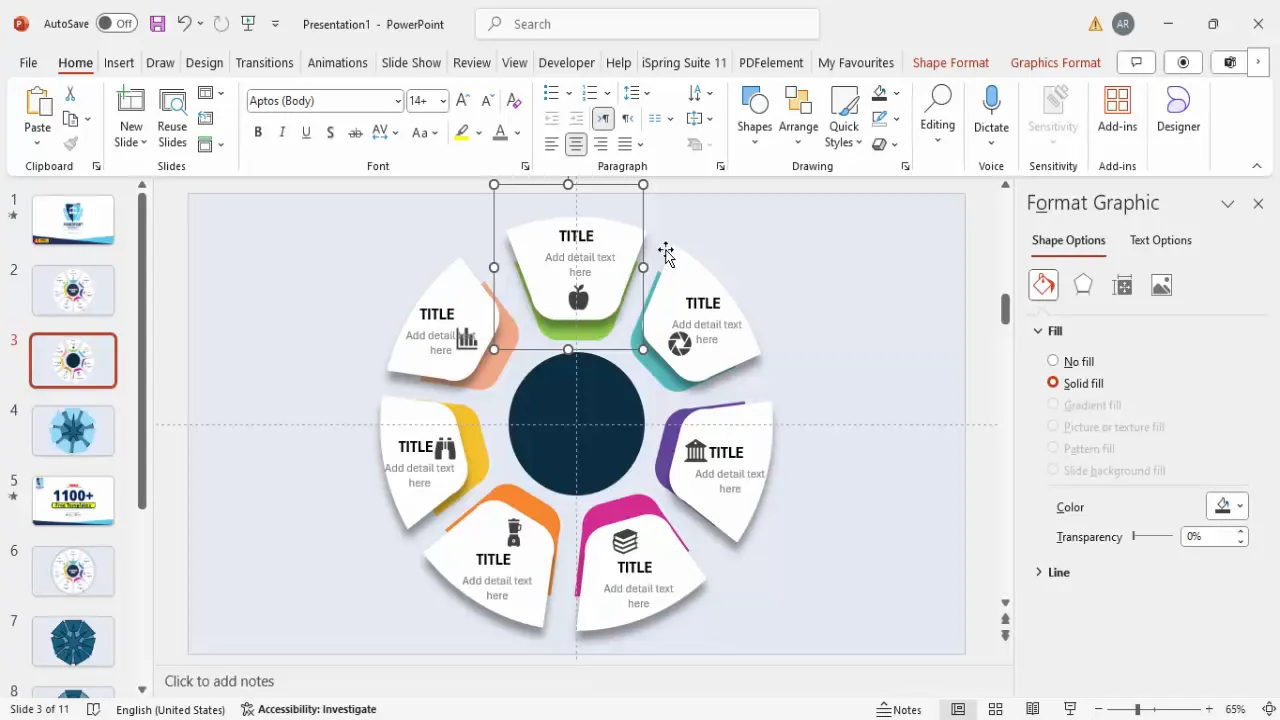
Inserting Icons and Adding Text Boxes
Icons and descriptive text help clarify each option’s purpose and add visual interest to your infographic.
Adding Icons
- Go to Insert > Icons and select seven icons that best represent your options.
- Insert the icons onto the slide and resize them to approximately 0.5 inches in height and width for consistency.
- Apply a uniform gray color to the icons for a professional look.
- Ungroup the icons if necessary to adjust individual elements.
- Add shadow effects to the white background shapes behind the icons by selecting Shape Format > Effects > Shadow and adjusting distance and blur for subtle emphasis.
- Position each icon centrally on top of the corresponding option segment.
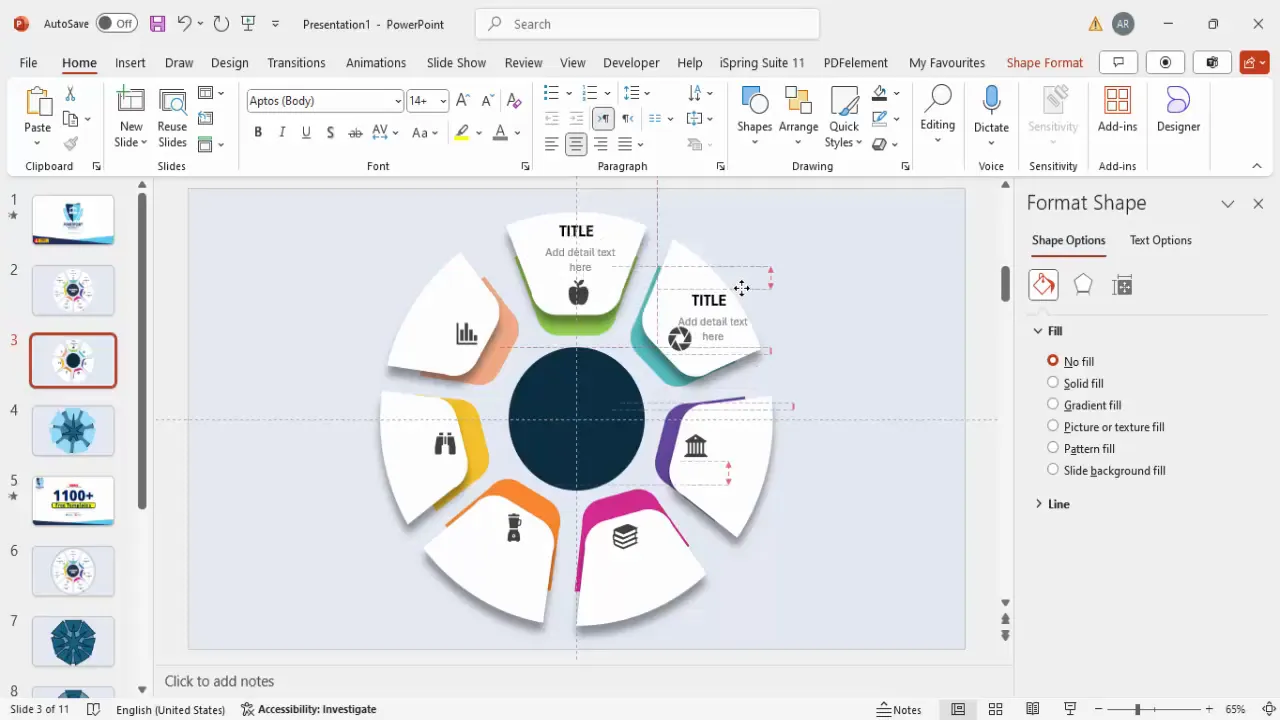
Adding Titles and Details
- Insert a text box above each option segment for the title.
- Center-align the text and set it to bold for emphasis.
- Insert another text box below the title for detailed description.
- Use a smaller font size (around 14 pt) and a gray font color to differentiate from the title.
- Duplicate these paired text boxes for each of the seven options using Ctrl + D.
- Adjust the text content to match the specific option details.
Clear, concise text paired with well-chosen icons enhances the audience’s comprehension and engagement.
Grouping Elements for Easy Editing
Grouping related elements simplifies editing and moving parts of your infographic without disturbing the overall layout.
- Select each option’s shapes, icons, and text boxes.
- Press Ctrl + G to group them as a single unit.
- Repeat for all seven options to create seven grouped units.
- Group the entire infographic by selecting all elements and grouping them to move or resize as a whole.
Grouping improves workflow efficiency and ensures consistent alignment when making adjustments.

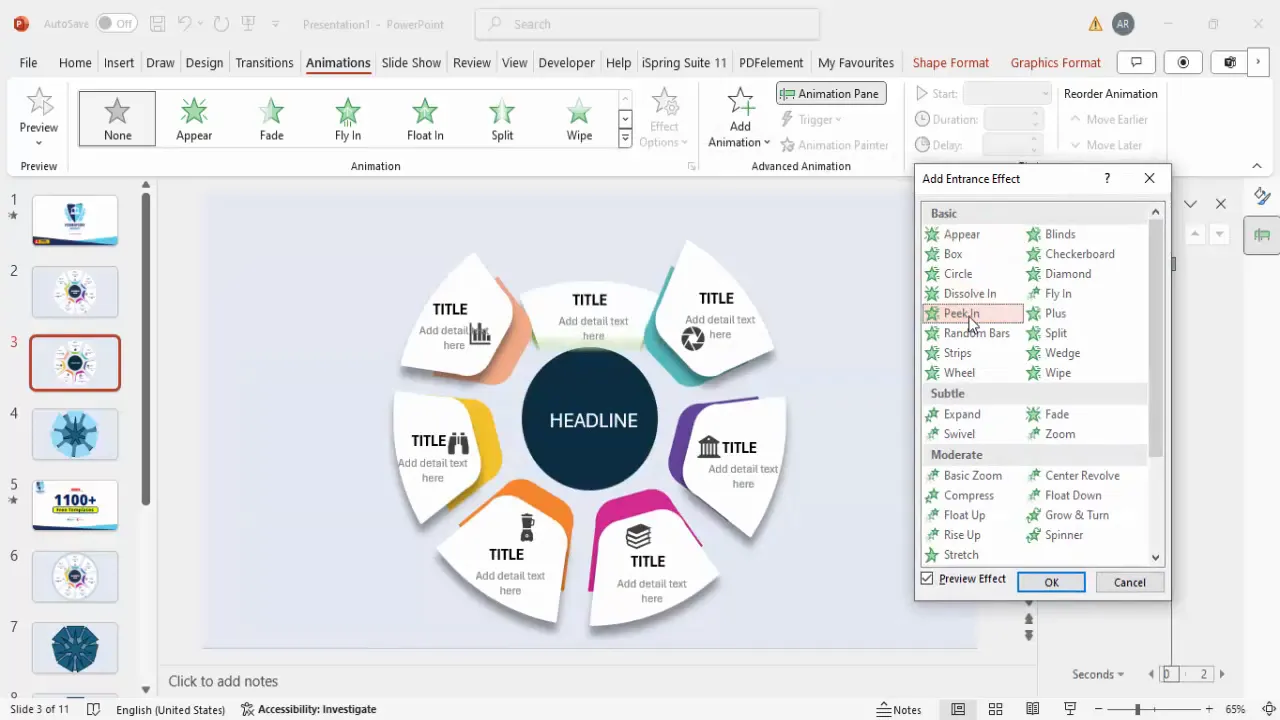
Applying Engaging Animations
Animations bring your infographic to life, guiding your audience’s attention and making your presentation more dynamic.
- Open the Animations tab and enable the Animation Pane.
- Select the first option group and add an entrance animation, such as Peek In or Basic Zoom.
- Use the Animation Painter tool to quickly apply the same animation to the other option groups.
- Customize the direction of animations for variety — for example, have some options animate from the left, others from the right or top.
- Preview the animations in sequence to make sure the flow looks smooth and professional.
Thoughtful animation timing and direction help maintain audience interest and emphasize each step in your infographic.
Final Tips and Best Practices for PowerPoint Slide Design
To ensure your PowerPoint infographic slide stands out and communicates effectively, keep these design principles in mind:
- Consistent Alignment: Use guides and alignment tools to keep all elements neatly positioned.
- Color Harmony: Choose a consistent color palette that reflects your brand or presentation theme.
- Minimal Text: Keep text concise and readable. Avoid overcrowding the slide with too much information.
- Icon Relevance: Select icons that clearly represent the content of each option to reinforce understanding.
- Balanced Animation: Use animations sparingly and purposefully to enhance, not distract from, your message.
- Backup Slides: Duplicate your slide before major changes to preserve versions and avoid losing work.
- Practice Presentation: Run through your slide show to check animations, transitions, and overall flow.
By following these best practices alongside the step-by-step guide, you’ll create a professional and engaging infographic slide that elevates your PowerPoint presentations.
Frequently Asked Questions
What is the best way to align shapes perfectly in PowerPoint?
Enabling guides and using the Align tools (Align Center, Align Middle) ensures shapes are precisely positioned. Holding the Shift key while resizing maintains proportions.
How can I make my infographic colors look professional?
Choose a consistent color palette with contrasting but complementary colors. Avoid using too many bright colors; instead, use colors that enhance readability and maintain aesthetic balance.
Can I reuse this 7-step infographic design for other presentations?
Absolutely! Group your completed infographic elements and save the slide as a template or duplicate it within your presentation to reuse and customize for different topics.
What types of animations work best for infographic slides?
Simple entrance animations like Peek In, Fade, or Basic Zoom work well to draw attention without overwhelming the audience. Vary the direction of animations for each option to keep it dynamic.
Where can I find free PowerPoint templates similar to this design?
POWERPOINT UNIVERSITY offers over 1000 free PowerPoint templates that you can download and customize. These templates are designed for easy editing and professional results.
How do I add icons to PowerPoint slides?
Use the Insert > Icons feature to browse and insert icons directly into your slides. Resize and recolor icons to fit your design.
Conclusion
Mastering PowerPoint slide design, especially for infographics, can dramatically enhance the impact of your presentations. This step-by-step tutorial guides you through creating a colorful, professional 7-step infographic slide that communicates your message clearly and beautifully. From setting up the slide background to designing shapes, adding icons, text, and animations, every step is designed to help you craft a compelling visual story.
Remember, clean alignment, consistent colors, and purposeful animations are key to engaging your audience. With practice and creativity, you’ll be able to produce slides that not only inform but also inspire.
Explore more free templates and tutorials from POWERPOINT UNIVERSITY to keep improving your PowerPoint skills and create presentations that leave a lasting impression.
Check out the full video: 7-Option Colorful Infographic Slide Design | PowerPoint Tutorial for Creative Presentations


