
PowerPoint slides are a powerful tool for visually communicating ideas, processes, and data. When it comes to creating engaging presentations, infographics play a crucial role by making complex information easier to understand and more appealing. In this guide, I will walk you through the process of creating a professional and dynamic slide featuring four circular infographic options in PowerPoint. This tutorial is perfect for anyone looking to elevate their presentation game with visually compelling and interactive infographic slides.
By following these detailed steps, you’ll learn how to design circular infographic elements, add icons and text, apply shadows and effects, and finally animate the components to create an engaging presentation slide. Whether you are preparing a business report, marketing strategy, or educational content, this infographic slide design will help you communicate your message clearly and effectively.
Table of Contents
- Preparing the Slide and Enabling Guides
- Creating and Customizing Circular Shapes
- Designing Infographic Segments with Merge Shapes
- Adding Oval Shapes and Arcs for Visual Interest
- Inserting Icons and Adding Descriptive Text
- Grouping and Aligning Elements for Consistency
- Applying Animations for Dynamic Presentation
- Conclusion
- Frequently Asked Questions (FAQ)
Preparing the Slide and Enabling Guides
Before jumping into creating the infographic elements, it’s essential to set up your PowerPoint slide properly. This preparation ensures precision and alignment when designing your infographic components.
- Add a New Slide: Start with a clean slide where you will build your infographic.
- Enable Guides: Go to the View tab and enable guides. These visual aids help you align shapes and objects accurately in the center and other key positions.
Enabling guides is a foundational step that provides reference lines, making it easier to position your infographic elements symmetrically and professionally.
Creating and Customizing Circular Shapes
The core of this infographic design relies on circular shapes. Here’s how to create and customize them:
- Insert a Hollow Circle: From the Insert tab, select Shapes and choose the Circle Hollow from the basic shapes. Click on the slide to add it.
- Set Size and Position: Go to Shape Format and set the height and width to 4.85 inches. Use the Align tools to center the shape both horizontally and vertically on the slide.
- Adjust Width: Reduce the width of the oval shape to create an appealing shape for your infographic. This customization tailors the shape to your design needs.
- Remove Outline: Set the shape outline to No Outline for a clean look.
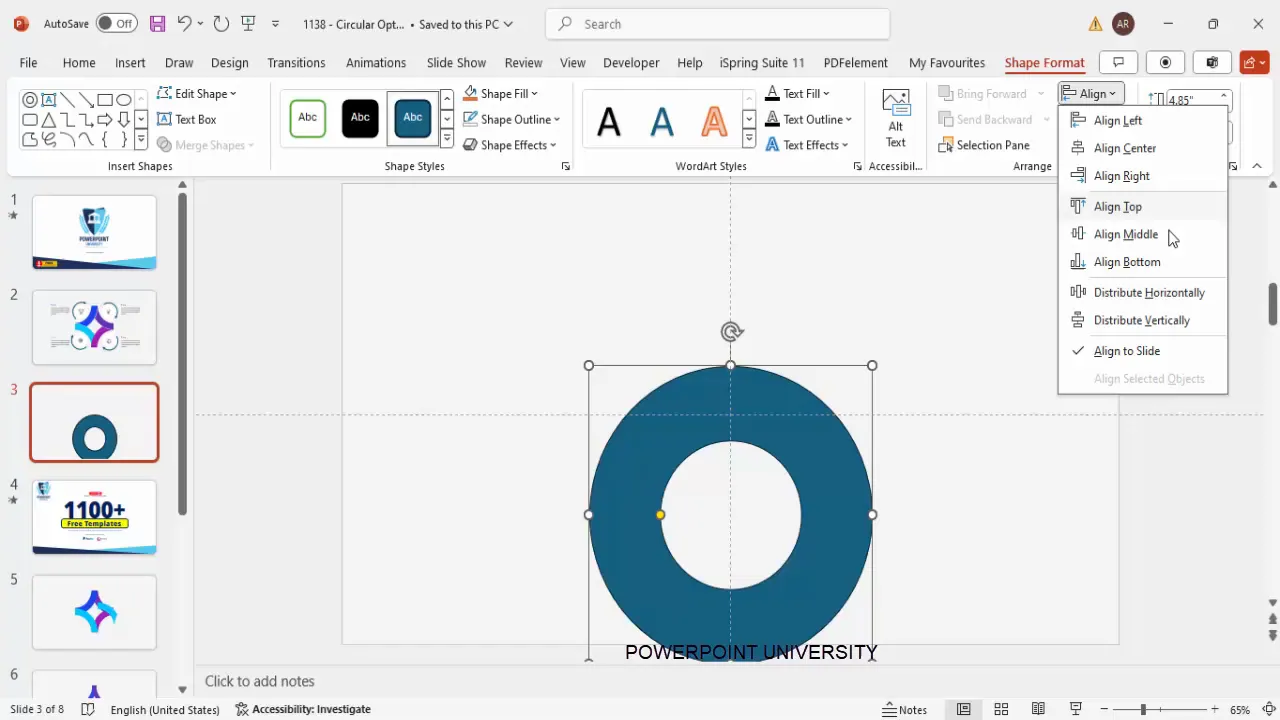
This hollow circle will form the base of your infographic segments. The size and alignment are crucial for a balanced and professional appearance.
Designing Infographic Segments with Merge Shapes
To create the four distinct circular infographic options, you need to divide the hollow circle into segments. Follow these steps:
- Insert a Rectangle Shape: Draw a rectangle over one quarter of the hollow circle.
- Intersect Shapes: Select the hollow circle first, then hold the Shift key and select the rectangle. Use Merge Shapes > Intersect to keep only the overlapping part.
- Duplicate and Color Segments: Press Ctrl + D to duplicate the segment and change the fill color for each duplicated segment. Rotate and flip each segment to position them accurately to form a complete circle divided into four distinct parts.
- Optional Subtractions: You can subtract parts of the shapes to create a more customized look by selecting two shapes and using Merge Shapes > Subtract.
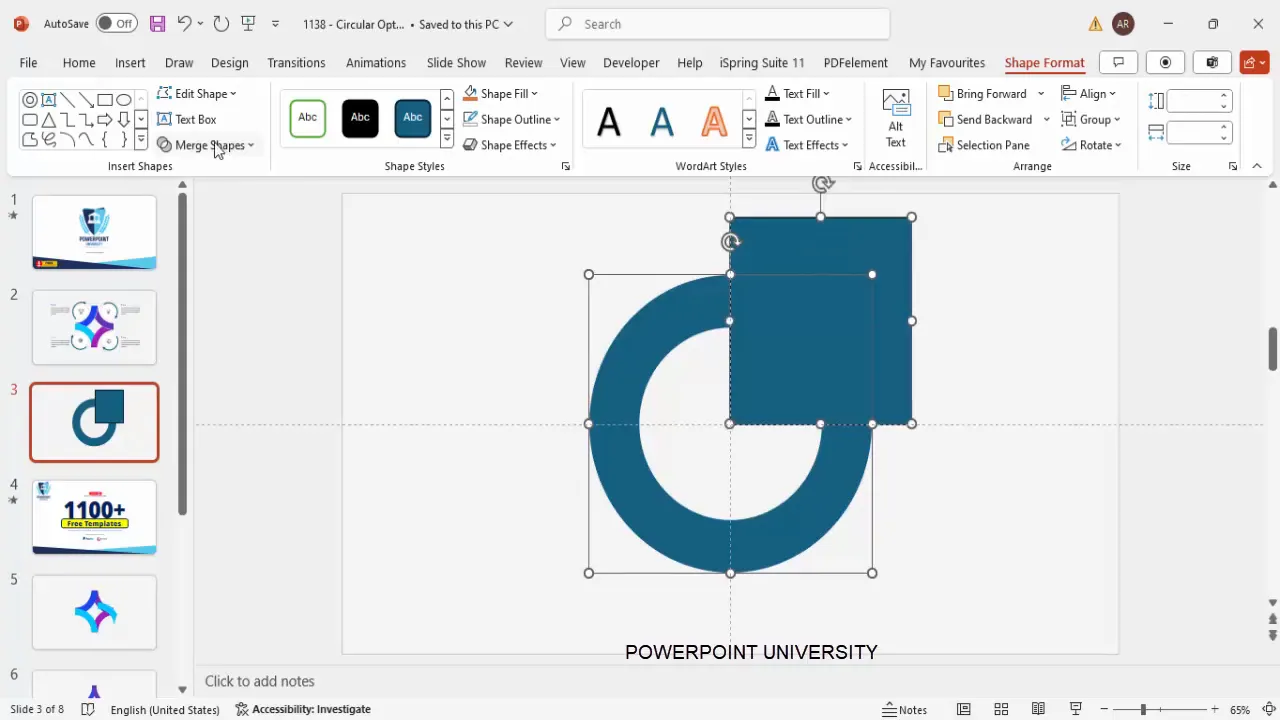
Using the Merge Shapes feature allows you to create clean, precise segments for your infographic. This method is flexible and lets you customize the shapes to fit your presentation style.
Adding Oval Shapes and Arcs for Visual Interest
To enhance the infographic’s design, you can add oval shapes and arcs with arrowheads that emphasize flow or direction. Here’s how:
- Insert Oval Shapes: From Insert > Shapes, select the oval shape and draw it on your slide. Resize it by holding Ctrl + Shift to maintain proportions.
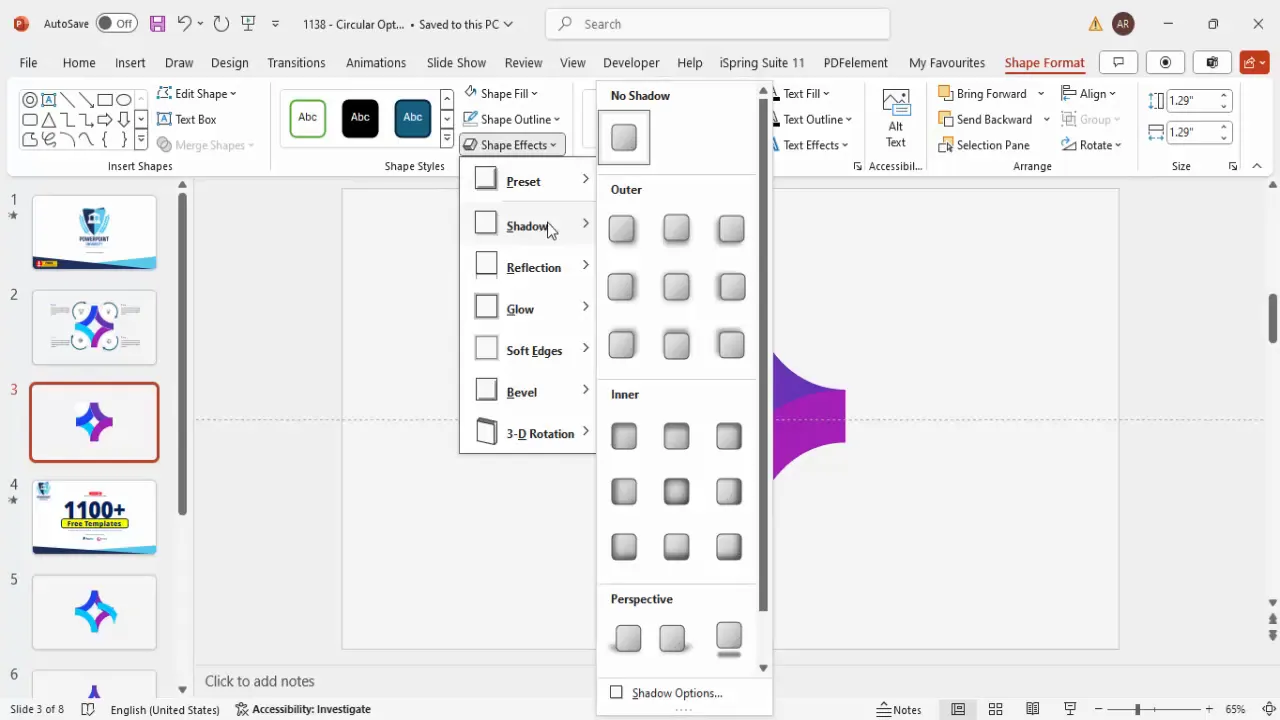
- Remove Outline and Add Shadow: Set the oval’s outline to No Outline. Then, apply shadow effects by going to Shape Effects > Shadow. Adjust the shadow size and direction for subtle depth.
- Draw Arcs: Insert an arc shape, hold Shift while drawing to keep the curve smooth. Resize and rotate the arc as needed.
- Add Arrowheads: Select the arc line, go to Shape Format > Shape Outline > Arrows, and choose an arrowhead style. Adjust line width to make the arrowhead visible.
- Duplicate and Rotate: Duplicate the oval and arc combination to create multiple directional elements around your infographic. Rotate them accordingly to point in different directions.
These additional shapes add visual dynamics and can help guide your audience’s attention through the infographic’s key points.
Inserting Icons and Adding Descriptive Text
Icons and text are crucial for conveying the meaning of each infographic segment. Here’s how to insert them:
- Insert Icons: Use PowerPoint’s built-in icon library by going to Insert > Icons. Select icons that relate to your presentation topic. Alternatively, you can download icons from free resources like Flaticon.
- Resize and Position Icons: Set the height and width of the icons to 0.5 inches for uniformity. Position each icon on top of the corresponding infographic segment.
- Add Title Text: Insert a text box and add a bold title for each infographic option. This draws attention and summarizes the segment’s focus.
- Add Detailed Text: Insert another text box for detailed descriptions. Use smaller font size (around 12 pt) and a gray color to differentiate it from the title. Align the text left for readability.
- Group Elements: Select the icon, title, and description text, then press Ctrl + G to group them. This makes it easier to move and animate each infographic segment as a unit.
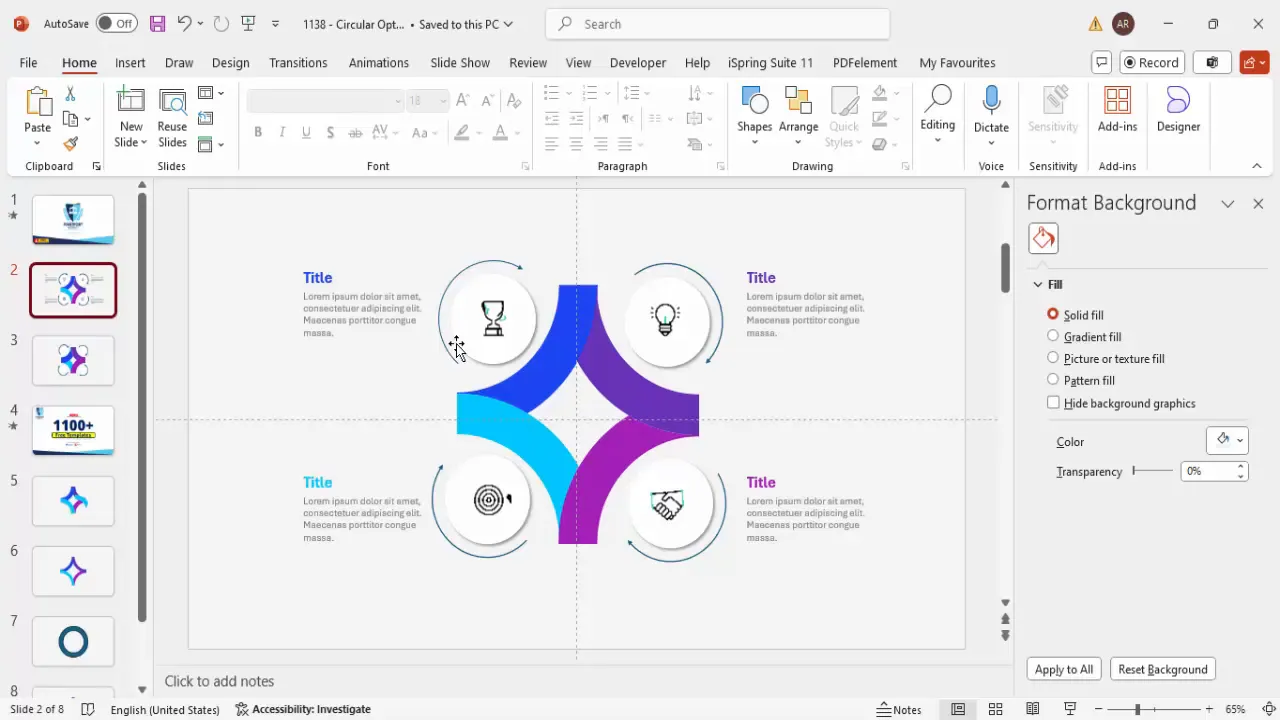
Clear iconography combined with concise text enhances understanding and keeps your audience engaged.
Grouping and Aligning Elements for Consistency
Maintaining consistent alignment and grouping is essential for a polished look. Here are some tips:
- Group Related Shapes: Group the infographic segment shape, icon, and text together. Also, group the directional arrows with their respective segments.
- Use Alignment Tools: Use Align Center and Align Middle to ensure that all grouped elements are perfectly centered on their infographic segment.
- Duplicate Groups for Uniformity: Duplicate grouped elements to create other infographic options quickly while maintaining consistent sizing and positioning.
Grouping and alignment not only save time but also ensure your slide looks cohesive and professional.
Applying Animations for Dynamic Presentation
Animations can bring your infographic slide to life, making it more engaging and easier to follow. Follow these animation steps:
- Group for Animation: Ensure each infographic segment (shape, icon, text, and arrow) is grouped. This allows you to apply animations to the entire segment.
- Open Animation Pane: Go to the Animations tab and open the Animation Pane to manage and sequence your animations.
- Apply Entrance Effects: Select the first infographic segment and add an entrance animation. I recommend the Basic Zoom effect for a smooth and modern appearance.
- Sequence Animations: For subsequent segments, set animations to start After Previous to create a seamless flow as you click through the slide.
- Animate Text: Apply directional entrance effects to the title and detailed text. For example, use Stretch from Right for the title and Stretch from Left for the description to add movement.
- Use Animation Painter: Use the Animation Painter tool to copy animation settings from one segment to others, saving time and ensuring consistency.
- Consider Wipe Effects: For added meaning, you can replace some animations with Wipe effects, setting the direction (e.g., from top) to match the flow of your infographic.
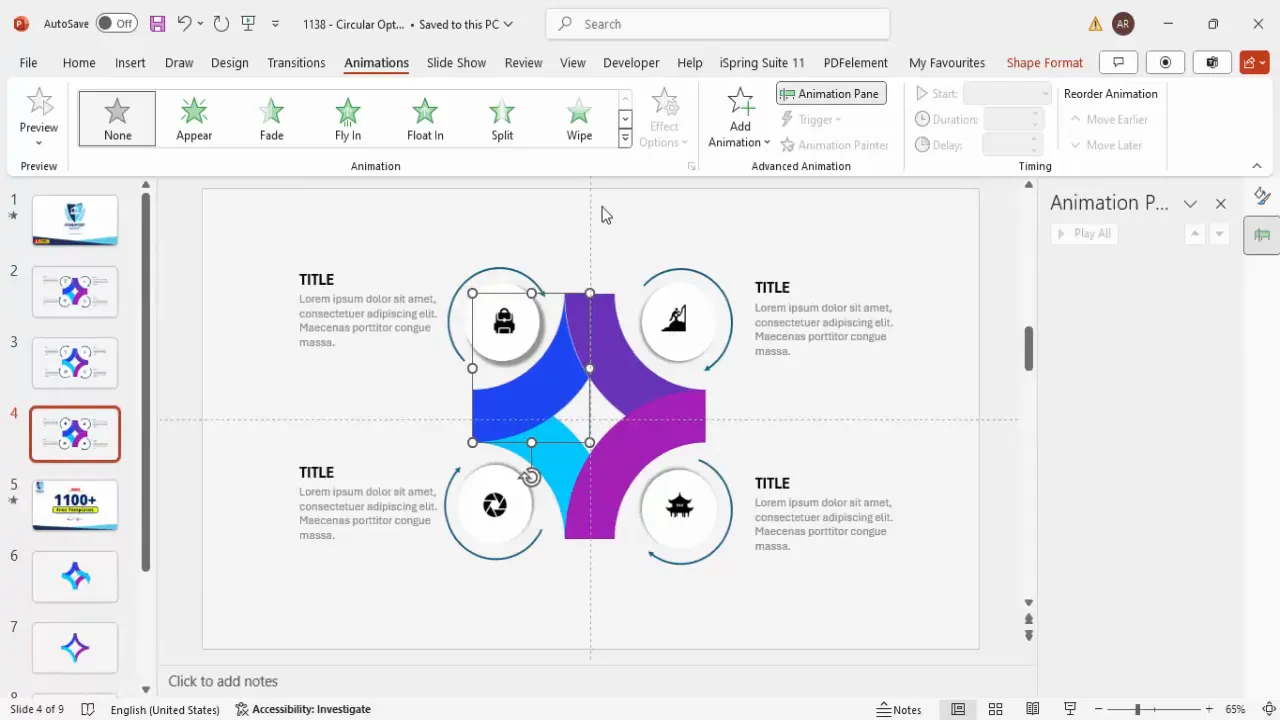
Animations not only enhance visual appeal but also help guide your audience’s attention sequentially through your infographic points.

Conclusion
Creating a visually dynamic and informative circular infographic slide in PowerPoint is a straightforward process once you understand the key steps. From designing and segmenting circular shapes, adding icons and text, to applying animations, each element contributes to a slide that communicates effectively and captivates your audience.
Infographics are essential for simplifying complex ideas, and mastering these PowerPoint slides techniques can significantly improve the impact of your presentations. Remember to use grouping and alignment tools for a polished look and to apply meaningful animations that enhance storytelling without overwhelming your viewers.
With practice, you can customize the number of infographic segments, colors, and icons to fit any presentation need. This flexibility makes circular infographic slides a versatile addition to your PowerPoint toolkit.
Frequently Asked Questions (FAQ)
1. Can I create more than four circular infographic options using this method?
Absolutely. The steps outlined here can be adapted to create any number of circular segments by adjusting the size and rotation of the shapes. Just ensure consistent spacing and alignment for a clean design.
2. Where can I find free icons to use in my PowerPoint slides?
You can use PowerPoint’s built-in icons by going to Insert > Icons. Additionally, websites like Flaticon offer numerous free icons suitable for presentations.
3. How do I ensure my animations don’t distract the audience?
Keep animations simple and purposeful. Use entrance effects like zoom or wipe to emphasize key points, and sequence them logically so the audience can follow along without feeling overwhelmed.
4. Can I customize the colors and fonts used in the infographic slide?
Yes, all colors, fonts, and sizes can be customized to match your brand or presentation theme. Use PowerPoint’s Shape Fill and Font options to make these adjustments easily.
5. Is it necessary to group elements before animating?
Grouping elements like shapes, icons, and text before applying animations helps keep them together, making it easier to animate the entire segment as a single unit and maintain consistent timing.
6. How can I make sure my infographic elements are perfectly aligned?
Use PowerPoint’s Align tools found under the Shape Format tab, and enable guides under the View tab to help position elements precisely.
7. Can I use this infographic design for different presentation topics?
Yes, the circular infographic slide is versatile and can be adapted for various topics such as business strategies, project timelines, process flows, and educational content.
8. How do I save and reuse this infographic slide?
Once you create your infographic slide, you can save it as a template or copy it into other presentations. Use File > Save As and choose PowerPoint Template (*.potx) to save for future use.
9. What if I want to add more detailed text without cluttering the slide?
Keep text concise on the slide and use speaker notes or supplementary handouts for detailed explanations. Alternatively, consider breaking the infographic into multiple slides if necessary.
10. Are there any free resources for PowerPoint templates and tutorials?
Yes, plenty of online resources offer free templates and tutorials. For example, POWERPOINT UNIVERSITY provides over a thousand free templates and helpful tutorials to enhance your PowerPoint skills.
Check out the full video: Create 4 Circular Infographic Slide in PowerPoint


