
If you’re looking to enhance your PowerPoint Slides Design skills with a creative and functional infographic, the fishbone diagram, also known as a cause and effect diagram, is a fantastic tool to add to your presentation arsenal. This article will guide you step-by-step on how to build a visually appealing and interactive fishbone diagram directly in PowerPoint, making your presentations not only professional but also engaging for your audience.
Throughout this guide, you’ll learn how to use basic PowerPoint tools such as icons, shapes, lines, text boxes, and animations to create a customized cause and effect diagram. This approach will help you effectively illustrate problems and their potential causes in a clear, structured format.
Let’s dive into the process of creating a fishbone diagram that floats and swims right on your slide, complete with dynamic water effects and detailed annotations. Whether you are a business professional, educator, or student, this tutorial will elevate your PowerPoint Slides Design skills to the next level.
Table of Contents
- Introduction to Fishbone Diagram
- Step 1: Adding the Fish Icon
- Step 2: Creating the Fish Bones (Cause Lines)
- Step 3: Adding Arrows and Teeth for Visual Appeal
- Step 4: Labeling Options with Text
- Step 5: Enhancing with Water Effects and Animation
- Step 6: Animating the Fish and Water
- Tips for Effective PowerPoint Slides Design
- Frequently Asked Questions (FAQ)
- Conclusion
Introduction to Fishbone Diagram
The fishbone diagram is a popular tool used in problem-solving and quality management, helping teams visually map out the causes of a specific problem or effect. It is called a fishbone diagram because its structure resembles the skeleton of a fish, with a central “spine” and several “bones” branching out representing different causes.
In PowerPoint, creating this diagram not only aids in clear communication but also adds a dynamic visual element to your presentation. By customizing the diagram with colors, shapes, and animations, you can make your slides more engaging and easier for your audience to understand.
This tutorial will walk you through the process of building a fishbone diagram in PowerPoint, from selecting the fish icon to animating the entire diagram for maximum impact.
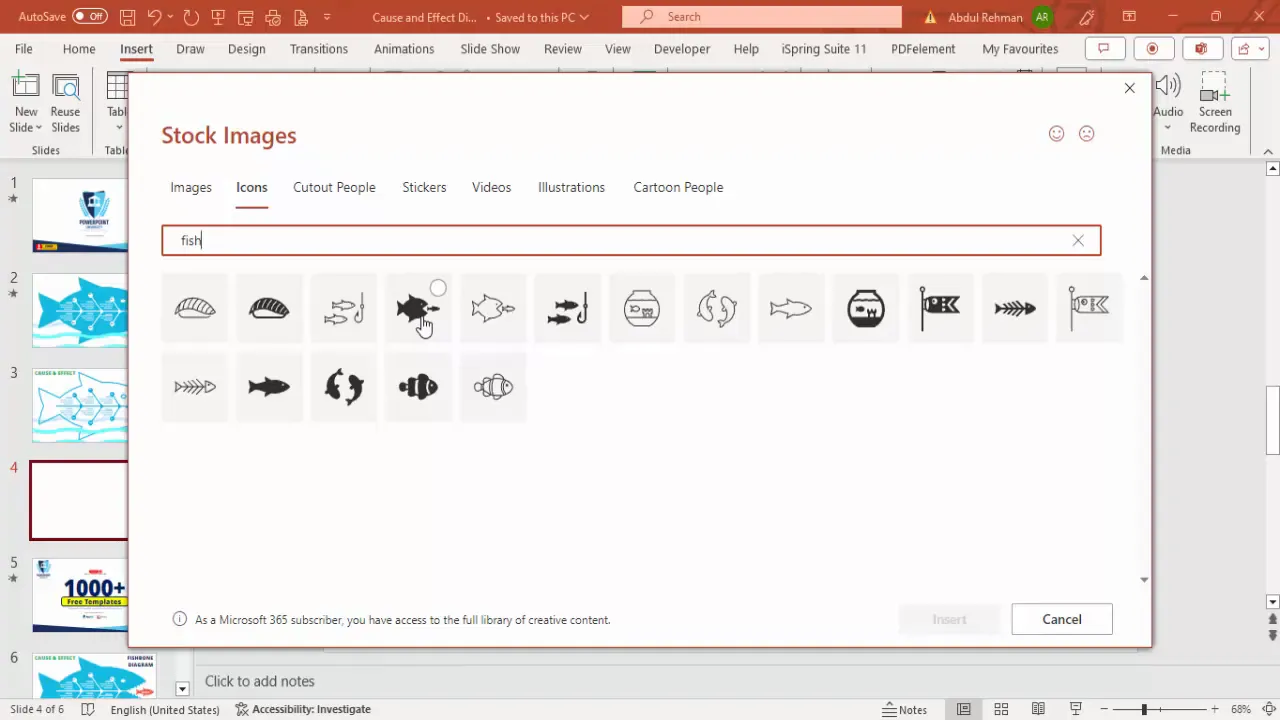
Step 1: Adding the Fish Icon
Begin by adding the fish shape that will form the backbone of your diagram. Instead of drawing the fish manually, PowerPoint’s icon library offers a convenient way to insert a professionally designed fish icon.
- Open a new slide in your PowerPoint presentation.
- Go to the Insert tab on the ribbon and select Icons.
- In the search bar of the icon window, type fish.
- Choose a fish icon that fits your style. For example, you might pick a simple fish silhouette or one with more detail.
- Click Insert to add the icon to your slide.
- Hold the Shift key while resizing the fish to maintain its proportions and adjust it to fill the slide appropriately without going beyond the slide’s edges.
- Right-click the icon and select Group then Ungroup. When prompted, click Yes to convert the icon into editable shapes.
- Resize the ungrouped shapes again if needed to refine the fish’s appearance.
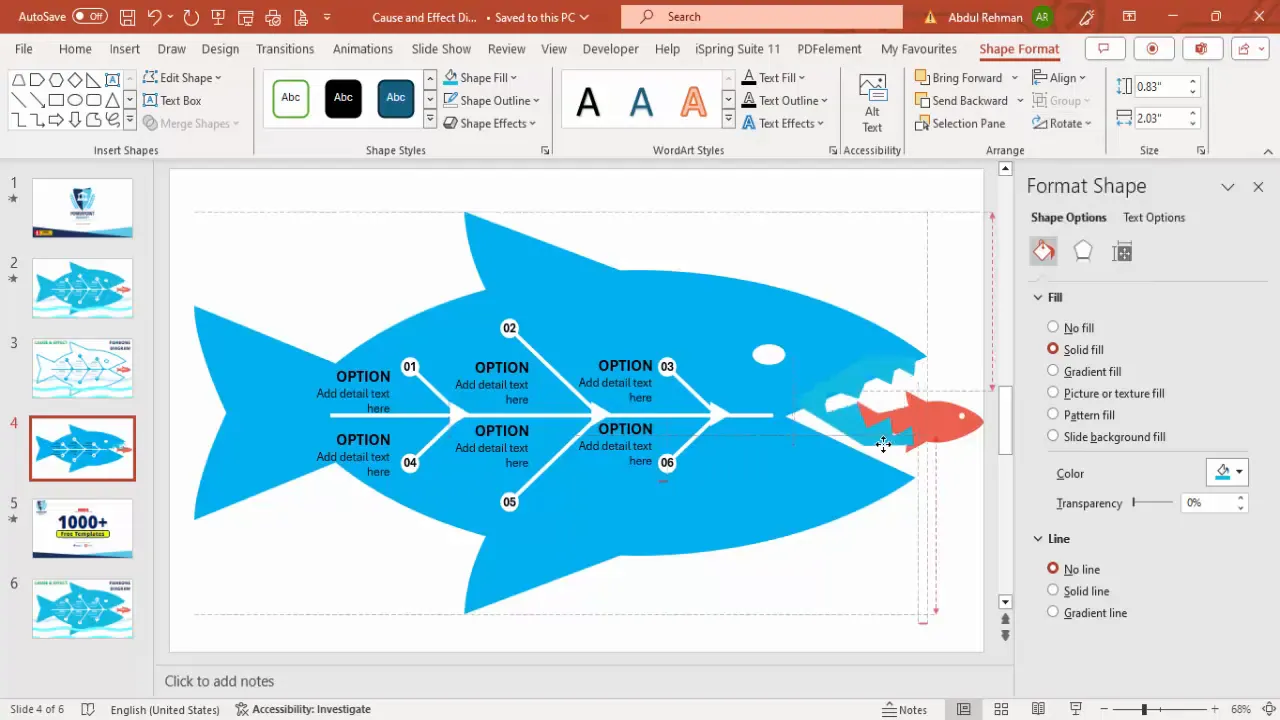
- Color the fish body with a blue shade and the head or effect part with a red shade to differentiate the effect from the causes.
This method provides flexibility to customize the fish’s parts and prepares it for the next step, adding the fish bones that represent causes.
Step 2: Creating the Fish Bones (Cause Lines)
The fish bones represent the causes contributing to the main effect, which is the fish’s head. Here’s how to add these lines:
- Go to Insert > Shapes and select the Line tool.
- Hold the Shift key to draw perfectly horizontal or vertical straight lines.
- Draw a main horizontal line along the fish’s body to represent the spine.
- Next, draw diagonal lines extending from the spine to form the fish bones. These should angle towards the head of the fish.
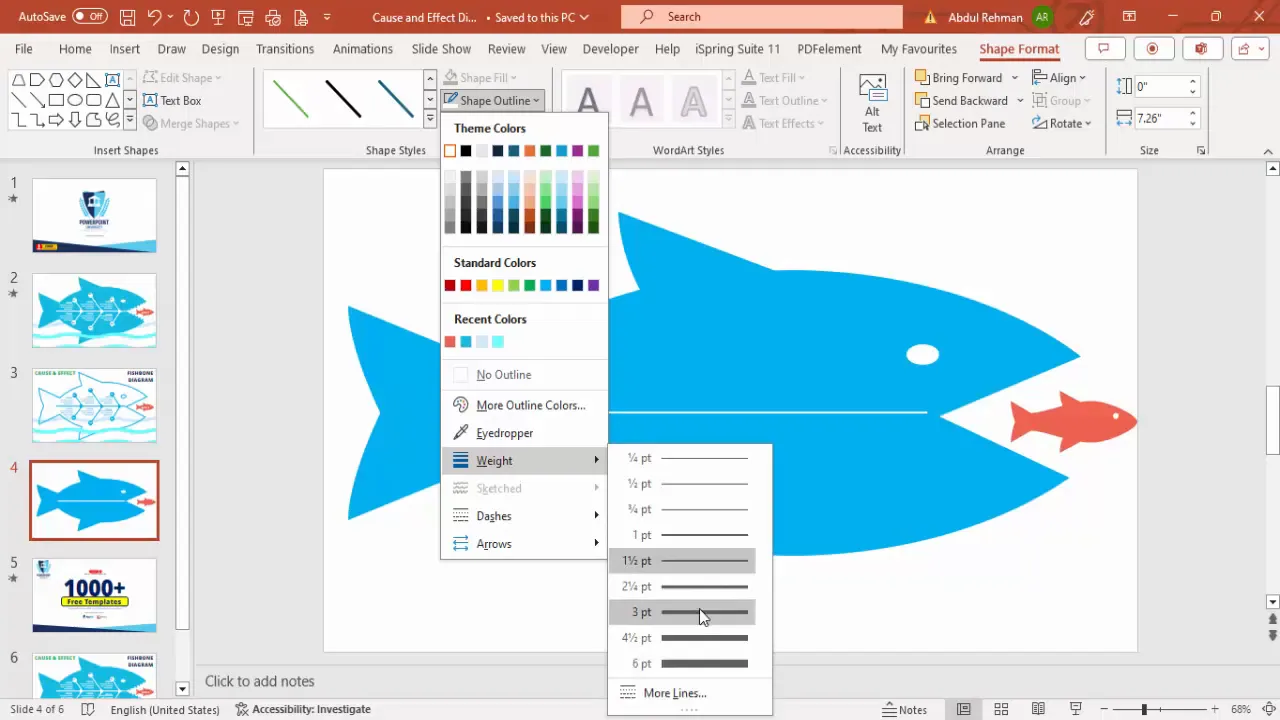
- Change the color of these lines to white or a light color that contrasts with the fish body.
- Increase the line weight to make them more visible, typically around 4 to 4.5 points.
- Group the lines together using Ctrl + G for easier manipulation.
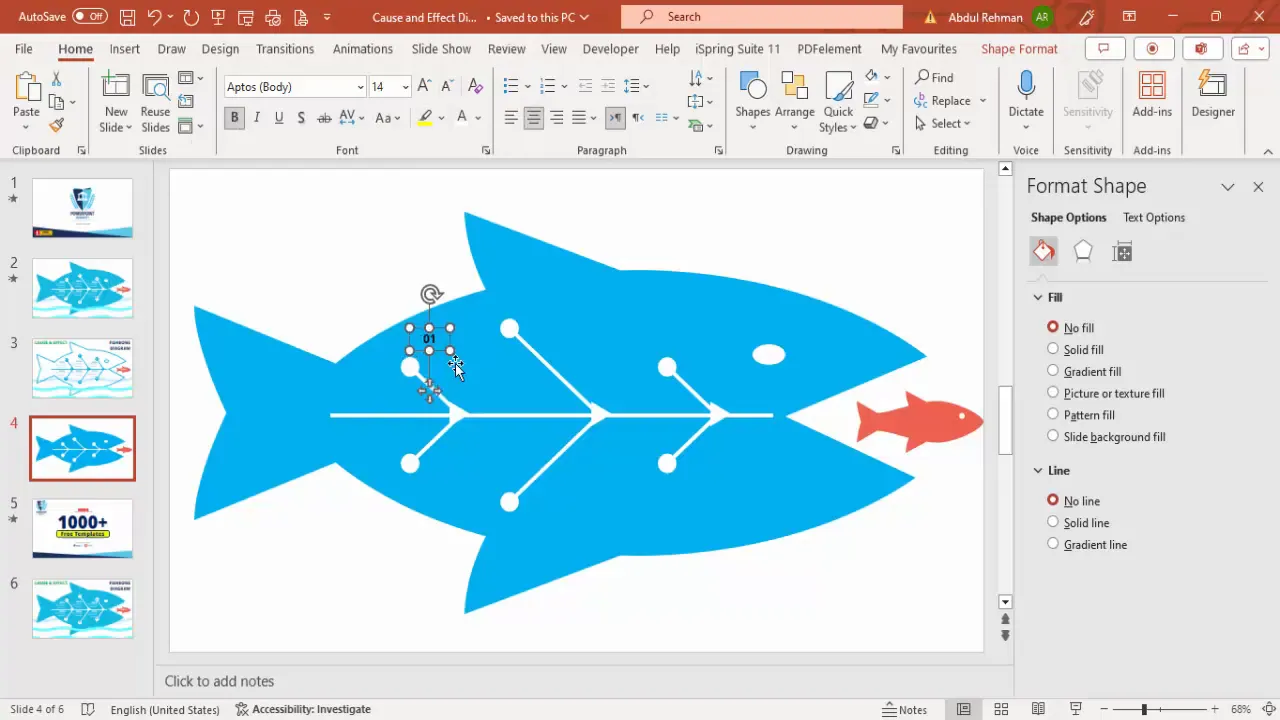
- Duplicate the lines and flip them vertically to create the upper and lower bones, positioning them symmetrically on the fish.
- Adjust spacing between the bones evenly for a balanced look.
To add clarity, you can also insert arrowheads at the end of each fish bone:
- Select a line, right-click, and choose Format Shape.
- Under Line options, set the End Arrow Type to a suitable arrow such as an oval or triangle.
- Adjust the size of the arrowhead for visibility.
This setup visually guides the audience’s eye from causes to the main effect, enhancing comprehension.
Step 3: Adding Arrows and Teeth for Visual Appeal
To make the fishbone diagram more engaging and fun, you can add details such as teeth along the fish’s mouth and small triangles to emphasize the arrows:
- Select Insert > Shapes and choose the Triangle shape.
- Draw a small triangle while holding Shift to keep it proportional.
- Remove the outline and fill the triangle with white or another contrasting color.
- Rotate the triangle 90 degrees to align it properly as a tooth.
- Duplicate the triangles and place them evenly along the fish’s mouth area.
- For teeth on both sides, duplicate the group and flip it vertically.
- Group all teeth shapes and send them to the back behind the fish body for a layered effect.
These small design elements add personality to your diagram, making it visually appealing and less monotonous.
Step 4: Labeling Options with Text
Labeling is essential to communicate the causes and effect clearly. Here’s how to effectively add and align text labels:
- Insert a Text Box near each fish bone to label the cause category (e.g., Option 1, Option 2, etc.).
- Type the label and format it with bold text for emphasis.
- Place the text inside circles or near the bones for a neat look.
- Duplicate the text boxes as needed to maintain consistent formatting across all labels.
- Add a smaller text box below each label to provide detailed descriptions of each cause.
- Adjust font size (around 12 pt) and alignment for readability.
- Group the label and description text boxes together for easy positioning.
- Repeat for all the fish bones, numbering or naming the causes sequentially.
With clear labeling, your audience can easily understand each cause’s contribution to the effect, improving the diagram’s educational value.
Step 5: Enhancing with Water Effects and Animation
To make your fishbone diagram stand out, adding water effects and animations can create a lively and interactive feel:

- Go to Insert > Icons and search for water.
- Select a water icon or shape that looks like waves or ripples.
- Insert the water icon and ungroup it to isolate the parts you want to use.
- Group the desired parts together and resize to cover the slide background or a section beneath the fish.
- Change the water shape’s color to a light or medium blue to create contrast with the fish.
- Duplicate and position multiple water shapes to fill the background.
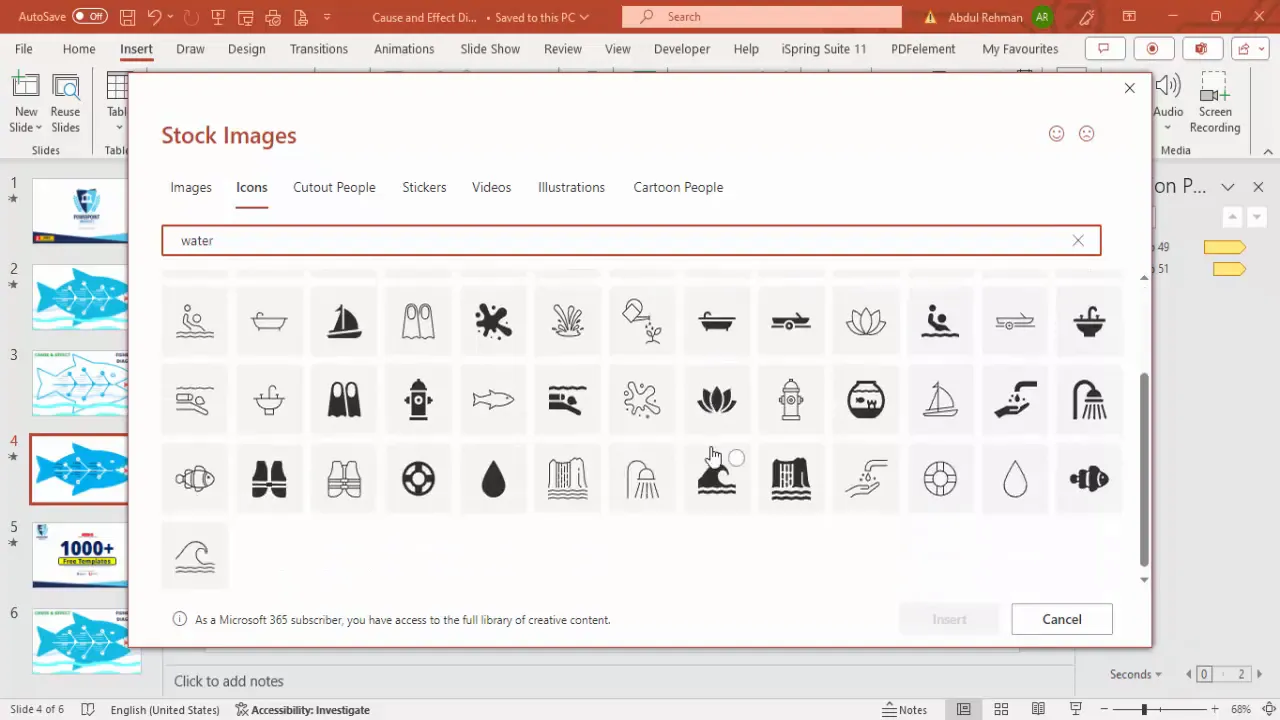
These water elements simulate the fish swimming environment, adding thematic cohesion and visual interest.
Step 6: Animating the Fish and Water
Animation brings your diagram to life and holds your audience’s attention. Here’s how to animate the fish and water:
- Select the fish shape or group representing the effect fish and go to the Animations tab.
- Add an Emphasis animation such as Teeter to simulate floating or swimming movement.
- Open the Animation Pane to adjust timing settings.
- Set the animation to run slowly and repeat until the end of the slide for continuous motion.
- Group the fish body and labels to apply the animation uniformly.
- Use the Animation Painter to copy the animation effect to smaller fish or related elements.
- For water shapes, apply Custom Path animations to move the water shapes horizontally or in a wave-like pattern.
- Remove smooth start and end to create a steady motion and set the animation to repeat indefinitely.
- Adjust the direction and speed of water animations to complement the fish’s movement.
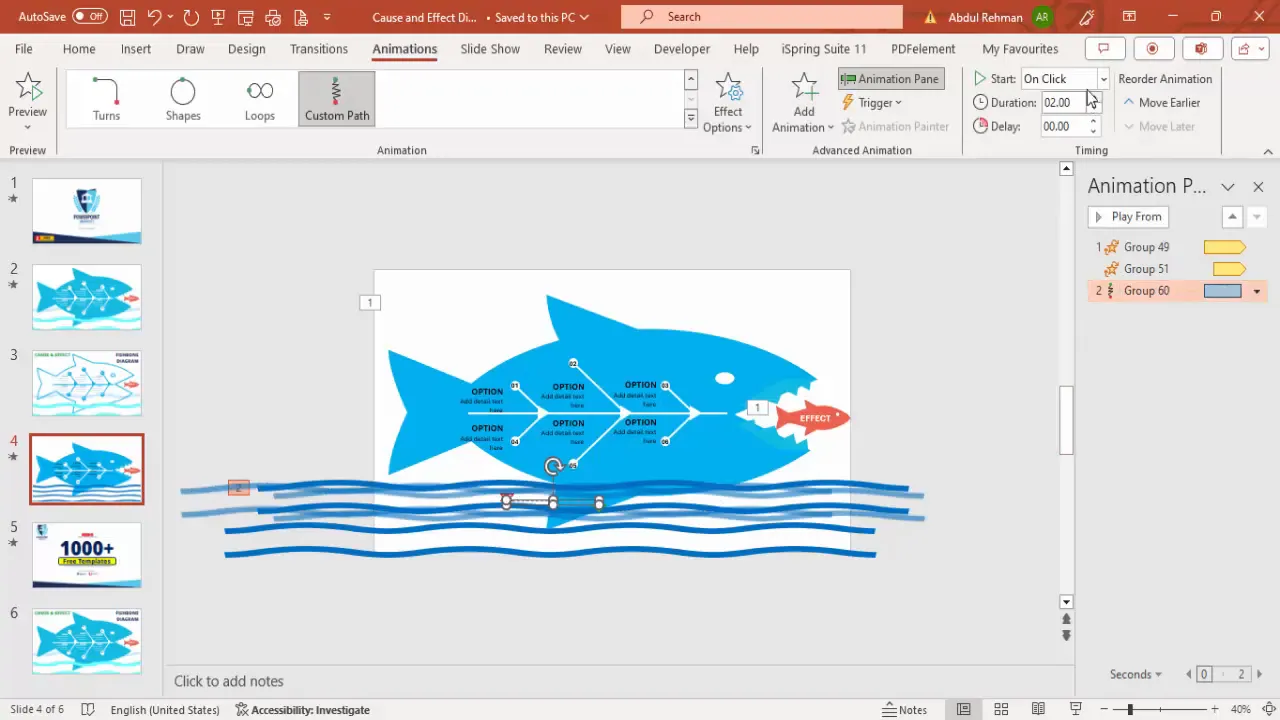
These animations simulate an underwater environment, making your fishbone diagram more immersive and engaging.
Tips for Effective PowerPoint Slides Design
Creating a fishbone diagram is a great exercise in PowerPoint Slides Design, but to elevate your entire presentation, consider these additional tips:
- Keep it Simple: Avoid clutter by limiting text and using clear, concise labels.
- Use Consistent Colors: Choose a color palette that aligns with your brand or presentation theme.
- Align Elements Precisely: Use PowerPoint’s alignment guides to ensure a neat layout.
- Leverage Grouping: Group related shapes and text to move and animate them together easily.
- Test Animations: Preview animations to ensure smooth transitions and appropriate pacing.
- Use Templates: Download free PowerPoint templates to jumpstart your design process.
- Plan Your Story: Use the diagram to support your narrative clearly and logically.
Implementing these tips will ensure your PowerPoint Slides Design is both professional and compelling.
Frequently Asked Questions (FAQ)
What is a fishbone diagram used for?
A fishbone diagram is used to visually map out the causes of a specific problem or effect. It helps in identifying root causes in quality management, project planning, and brainstorming sessions.
Can I create a fishbone diagram in PowerPoint without drawing?
Yes! PowerPoint’s icon library and shapes allow you to insert pre-made fish icons and lines, which you can customize and group to form a fishbone diagram without manually drawing.
How can I make my fishbone diagram more engaging?
Adding colors, shapes like teeth and arrows, and animations such as floating fish and moving water effects can make your diagram visually appealing and interactive, keeping your audience engaged.
Is it possible to customize the number of causes in the fishbone diagram?
Absolutely! You can increase or decrease the number of fish bones (cause lines) based on your requirements by duplicating or deleting lines and adjusting labels accordingly.
Where can I find free PowerPoint templates to enhance my slides?
There are many online resources offering free PowerPoint templates. Some channels and websites provide over a thousand free templates designed for various purposes, including fishbone diagrams.
Conclusion
Mastering PowerPoint Slides Design with creative infographics like the fishbone diagram adds a powerful visual tool to your presentation toolkit. By following the steps outlined in this guide, you can create a detailed, engaging, and animated fishbone diagram that clearly communicates cause-and-effect relationships.
From inserting and customizing fish icons, drawing and styling fish bones, to adding interactive water effects and animations, this approach helps you craft presentations that are both informative and visually captivating. Remember, the key to effective PowerPoint Slides Design lies in clarity, consistency, and creativity.
Start experimenting with these techniques today and watch your presentations swim right into the hearts and minds of your audience!
Check out the full video: easy way to create a fishbone diagram in PowerPoint


