
If you’re looking to create engaging, visually appealing, and animated infographics in PowerPoint, you’ve come to the right place. Whether you want to compare products, services, or any other elements side by side, this tutorial will guide you through the entire process. You’ll learn how to design a modern slide layout, add beautiful shapes and labels, and apply smooth animations that bring your infographic to life.
This article is based on a detailed step-by-step tutorial by One Skill PPT, who expertly demonstrates how to build an animated infographic slide from scratch using PowerPoint’s powerful tools. Plus, you’ll discover useful tips, shortcuts, and free resources that will enhance your PowerPoint skills.
Table of Contents
- Getting Started: Setting Up Your Slide
- Designing the Infographic: Shapes, Labels, and Layout
- Adding Animations: Motion Paths and Wipe Effects
- Advanced Tips: Grouping, Alignment, and Productivity Shortcuts
- Frequently Asked Questions
- Conclusion
Getting Started: Setting Up Your Slide
Before diving into the design and animation, it’s essential to start with a solid foundation. The tutorial begins by inserting a new slide and setting up a clean, professional layout that supports the infographic elements.
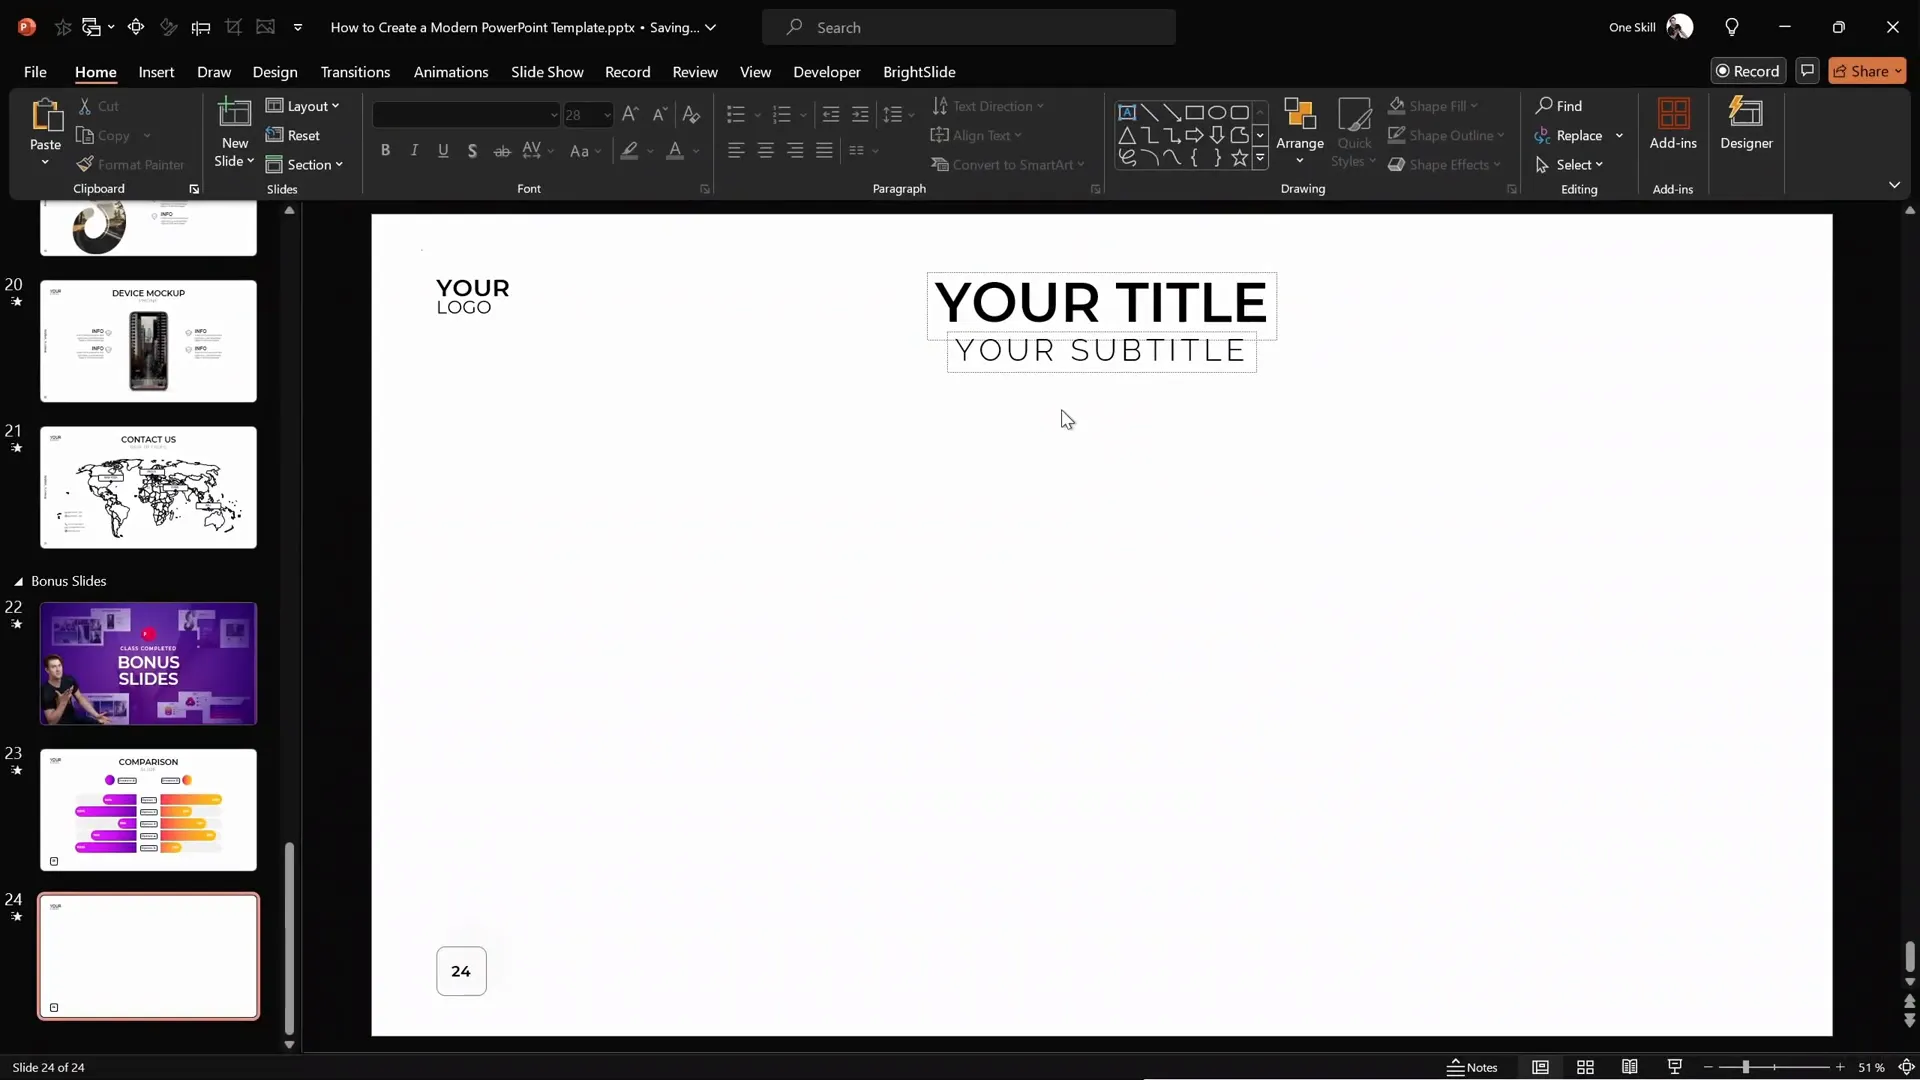
1. Insert a New Slide with a Custom Layout
Navigate to the bottom of your slide list, press Enter to add a new slide. This slide comes with title and subtitle placeholders, a spot for your logo, and a custom slide number. This professional setup is possible because the creator used a slide layout in the Slide Master view, which you can learn to create in their free PowerPoint Masterclass on Skillshare.
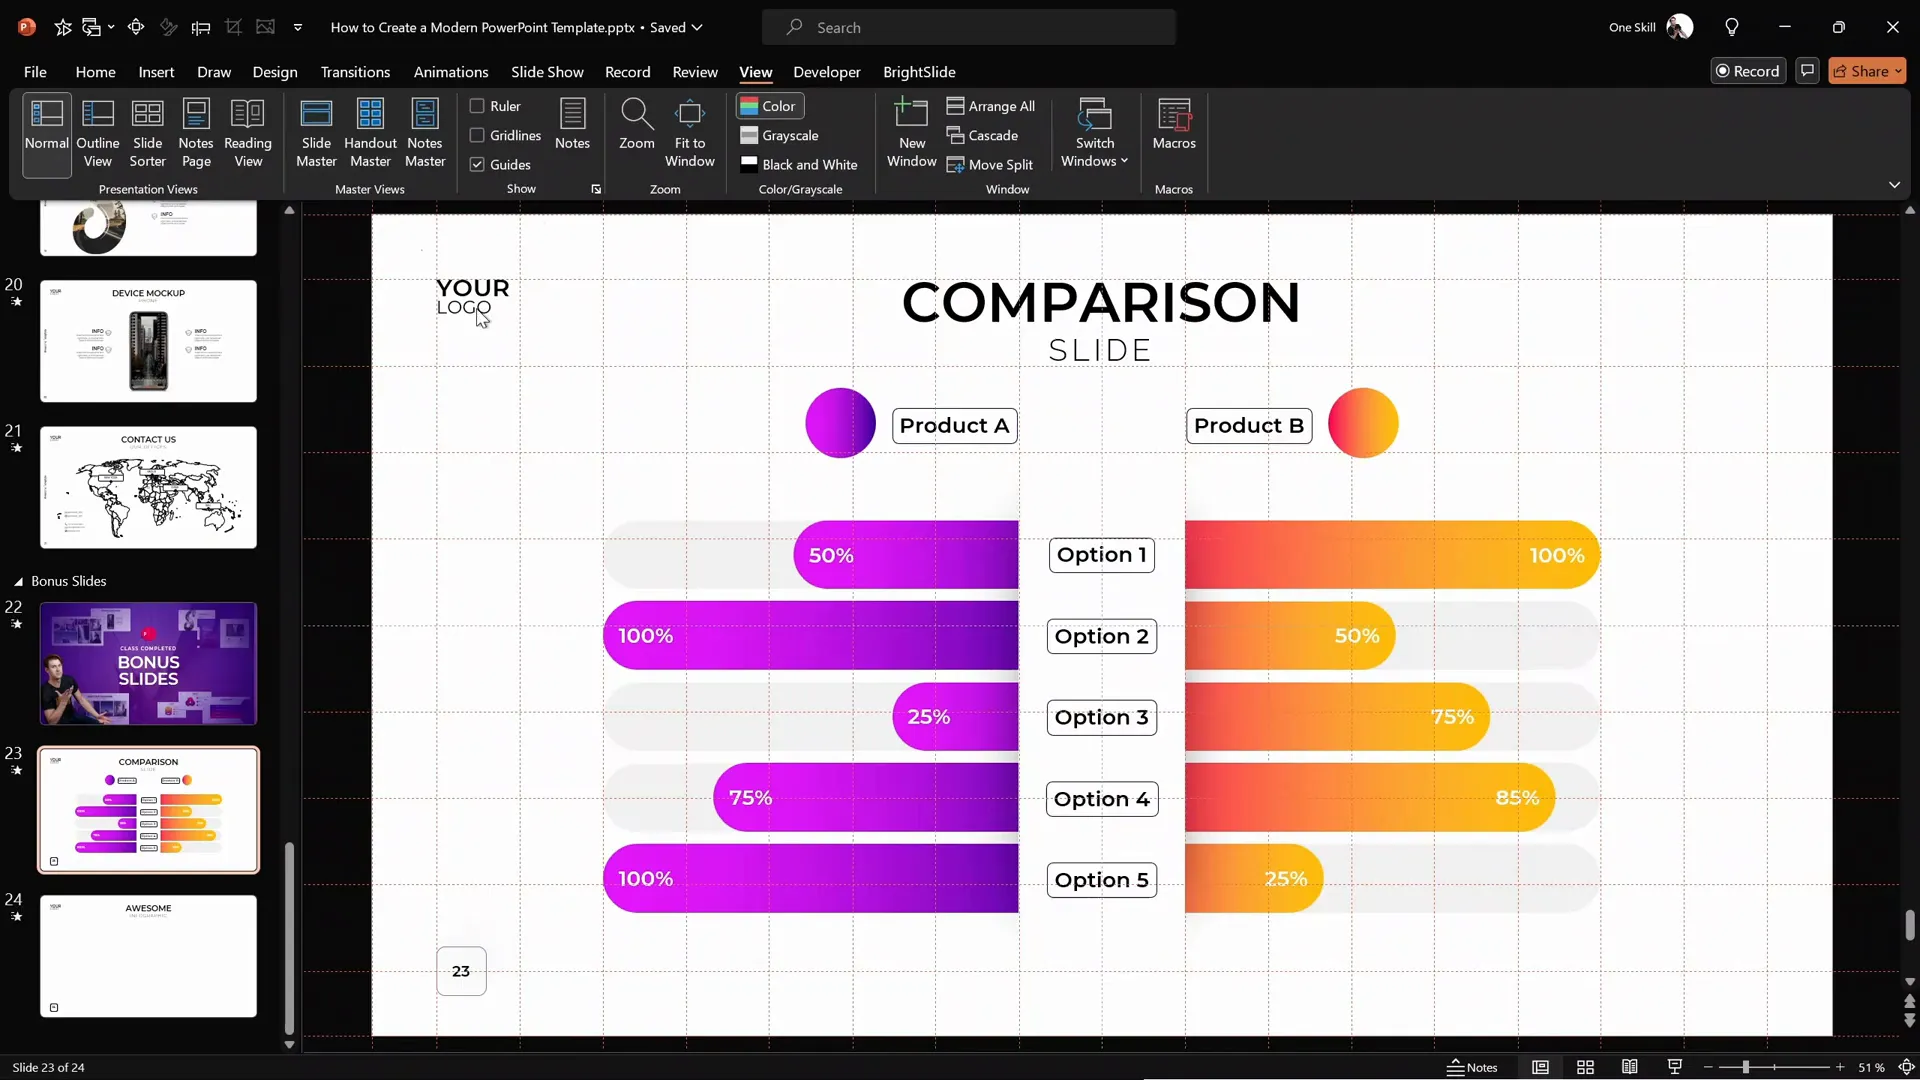
2. Use a Grid for Precise Alignment
To ensure the infographic elements are perfectly aligned, turn on the grid and guides. In this example, the slide uses a grid of 18 columns and 8 rows. The main white shape at the center covers 2 columns wide and 6 rows tall.
This grid system helps keep your design consistent and balanced. If you want to learn how to create grids like this, check out the Modern PowerPoint Template Class on Skillshare.
Designing the Infographic: Shapes, Labels, and Layout
Once your slide is set, it’s time to build the visual elements that make up the infographic. This includes the central white shape with shadow, colorful labels, and background accents.
3. Create the Central White Shape with Shadow
- Insert a rectangle shape centered on the slide using the grid dimensions (2 columns wide, 6 rows tall).
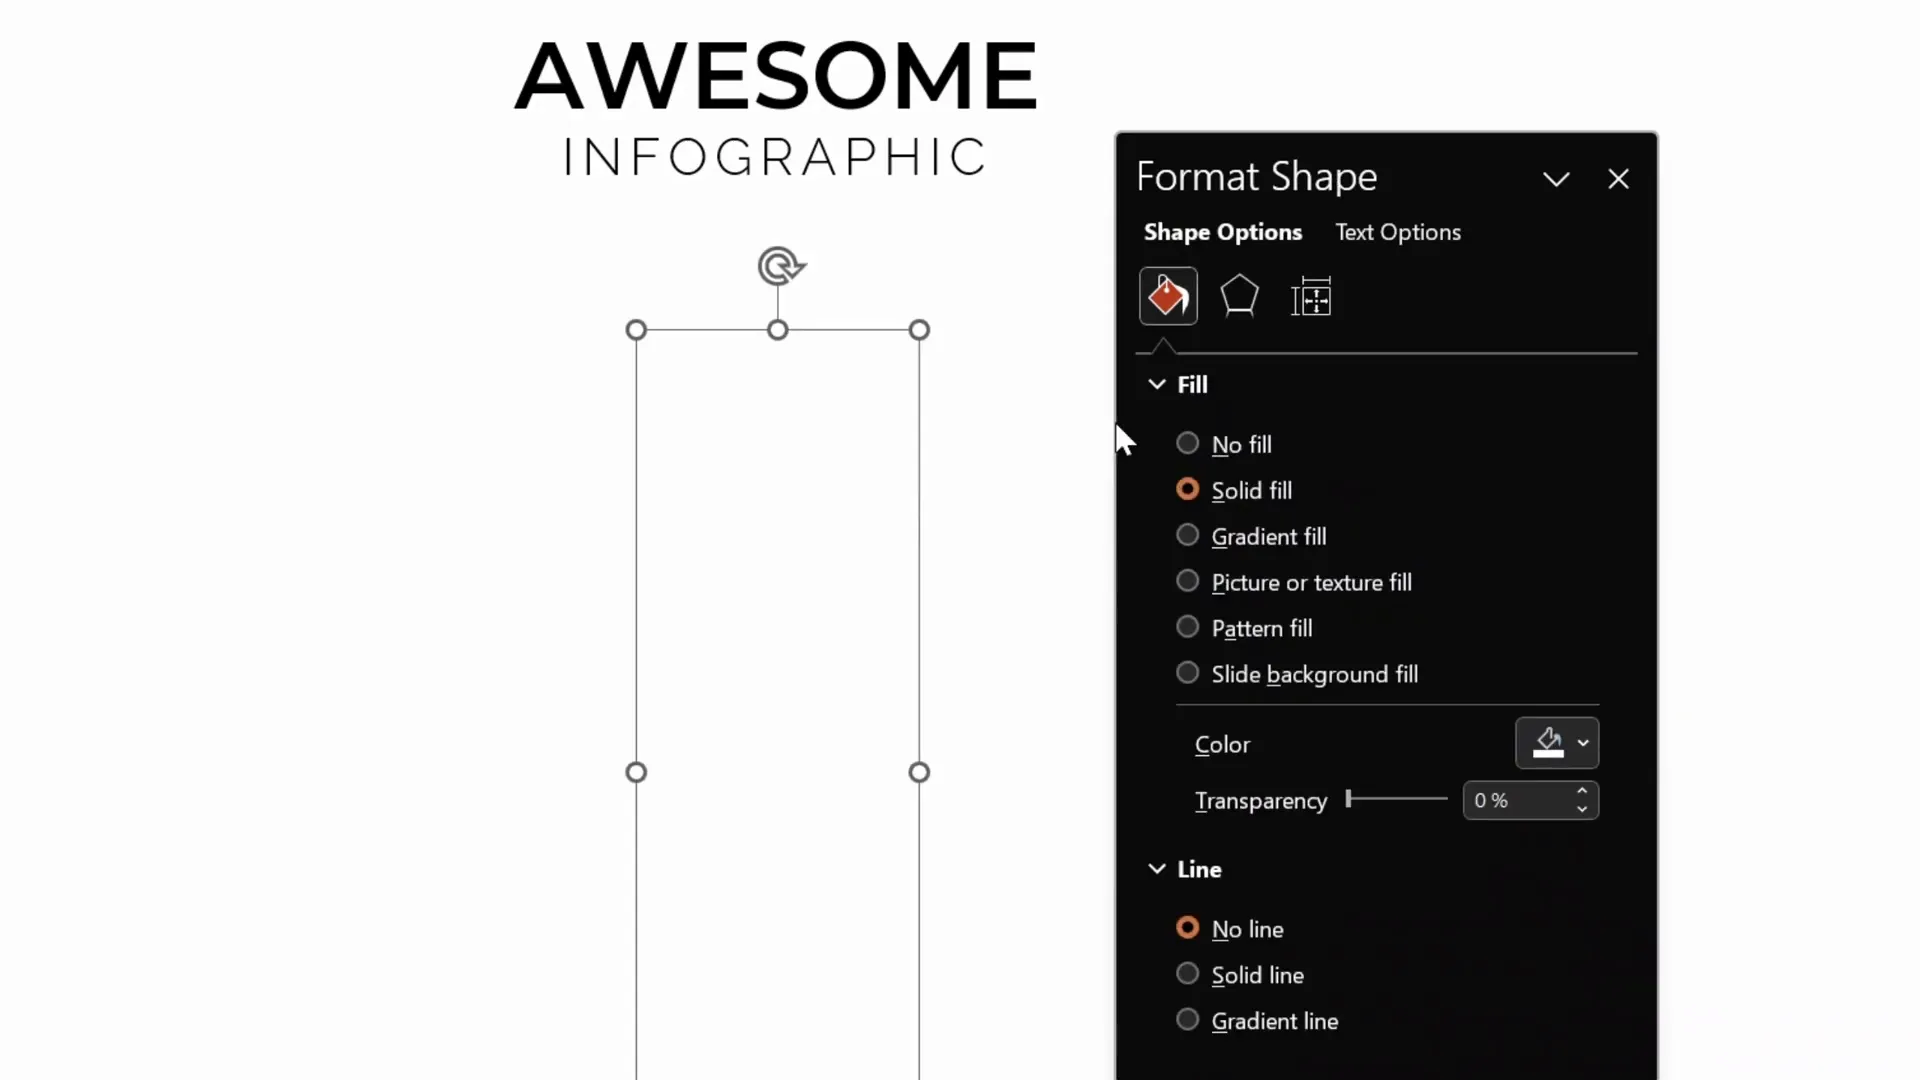
- Fill the rectangle with a white color and remove the outline.
- Add a subtle shadow effect: select the preset shadow located in the center, then adjust transparency to 20%, blur to 100 points, and size to 70 points. This creates a soft shadow that highlights the shape without overwhelming the slide.
4. Design Product Labels and Bubbles
Labels and bubbles add clarity and visual appeal by highlighting key data points or product features.
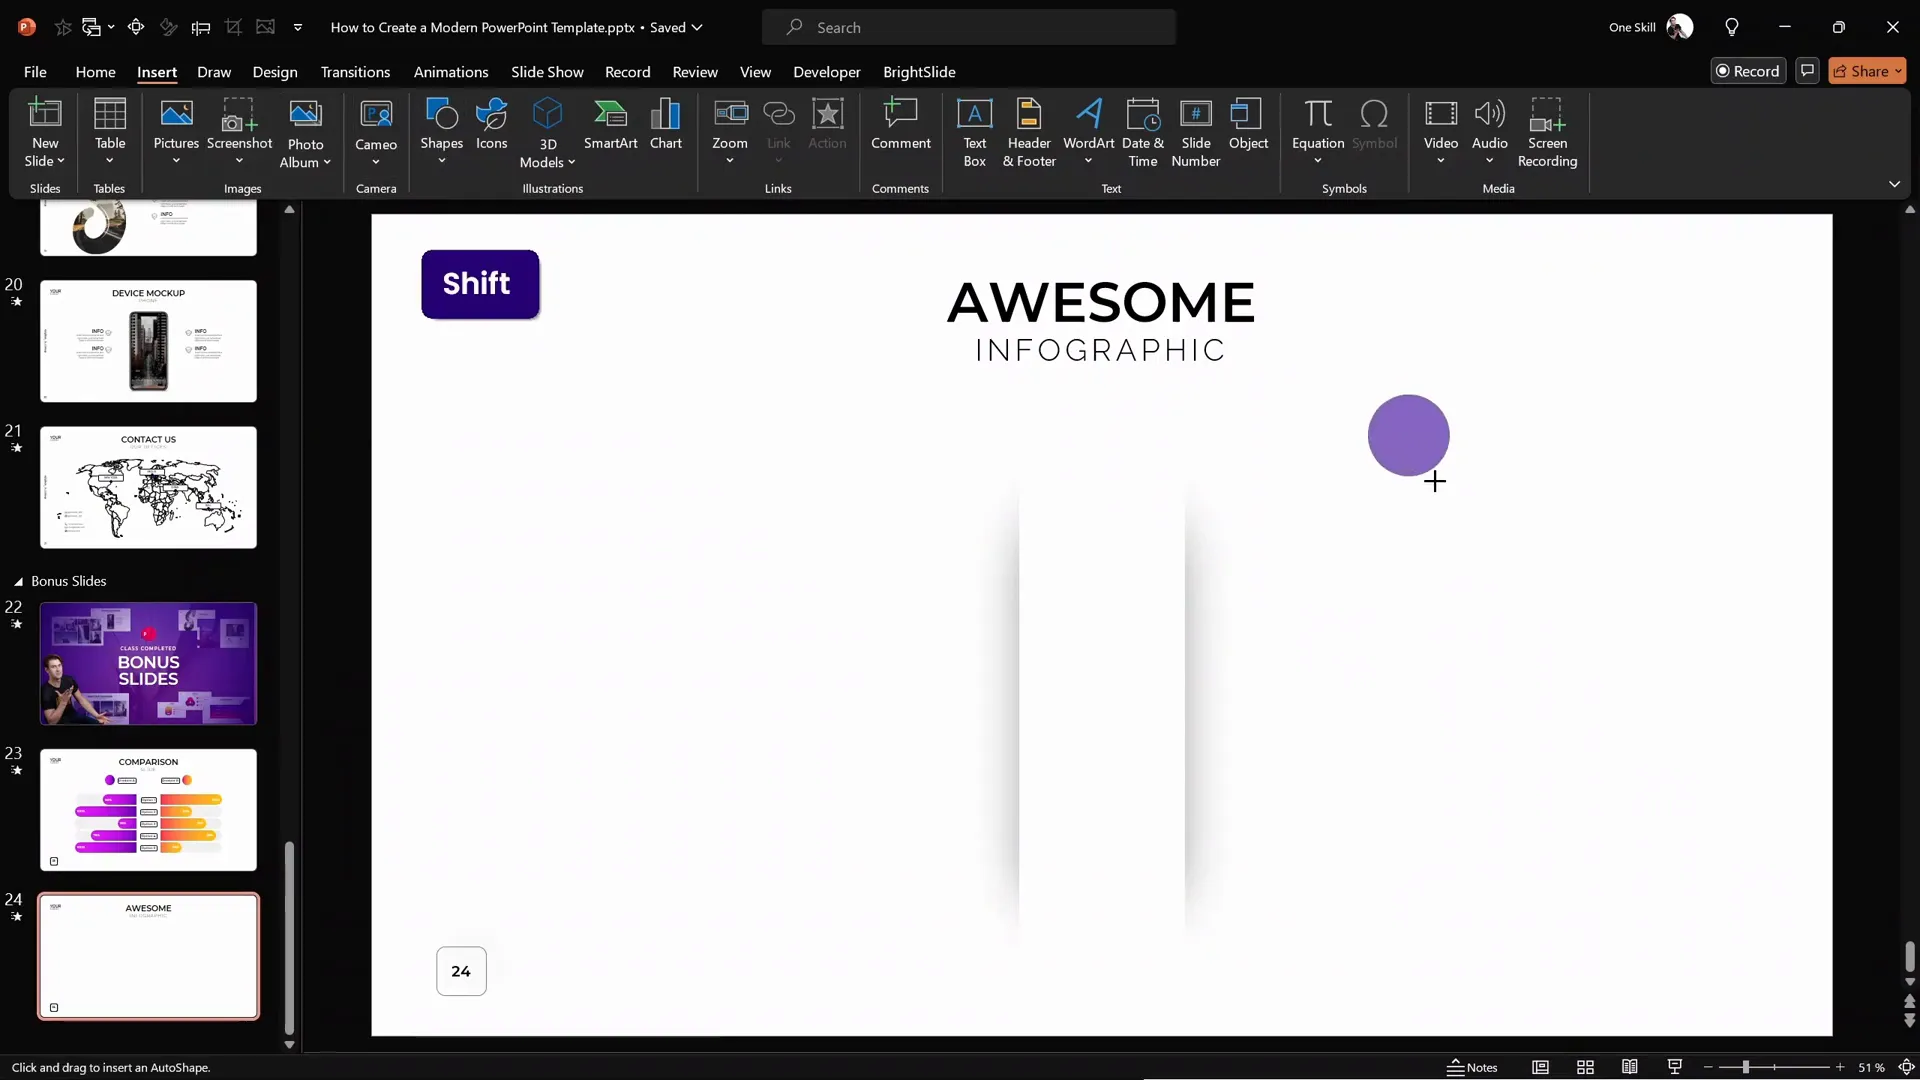
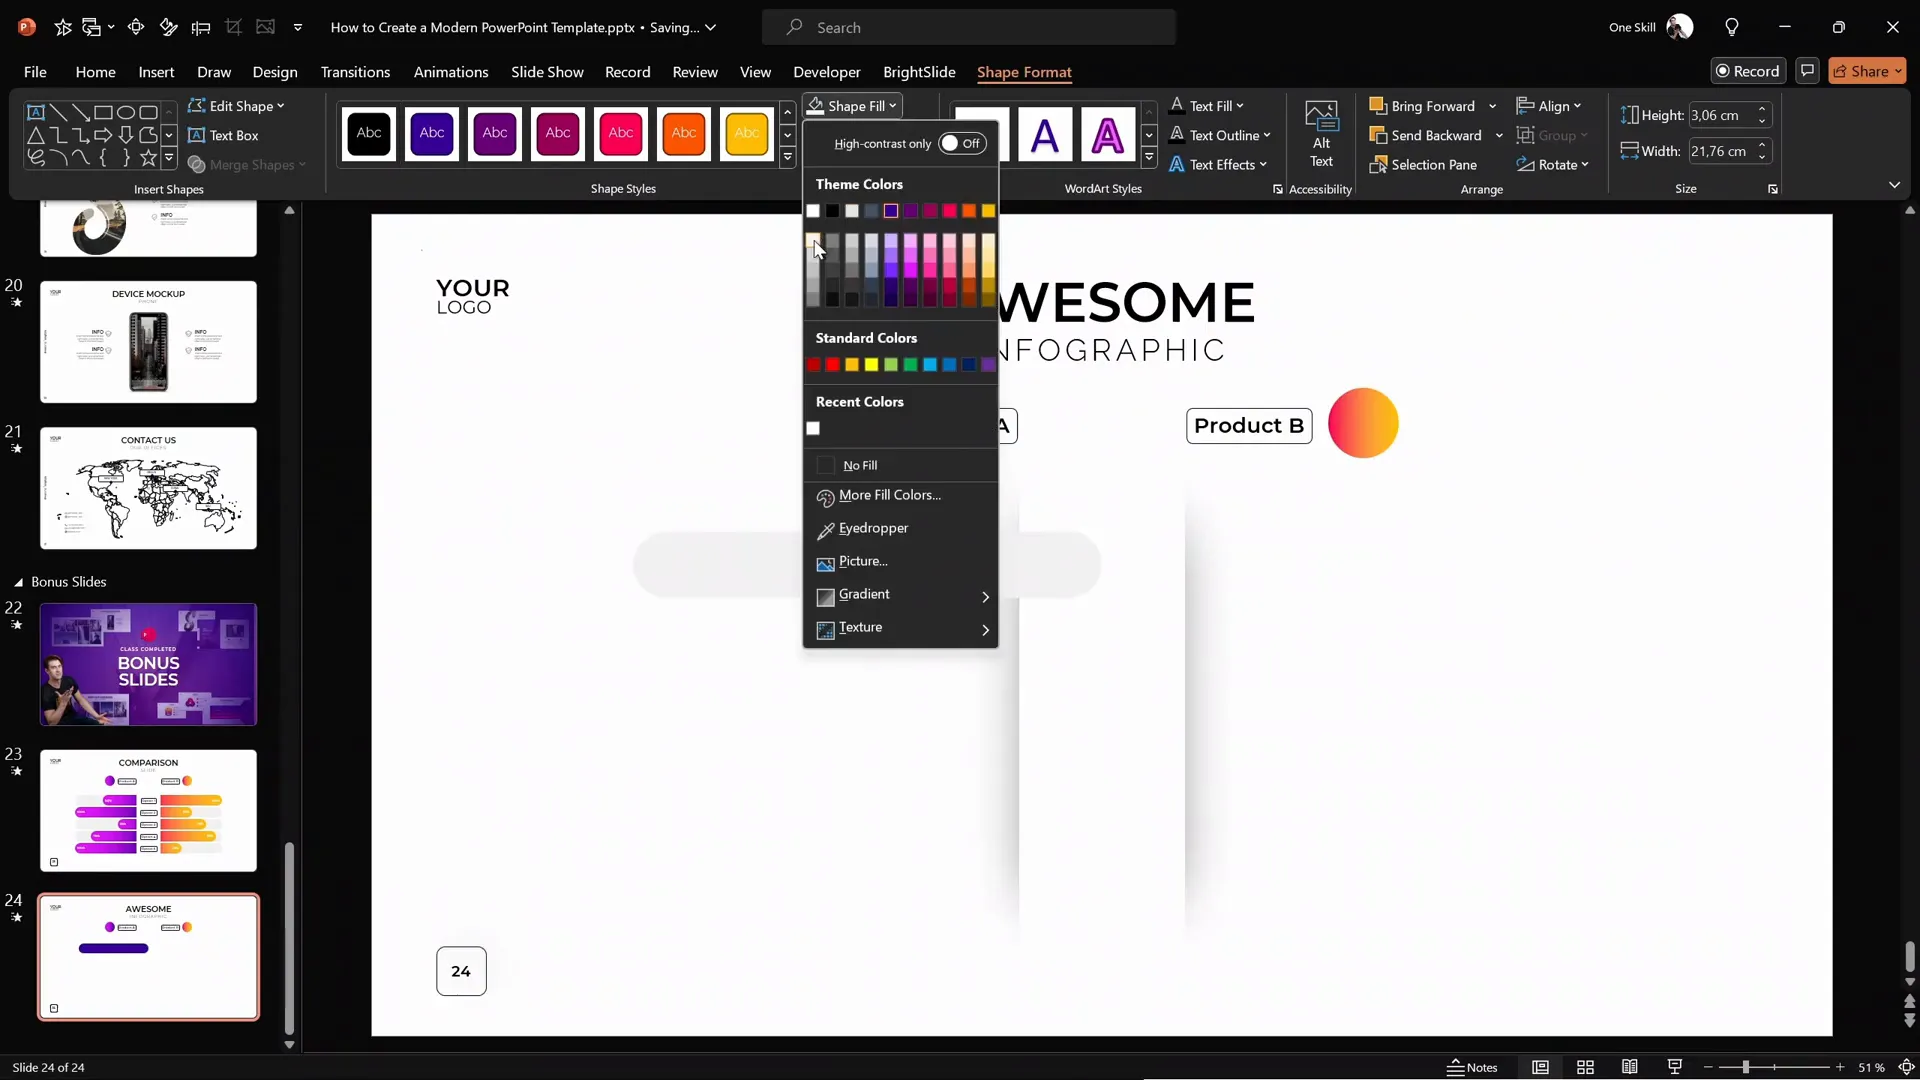
- Insert a perfect circle (hold Shift while drawing) for the bubble.
- Fill the circle with a gradient fill for a modern look. Use the Format Painter tool to copy the gradient style from an existing shape to save time.
- Add a small rounded rectangle next to the circle to serve as the label text box. Double-click inside to add your text.
- Use the Format Painter or shortcut
Ctrl + Shift + Cto copy the style from another label andCtrl + Shift + Vto paste the style. - Group the circle and label by selecting both and pressing
Ctrl + G.
5. Add Background Rounded Rectangles for Depth
Background shapes add subtle texture and depth to the slide.
- Insert rounded rectangles and make them fully rounded by adjusting the yellow handle.
- Stretch and widen these rectangles to create horizontal bands.
- Fill these with a light gray color and remove outlines.
- Send them behind the white central shape by right-clicking and selecting Send to Back.
- Duplicate these shapes across the slide using
Ctrl + Shiftdrag to maintain a straight line. - Use the BrightSlide PowerPoint add-in (free) to select all shapes by fill color for quick editing and duplication.
6. Create Colorful Sliding Bars
These colorful bars will be animated to slide out, making your infographic dynamic and engaging.
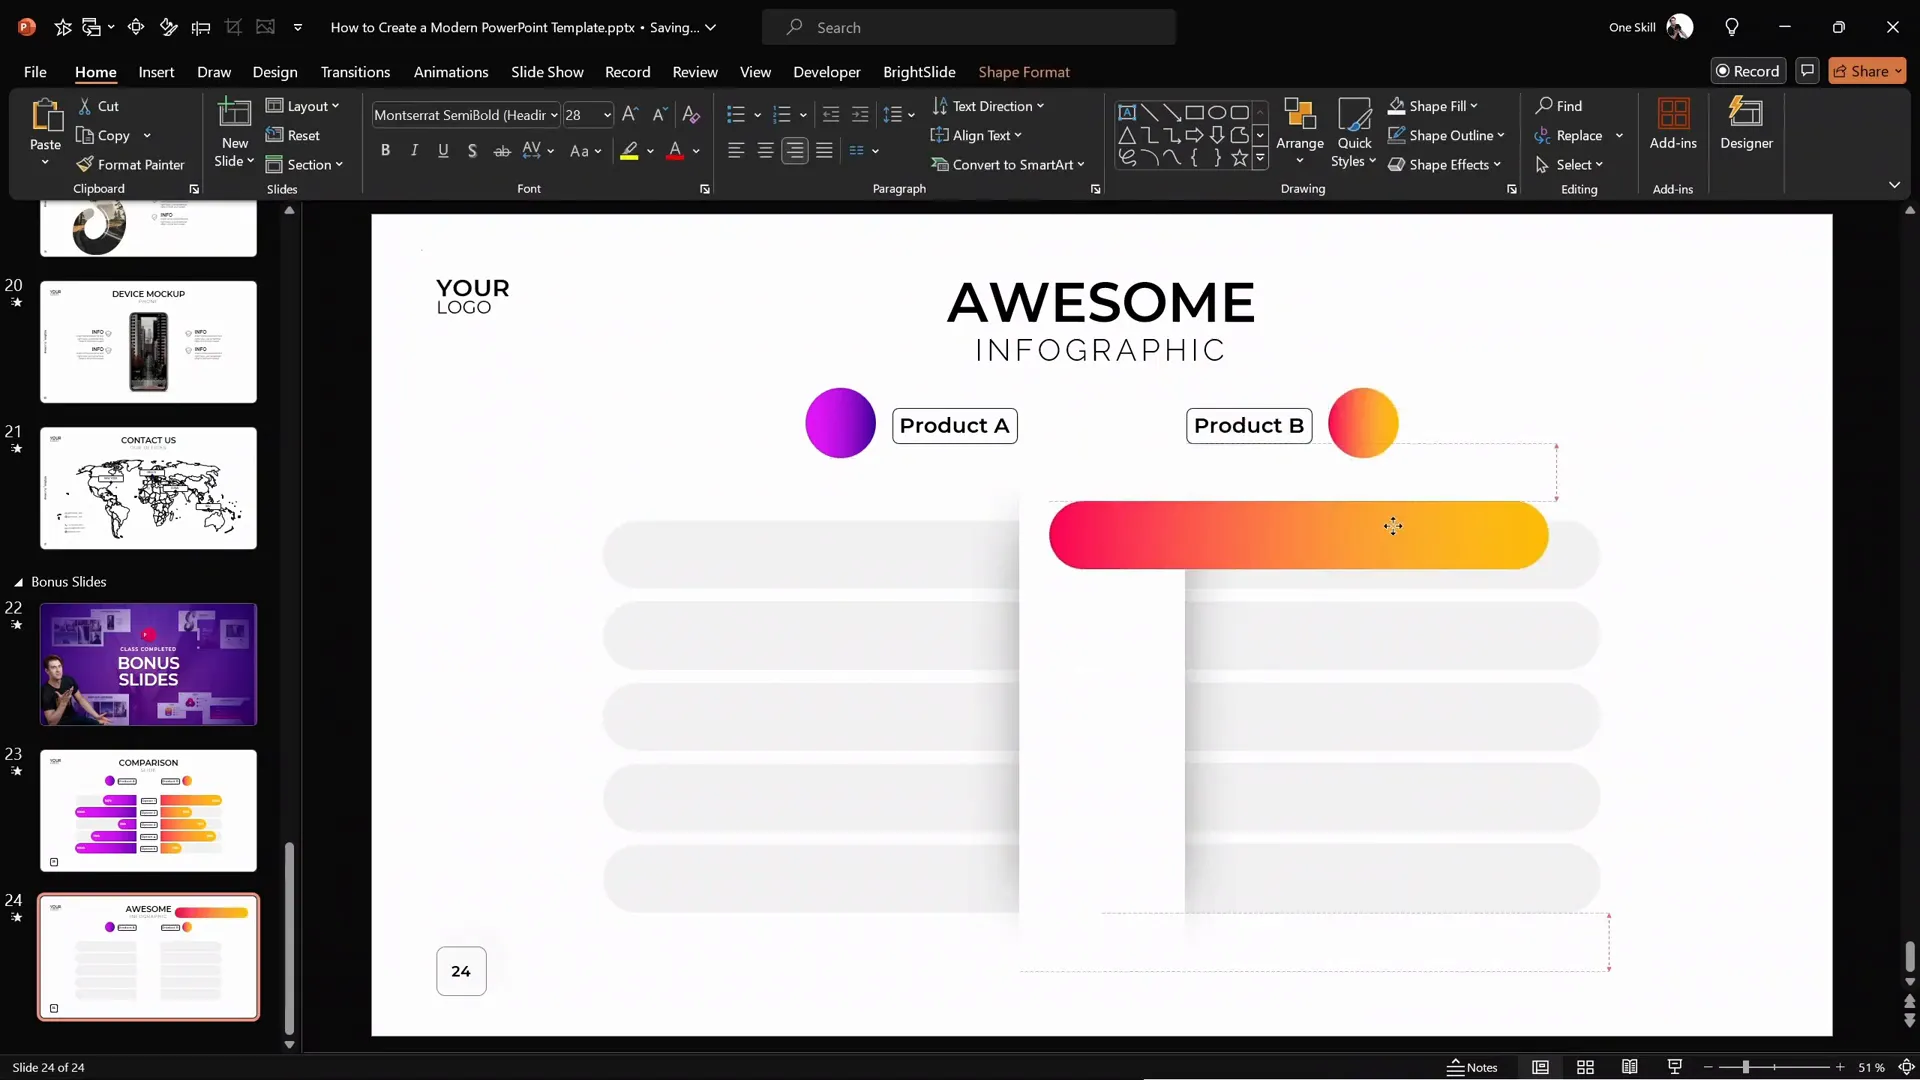
- Duplicate one of the gray rounded rectangles.
- Apply a vibrant gradient fill (orange, purple, etc.) to the duplicated shape.
- Align the colorful bar perfectly with the gray background shape using alignment tools or productivity shortcuts (hold Ctrl + arrow keys for precise nudging).
- Adjust the length of the bar to represent a percentage value (e.g., 75%).
- Double-click inside the bar to add the percentage text.
- Make sure the white shape with shadow stays on top to mask the animation edges.
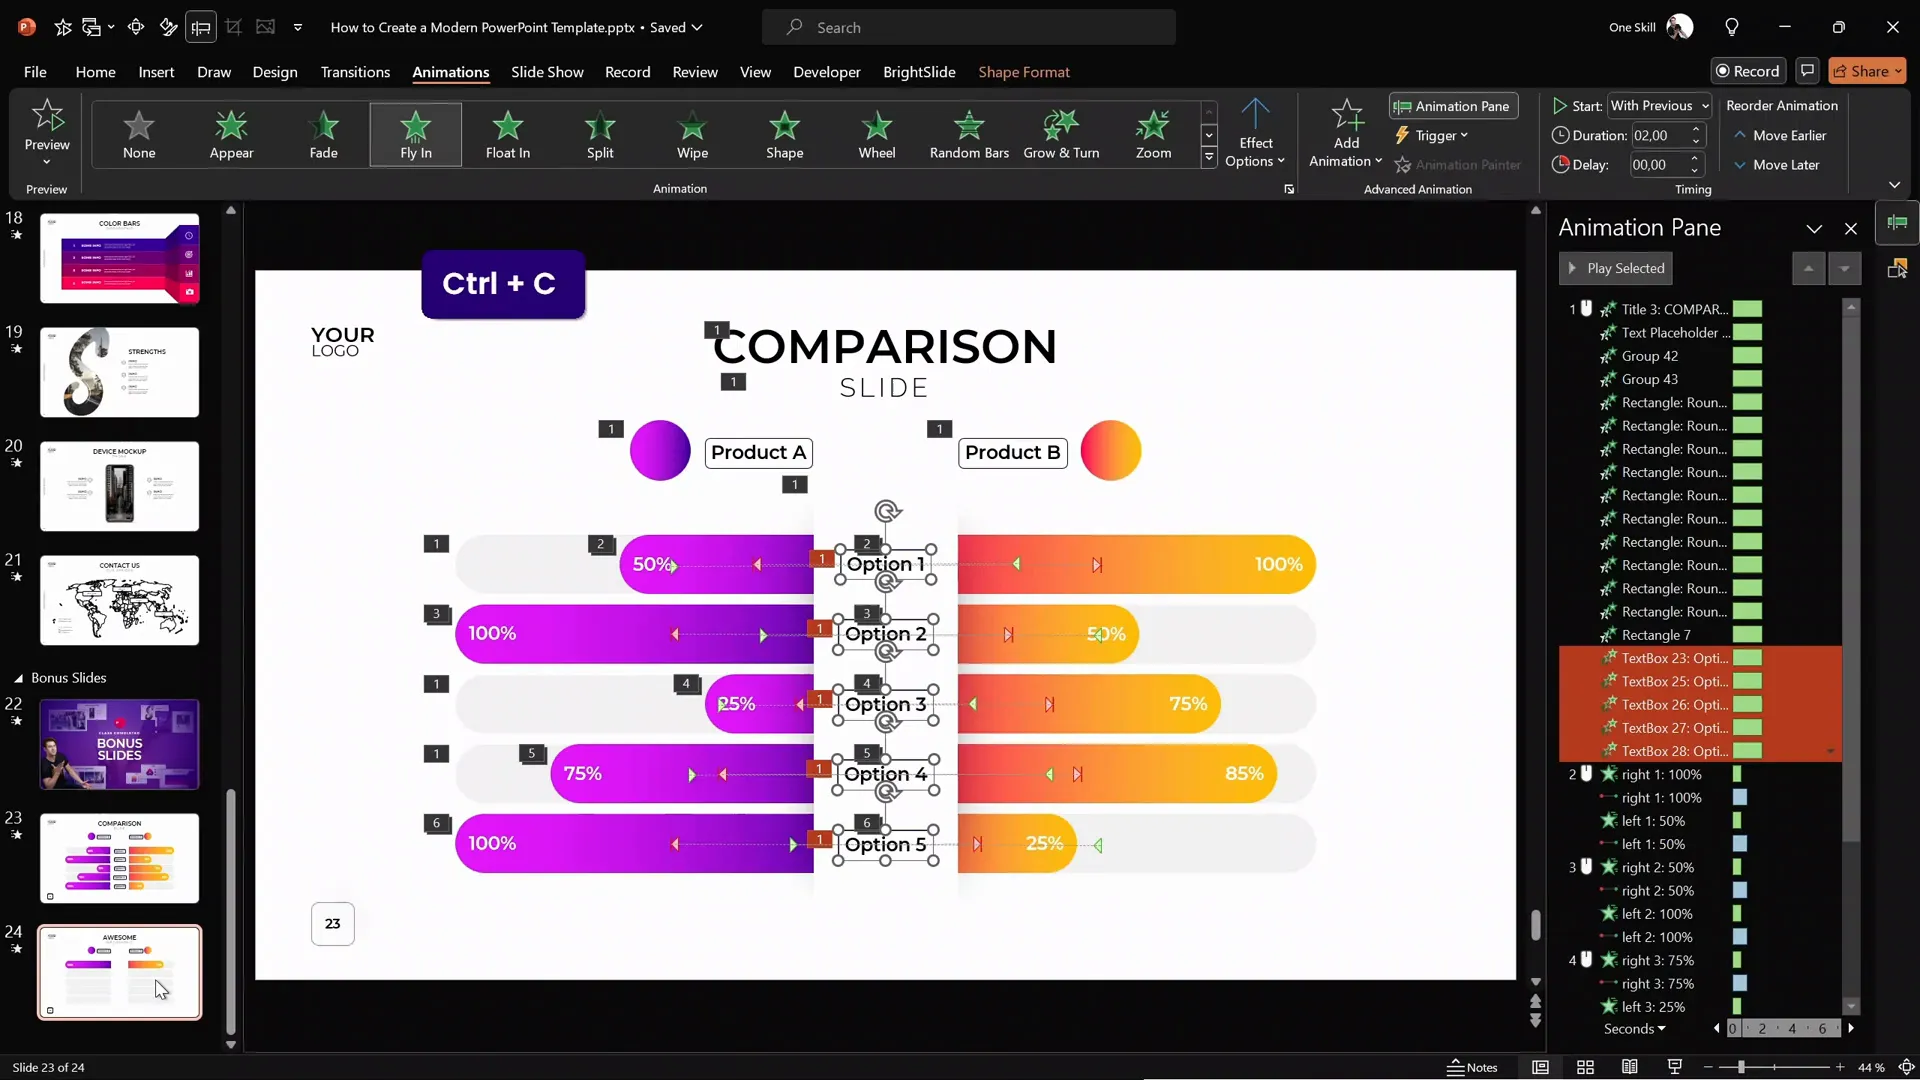
Adding Animations: Motion Paths and Wipe Effects
Animations bring your infographic to life by smoothly revealing different elements. The key here is combining motion path and wipe animations to create a sliding effect with a clean mask.
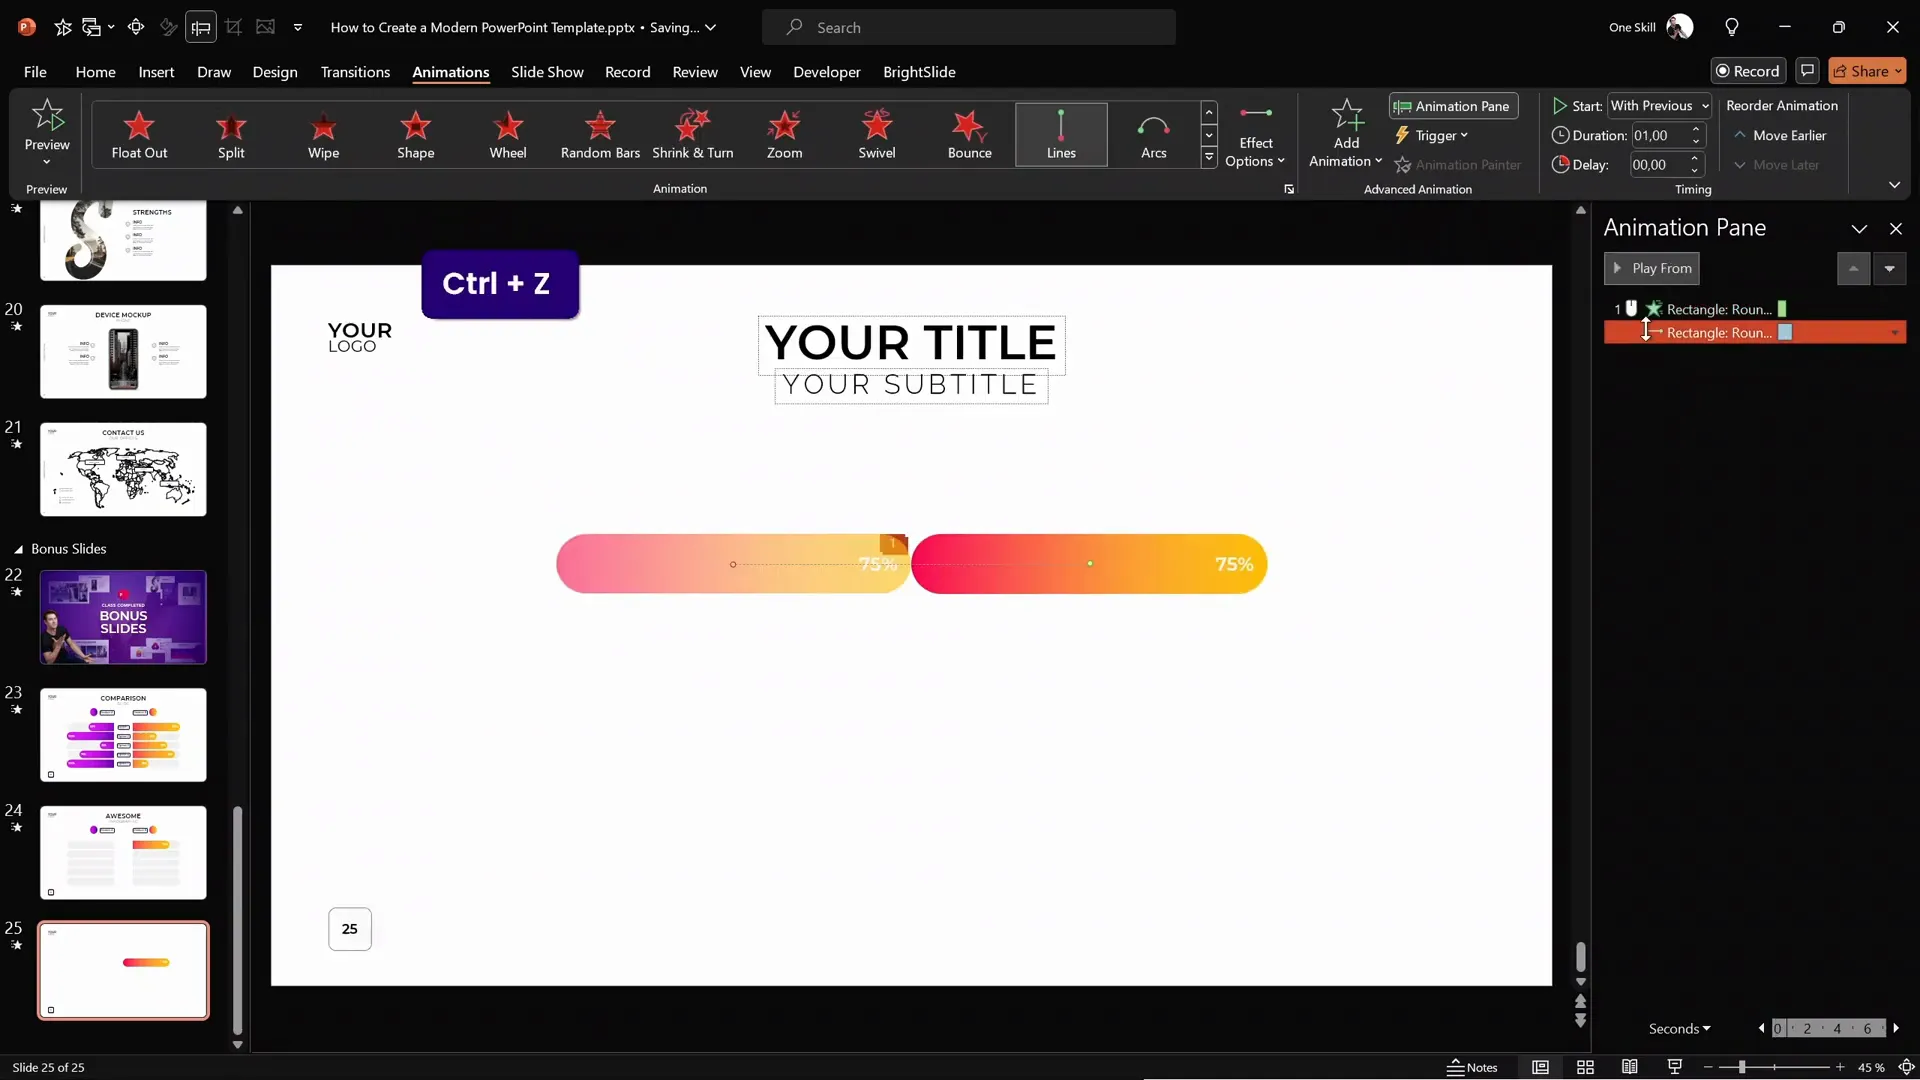
7. Add Motion Path Animation
- Select the colorful rounded rectangle (e.g., orange bar).
- Open the Animation Pane and delete any existing animations to start fresh.
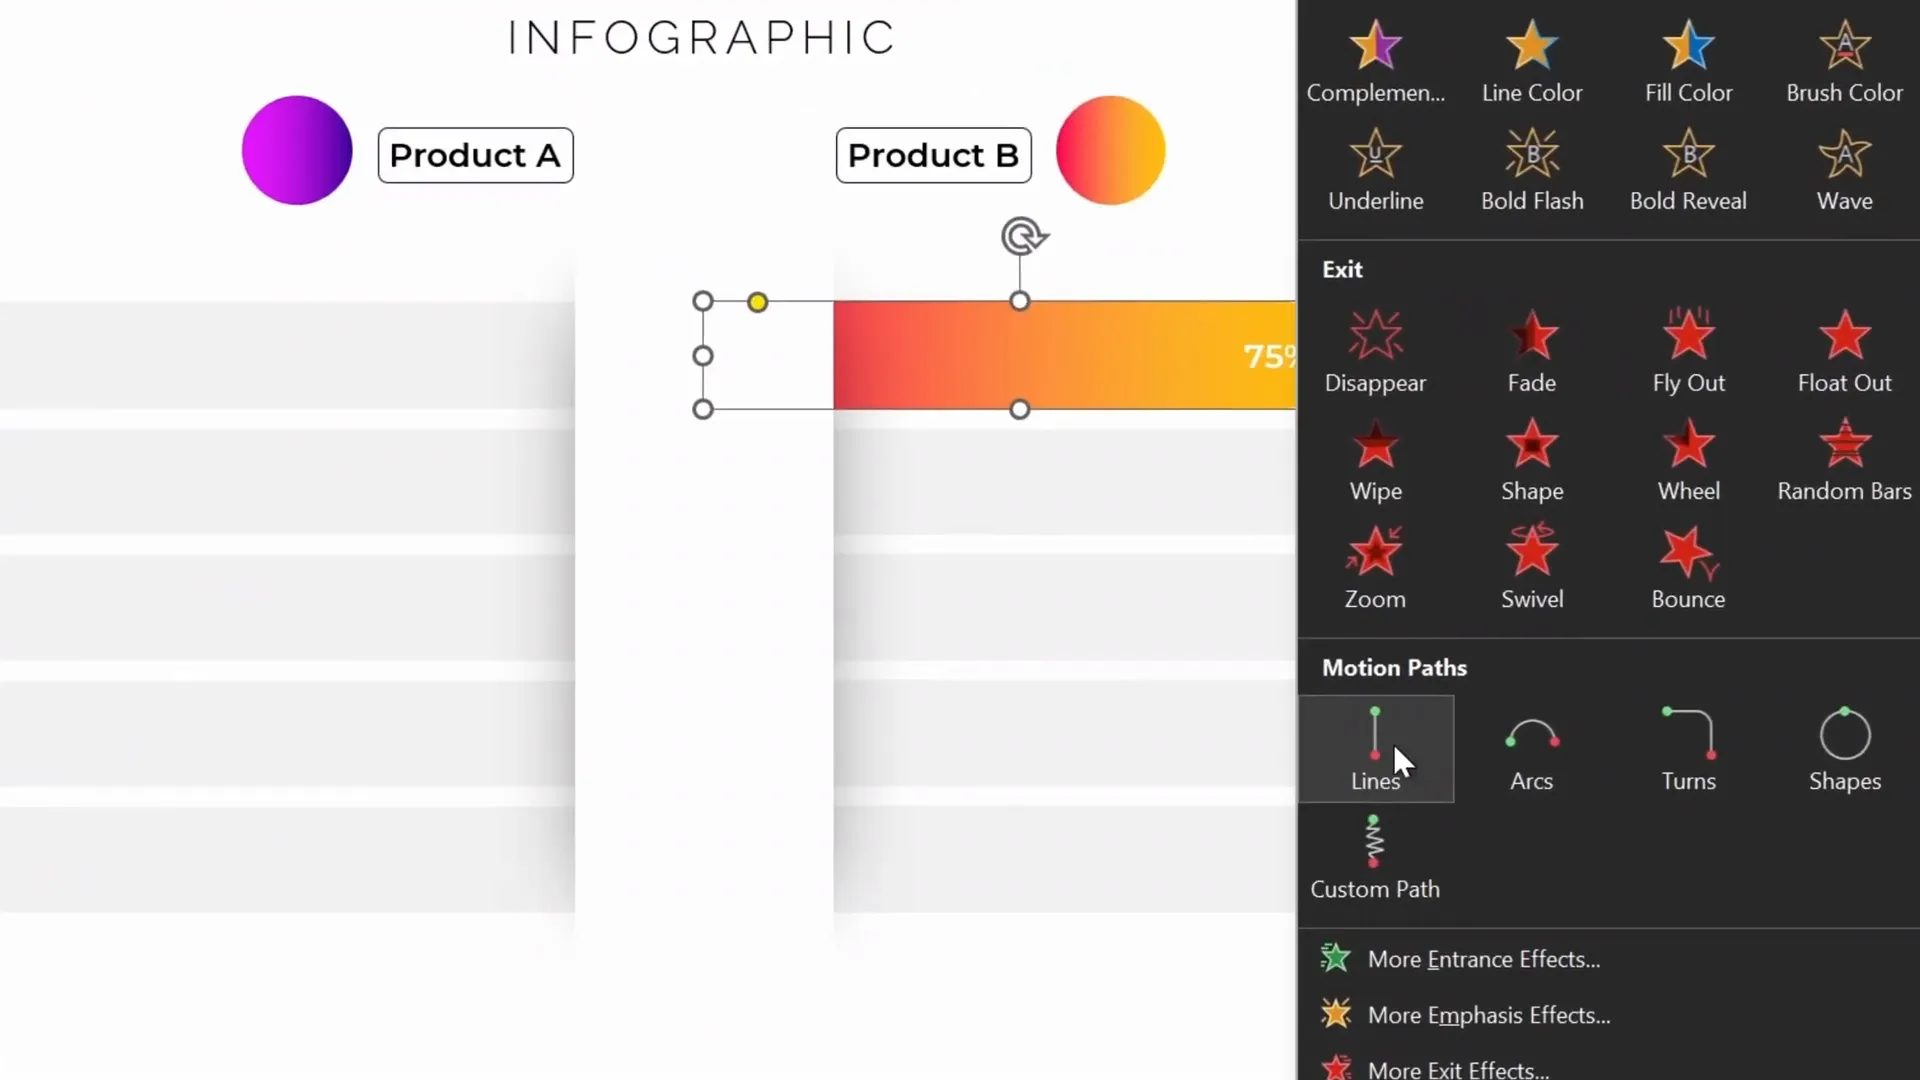
- Click Add Animation, choose Motion Paths → Line.
- Adjust the motion path direction to slide the bar outwards (e.g., to the left for the right bar).
- If the animation goes the wrong way, check Reverse Path Direction.
- Set the animation duration to around 1 second.
- Double-click the motion path animation in the pane and set Smooth Start and Smooth End for a soft landing effect.
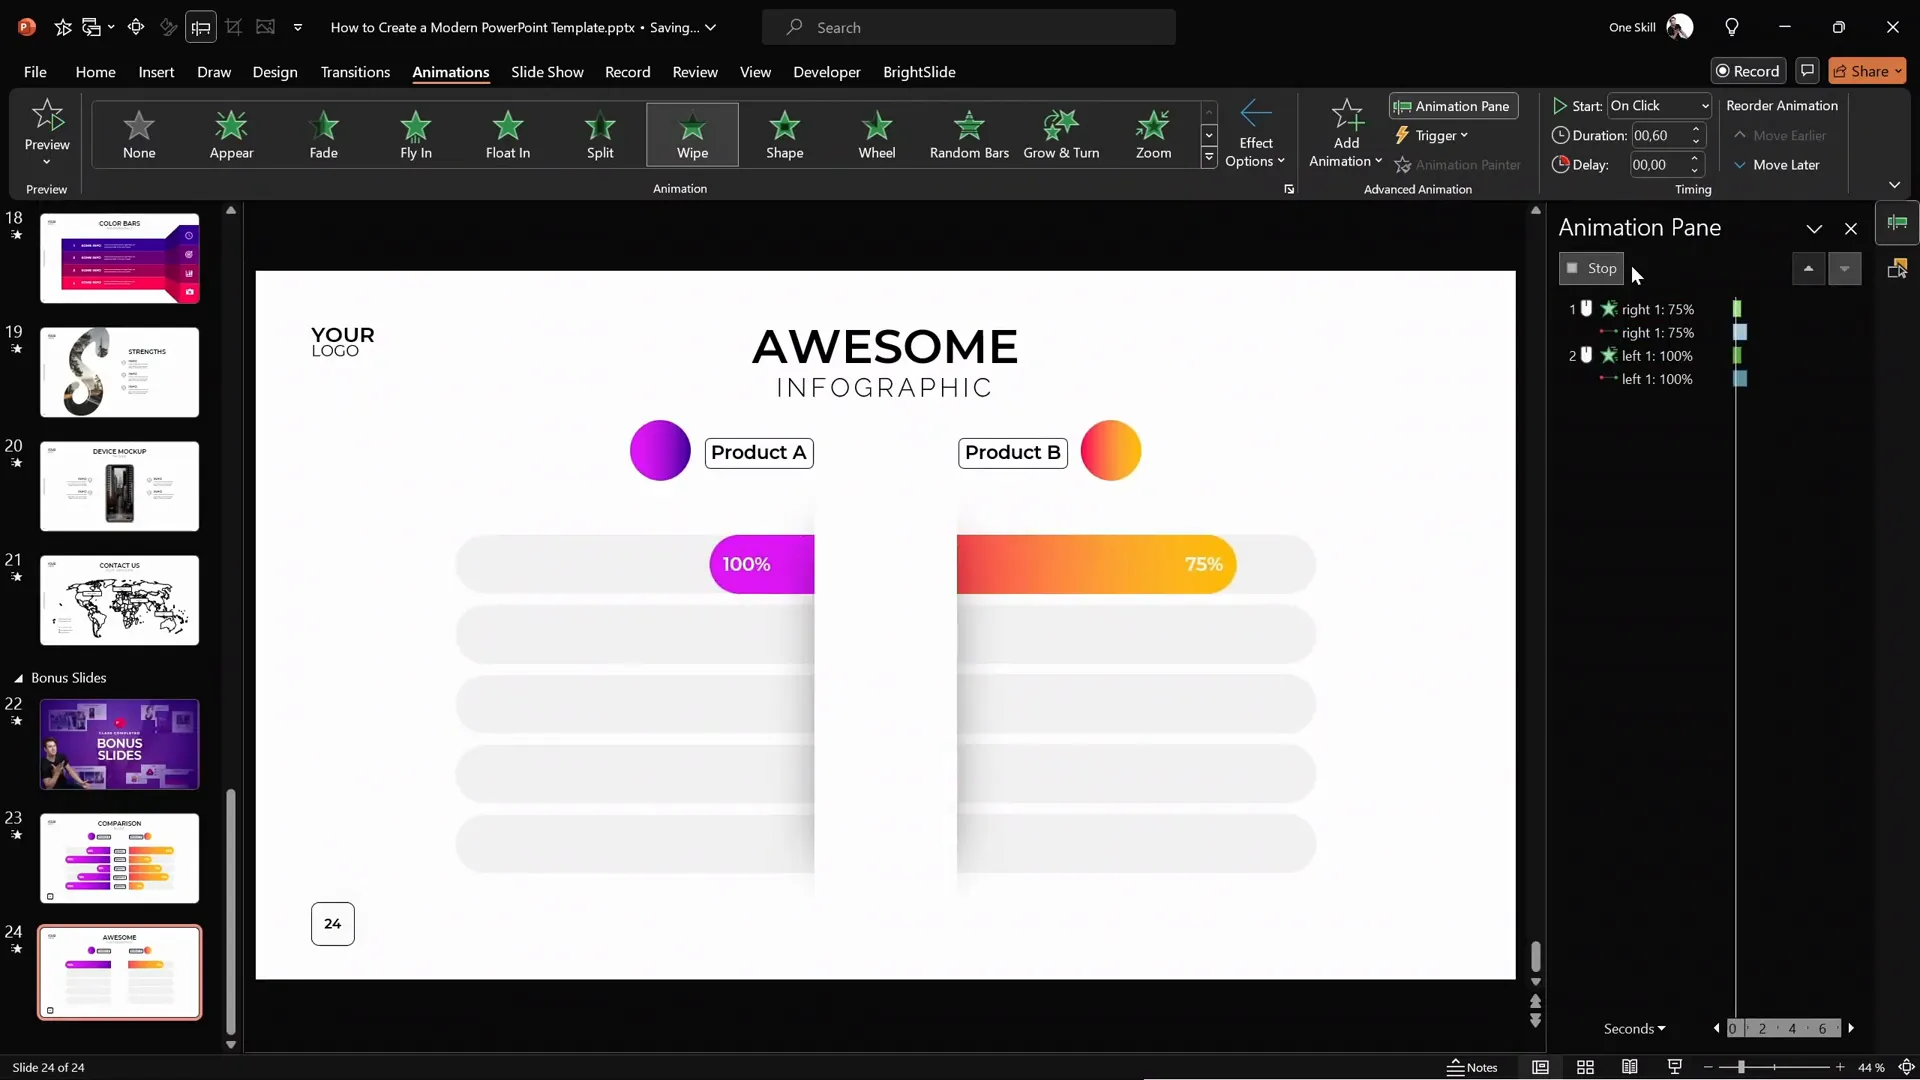
8. Add Wipe Animation to Mask the Edge
To hide the edge of the sliding bar and create a clean reveal, add a wipe animation that acts as a mask.
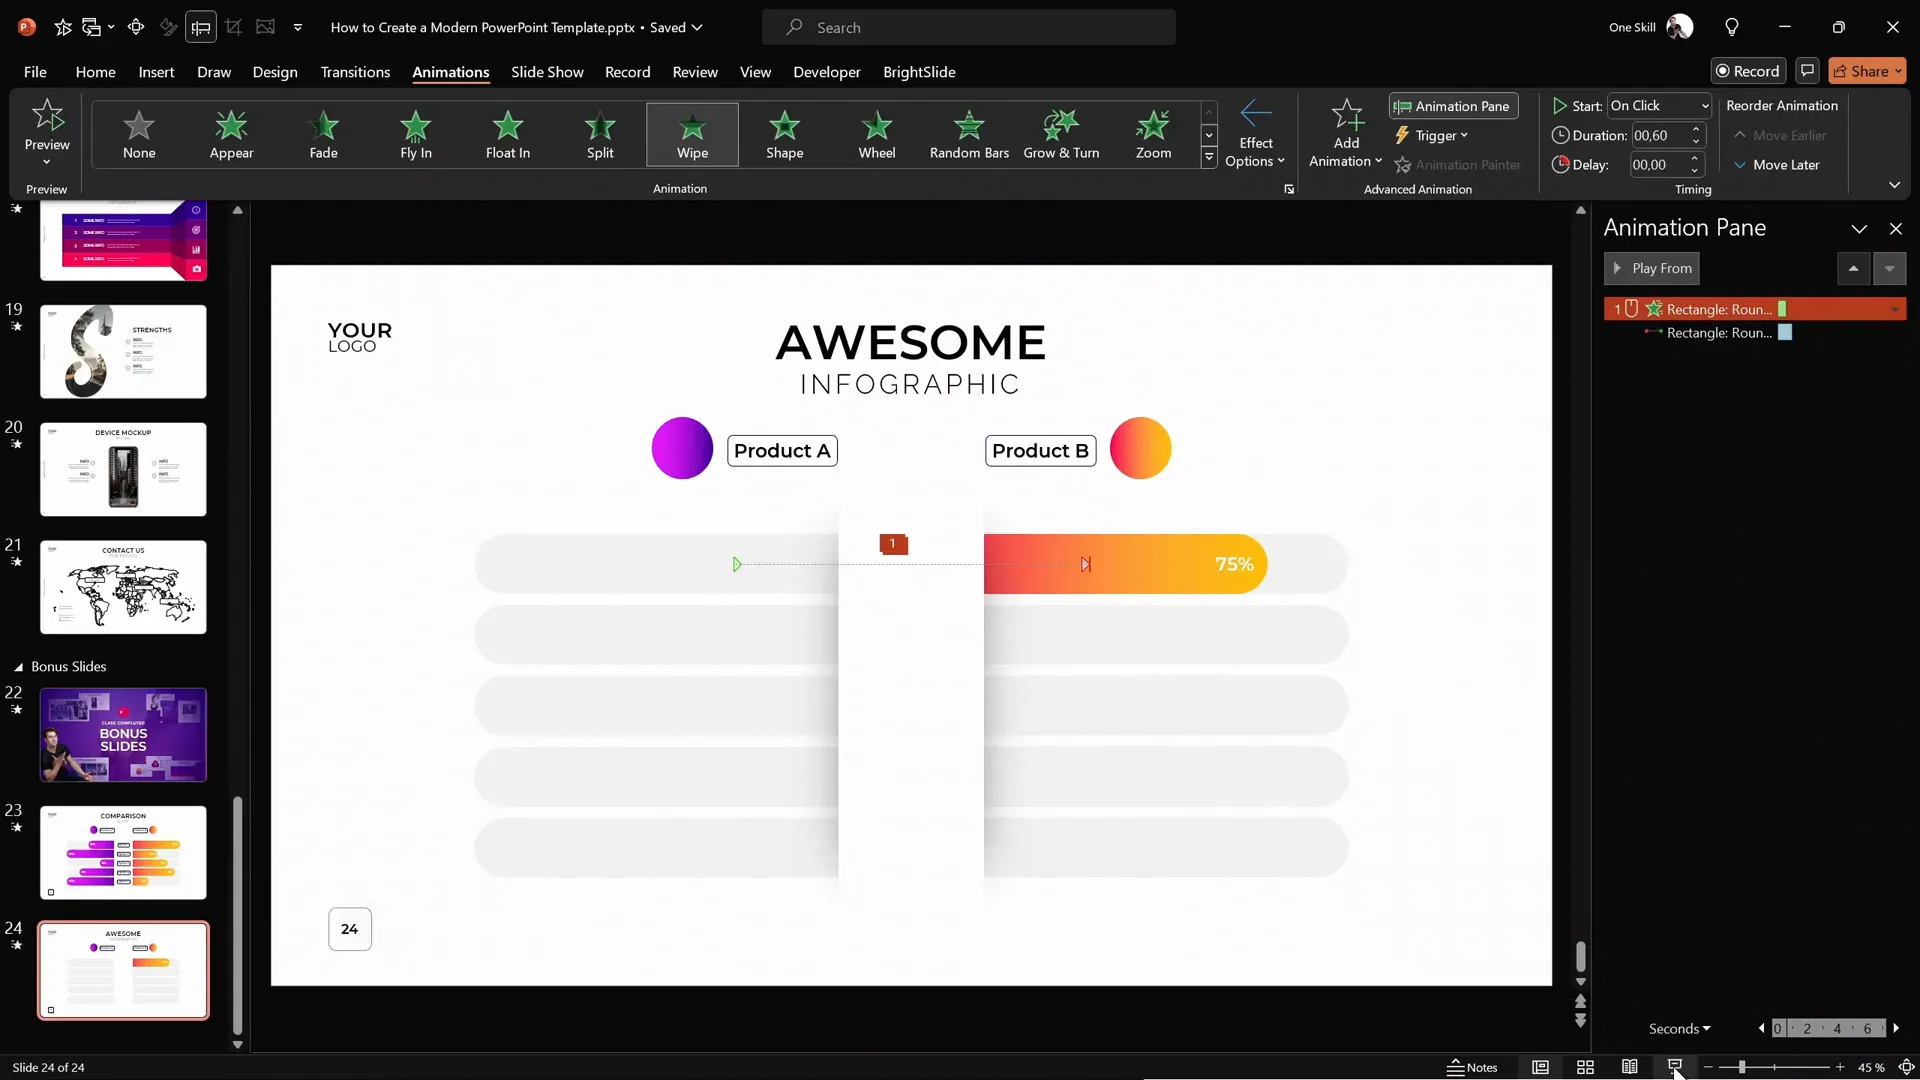
- With the colorful bar still selected, add a Wipe entrance animation.
- Move the wipe animation above the motion path animation in the animation pane.
- Set the wipe direction to From Right for the right bar (or From Left for the left bar).
- Set the wipe duration to about 0.6 seconds.
- Configure the motion path animation to start With Previous along with the wipe animation.
- Preview the animation to see the bar smoothly slide out, masked perfectly by the wipe effect.
9. Understand the Animation Combination
To better grasp how these animations work together, you can duplicate the bar on a fresh slide and toggle animations individually:
| Animation Type | Effect |
|---|---|
| Motion Path Only | Bar moves horizontally but edge is visible. |
| Wipe Only | Bar appears growing from one side but does not move. |
| Motion Path + Wipe | Bar slides out smoothly with edge cleanly masked. |
Advanced Tips: Grouping, Alignment, and Productivity Shortcuts
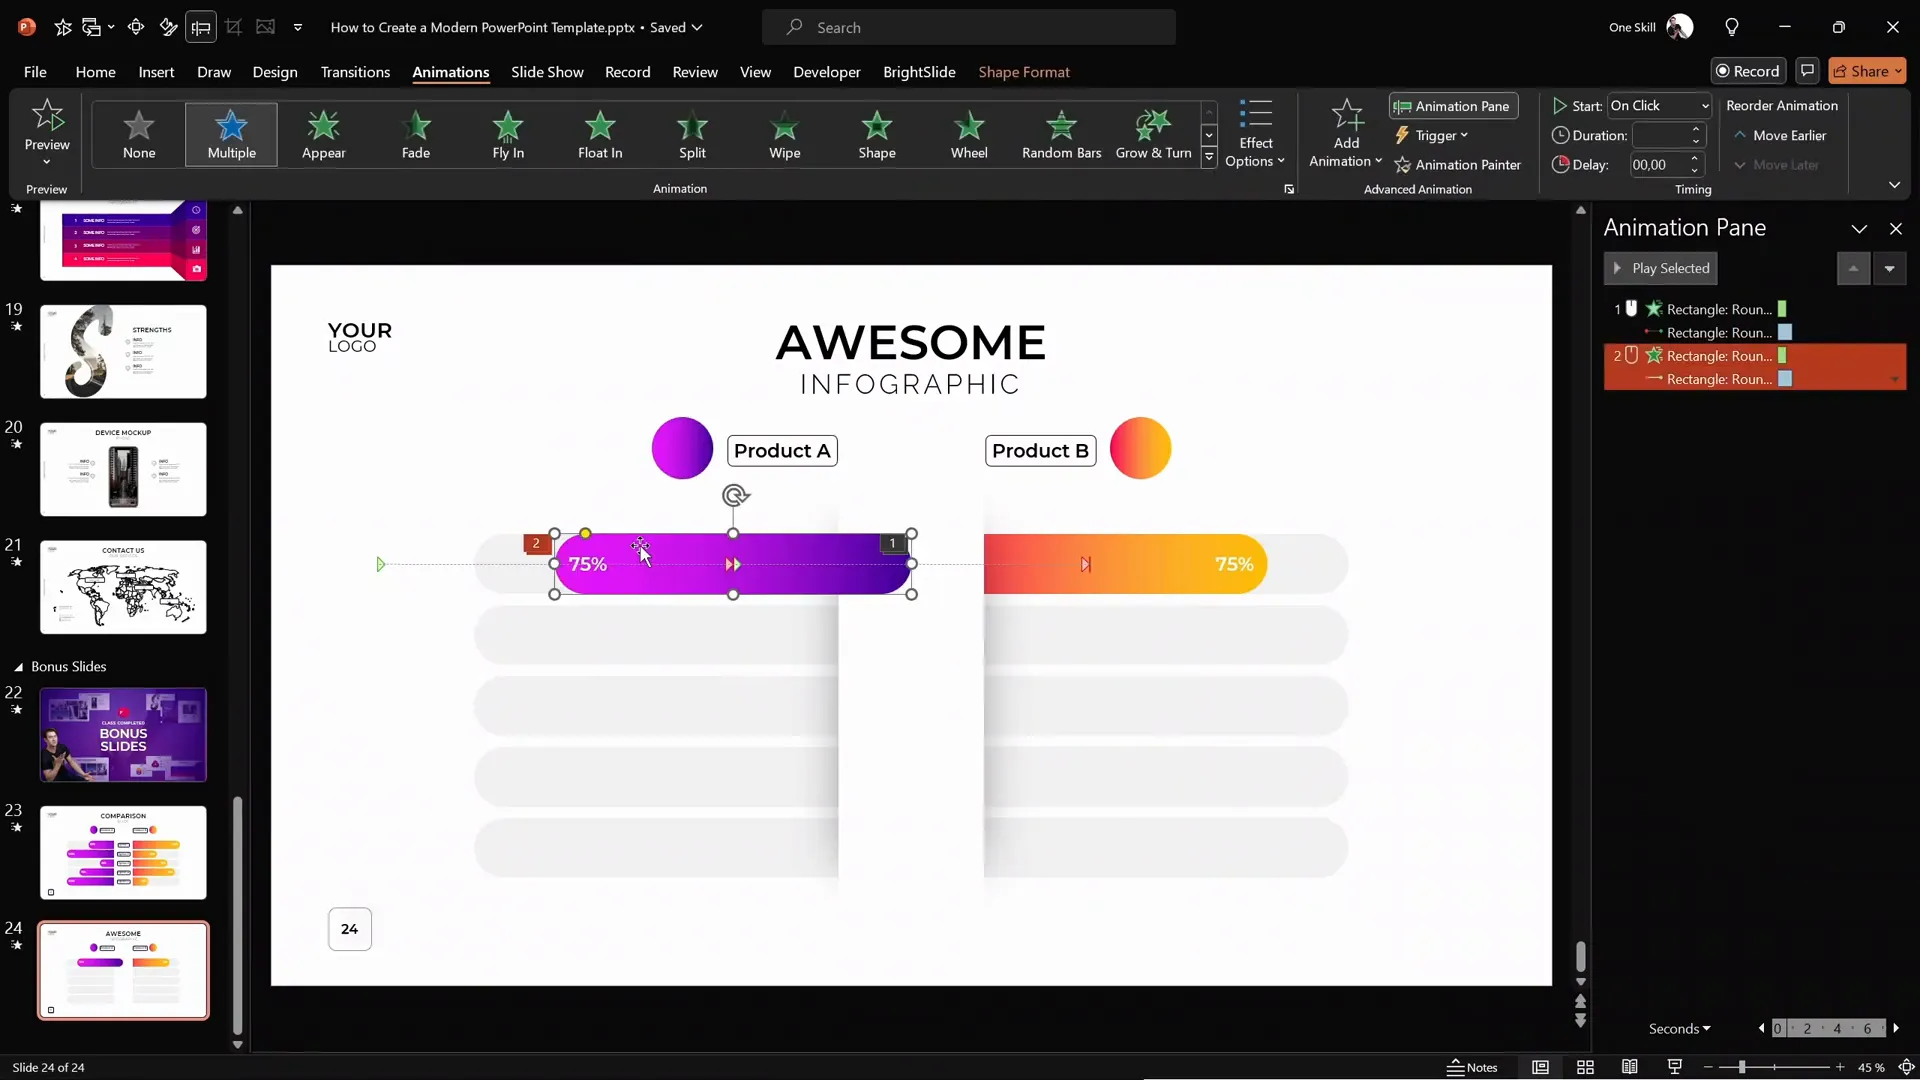
10. Duplicate and Customize Bars for Multiple Options
Once you have one animated bar working, duplicate it for other data points:
- Use
Ctrl + Dto duplicate the bar and move it to the other side of the white shape. - Change the gradient fill color (e.g., purple for the left side).
- Adjust text alignment: left-aligned for the left bar and right-aligned for the right bar.
- Modify the motion path and wipe animations to slide from the opposite direction (e.g., slide left bar to the right).
- Adjust bar lengths and percentage text as needed.
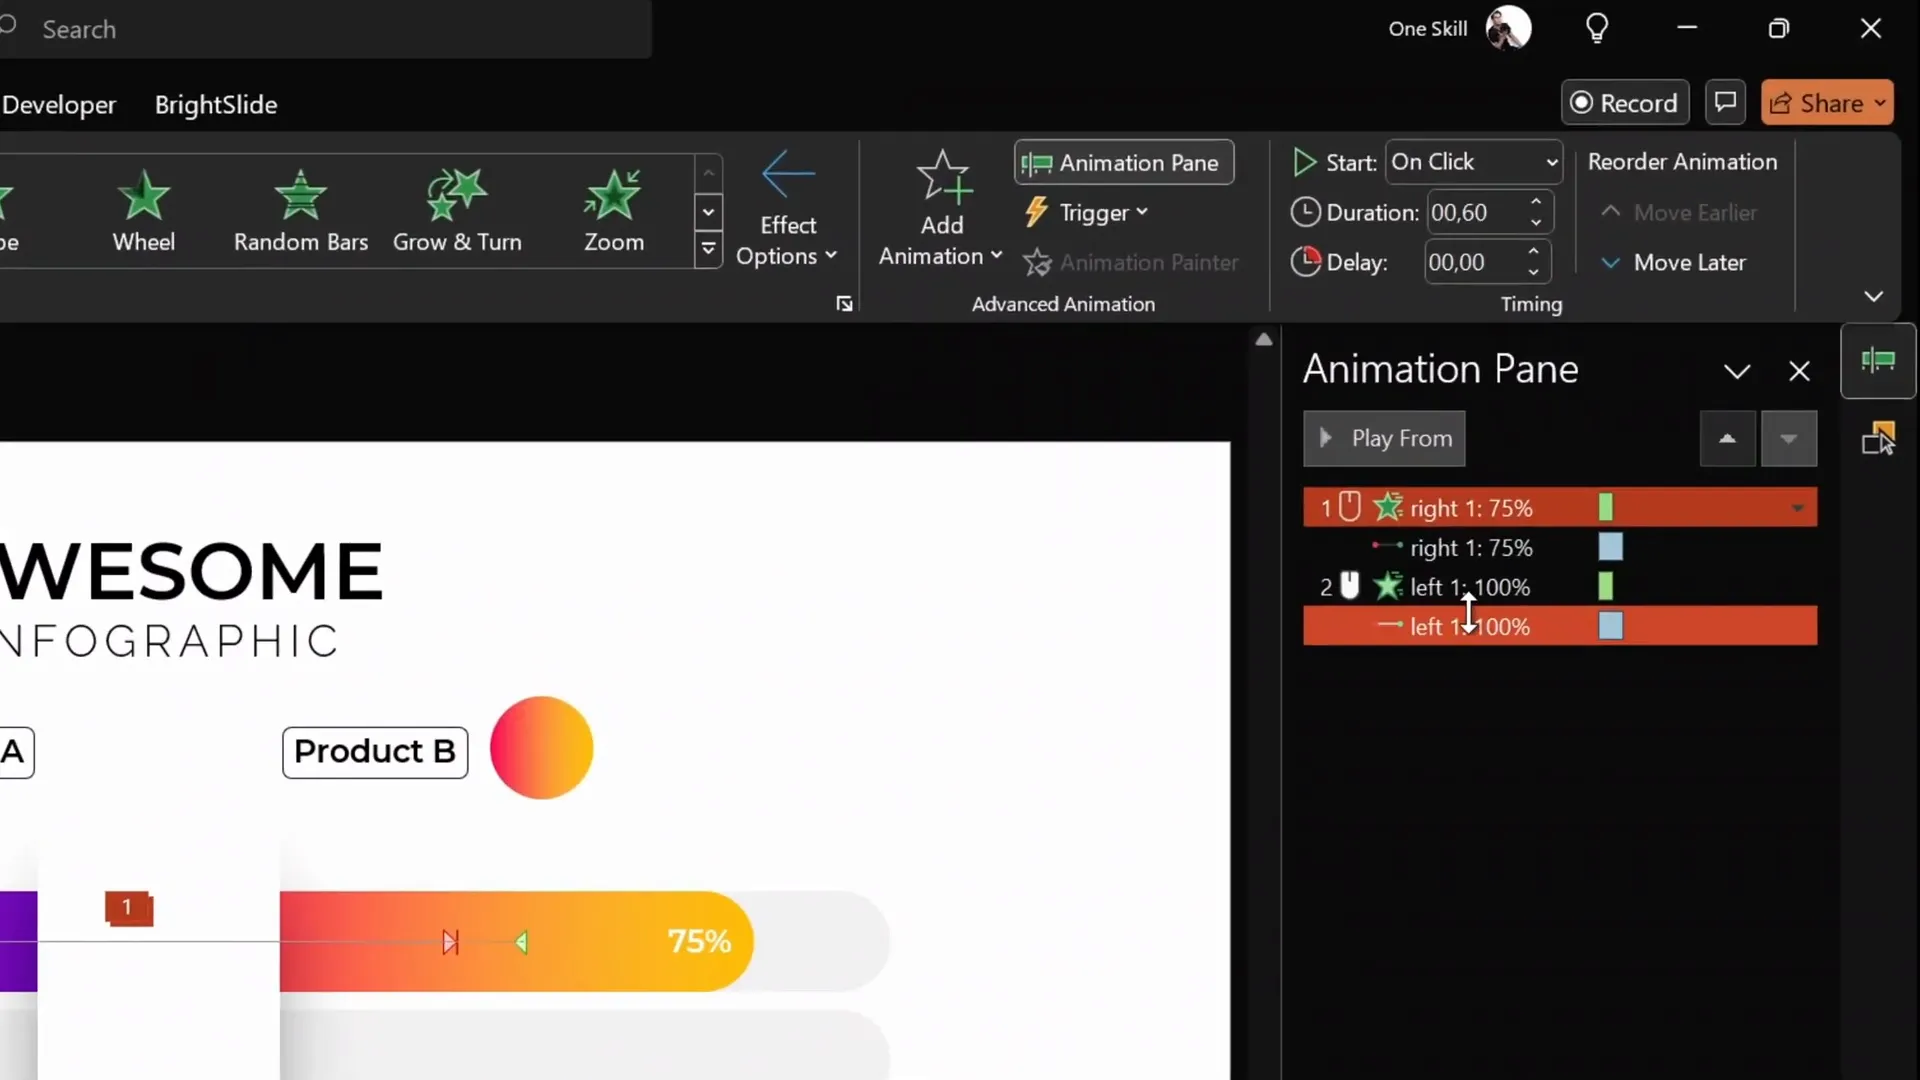
11. Use the Selection Pane for Better Organization
To keep track of multiple animated elements, open the Selection Pane and name your objects clearly:
- Name the right side bar as
Right One. - Name the left side bar as
Left One. - This makes it easier to identify and manage animations in the animation pane.
12. Synchronize Animations for a Unified Effect
By default, animations on the right and left bars trigger on separate clicks. To animate them simultaneously:
- Set the wipe animation of the left bar to start With Previous along with the right bar’s motion path animation.
- This way, both bars slide out together on a single click, creating a harmonious reveal.
13. Copy and Paste Labels
To complete the infographic, copy the product labels and bubbles from a previous slide and paste them onto your current slide:
- Remove any animations from the pasted labels if necessary.
- Position them appropriately near the corresponding bars.
- This saves time and ensures consistent styling.
Frequently Asked Questions
Q1: What software version do I need to create these animations?
You’ll need a relatively recent version of Microsoft PowerPoint that supports motion path and wipe animations. PowerPoint 2016 and later versions fully support these features.
Q2: Can I customize the colors and shapes?
Absolutely! You can customize gradient fills, shapes, sizes, and text to match your branding or presentation style. The tutorial uses gradient fills for a modern look, but you can use solid colors or images if preferred.
Q3: How do I create my own slide layouts and grids?
The tutorial references a free PowerPoint Masterclass on Skillshare that teaches how to create slide layouts and grids using the Slide Master view. This is a powerful way to maintain consistency across your presentation.
Q4: What is the BrightSlide add-in and how does it help?
BrightSlide is a free PowerPoint add-in that adds many productivity features, including selecting objects by fill color, aligning shapes more easily, and using keyboard shortcuts to nudge objects precisely. It’s highly recommended for advanced PowerPoint users.
Q5: Can I add more than five animated bars?
Yes! By following the same process, you can add as many animated sliding bars as you need to display your data effectively.
Conclusion
Creating an eye-catching animated infographic in PowerPoint is easier than you might think with the right approach and techniques. By setting up a clean slide layout, designing cohesive shapes and labels, and combining motion path and wipe animations, you can craft professional and dynamic slides perfect for product comparisons, service highlights, or any side-by-side data visualization.
Remember to:
- Use grids and guides to keep your design aligned and consistent.
- Apply gradient fills and shadows thoughtfully for a modern aesthetic.
- Combine animations strategically to create smooth and polished effects.
- Use tools like BrightSlide to speed up your workflow and improve precision.
- Organize your slide elements and animations with the Selection Pane.
With these steps, you’ll not only deliver informative content but also impress your audience with engaging visuals that stand out.
Happy designing!
For more tutorials and free resources, check out One Skill PPT’s YouTube channel and explore their PowerPoint Masterclasses on Skillshare.


