

Creating a visually engaging and informative personal growth chart in PowerPoint can be a powerful way to showcase development stages, progress tracking, or step-by-step plans. Whether you are a student, professional, or coach, a well-designed growth chart can help communicate your ideas clearly and effectively.
In this comprehensive guide, I will walk you through the process of designing a personal growth chart in PowerPoint from scratch. You will learn how to incorporate custom shapes, icons, colors, and animations to build a dynamic and interactive slide. This tutorial is inspired by the techniques shared by POWERPOINT UNIVERSITY, a leading YouTube channel that offers over a thousand free PowerPoint templates and tutorials.
By the end of this guide, you will have a fully functional personal growth chart slide that you can customize for your own presentations, reports, or coaching sessions.
Table of Contents
- Preparing the Slide and Head Silhouette
- Creating Step Markers with Gradient Ovals and Icons
- Connecting Steps with Lines and Arrows
- Adding Titles and Detailed Text for Each Step
- Applying Animations for Interactivity
- Customizing Colors and Icons
- Final Tips for a Polished Growth Chart
- Frequently Asked Questions (FAQ)
Preparing the Slide and Head Silhouette
The first step in creating a personal growth chart is setting up your PowerPoint slide and adding a meaningful visual element. In this case, a head silhouette is used as a central graphic to symbolize personal growth and mental development.
- Insert a New Slide: Open PowerPoint and add a new blank slide to your presentation.
- Search for a Head Silhouette Image: Go to Insert > Pictures > Online Pictures. In the search box, type head silhouette to find suitable images.
- Select and Insert the Image: Choose a silhouette with a black outline and a white background for better contrast on your slide. Insert the image into your slide.
- Resize the Image: Hold the Shift key while dragging the corner to maintain aspect ratio and increase the size as needed.
- Crop the Image: Use the crop tool to adjust the image, especially if you want to remove unwanted parts such as the top of the head.
- Flip the Image Horizontally: To change the orientation, right-click the image, select Format Picture, and under the Rotate option, choose Flip Horizontal.
- Trim the Top of the Silhouette: To cut off the top part of the head, insert a rectangle shape over the area you want to remove. Select both the rectangle and the head silhouette image, then go to Shape Format > Merge Shapes > Subtract. This operation creates a custom-cut silhouette.
- Keep Background Consistent: If your slide background is white, keep the silhouette background white to blend seamlessly.
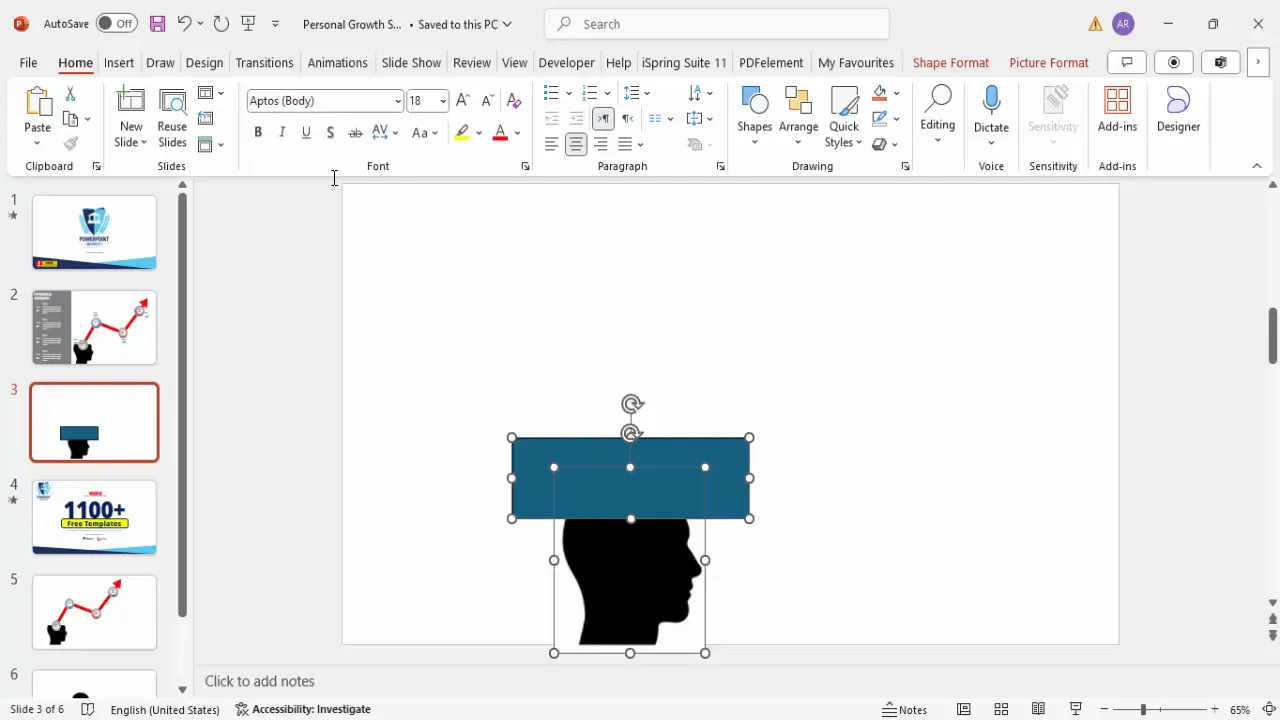
This process results in a clean, flipped, and cropped head silhouette that serves as the foundation of your personal growth chart.
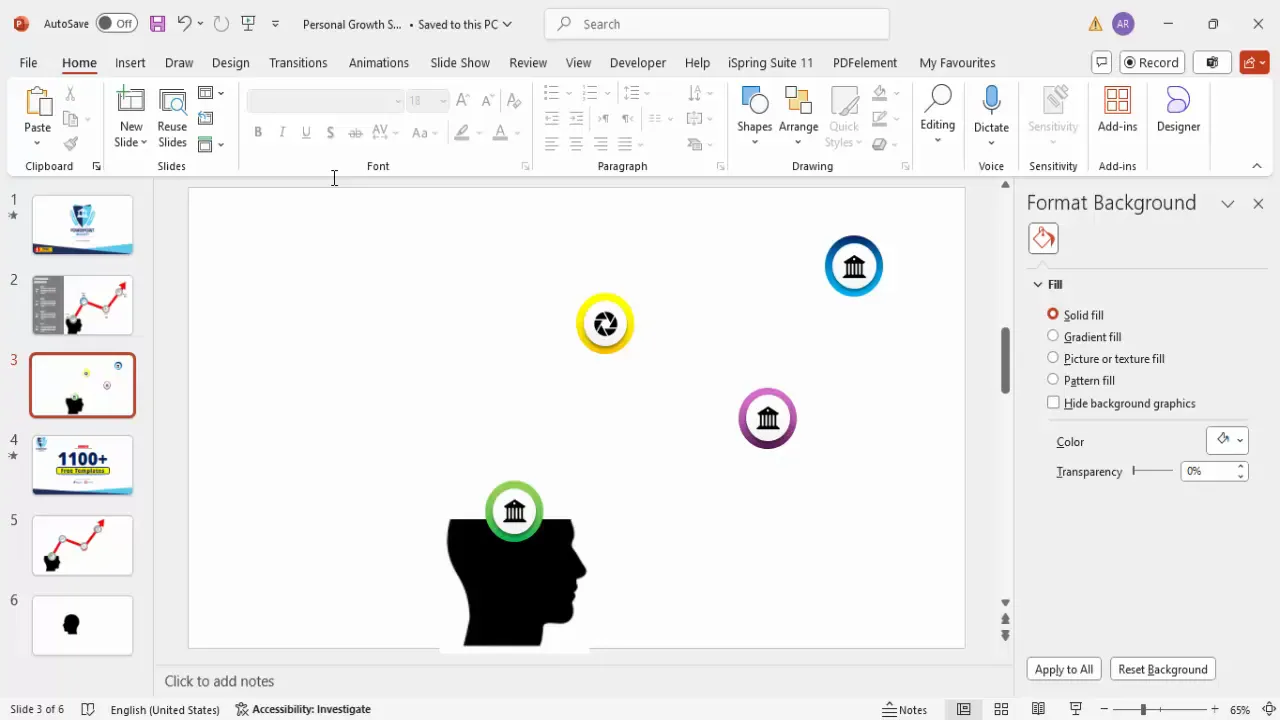
Creating Step Markers with Gradient Ovals and Icons
Next, you will create the visual markers representing each step in the growth process. These markers will be elliptical shapes with gradient fills and embedded icons to enhance clarity and aesthetics.
- Insert an Oval Shape: Go to Insert > Shapes > Oval. Draw an oval on your slide where you want the first step marker.
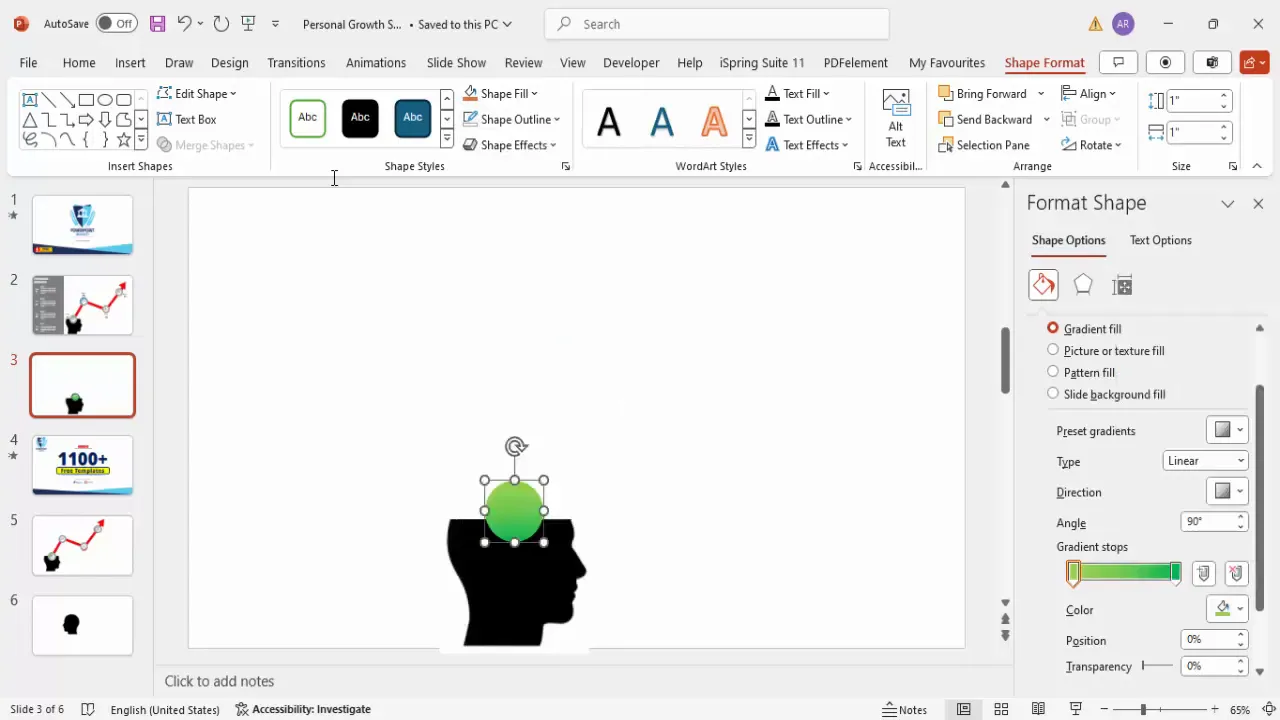
- Apply Gradient Fill: Right-click the oval and select Format Shape. Under Fill, choose Gradient Fill. By default, there are four gradient stops; reduce this to two for a smooth gradient transition.
- Choose Gradient Colors: For example, use a dark green for the first gradient stop and a light green for the second. This creates a visually appealing depth effect.
- Remove Outline: Set the shape outline to No Outline for a clean look.
- Duplicate the Oval: Press Ctrl + D to duplicate the oval. Reduce the size of the duplicate and position it exactly on top of the original oval to create a layered effect.
- Apply Shadow to Smaller Oval: Select the smaller oval, go to Format Shape > Effects > Shadow, and choose the Offset Bottom preset. This adds a subtle shadow for depth.
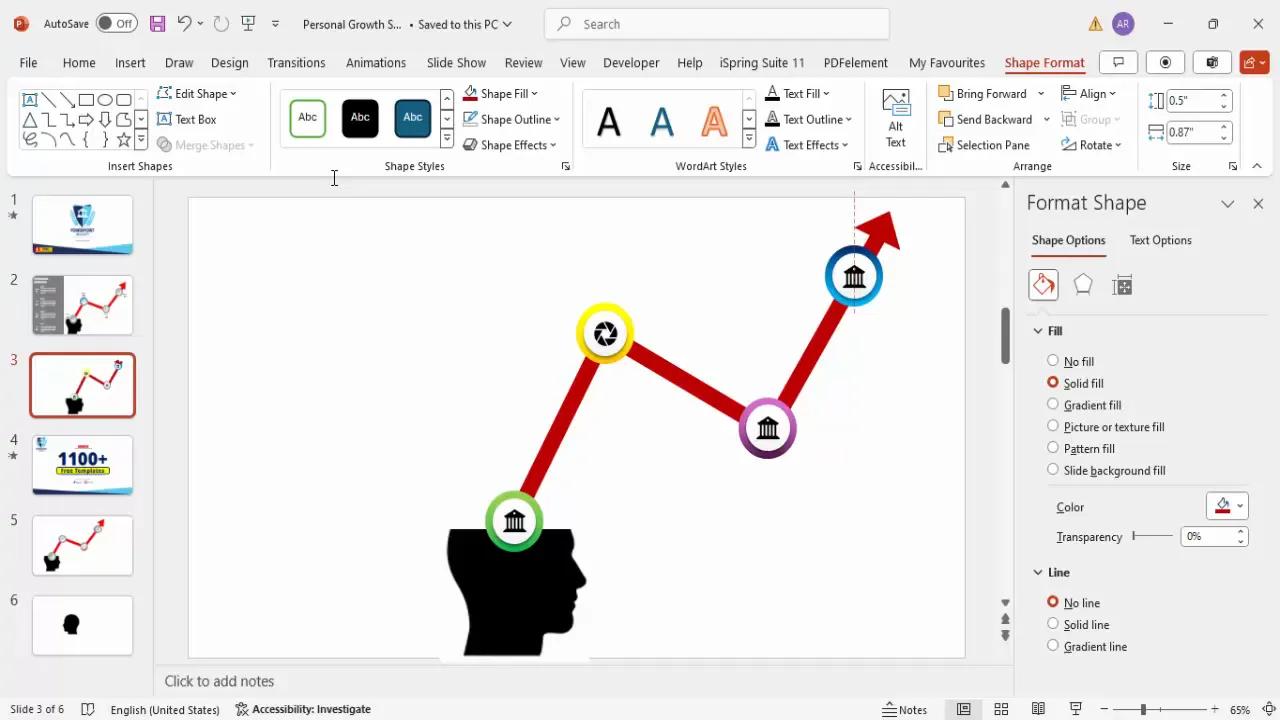
- Add Icons Inside Ovals: Go to Insert > Icons and select an icon that represents your step (e.g., a building for foundation or growth). Insert the icon and resize it to approximately 0.5 inches in height and width. Align it centrally inside the oval.
- Group the Shapes: Select the two ovals and the icon, then press Ctrl + G to group them as a single step marker.
- Duplicate Step Markers: Duplicate the grouped shape three times for a total of four step markers. Arrange them vertically along the side of the silhouette or wherever fits your design.
These step markers serve as clickable or focal points that correspond with detailed descriptions and titles on the slide.
Connecting Steps with Lines and Arrows
To visually connect the steps and indicate progression, you will add a connecting line with an arrowhead.
- Insert a Freeform Line: Go to Insert > Shapes > Freeform: Shape. Click at the center of the first step marker, then click at the center of the next step marker to draw a connecting line. Double-click to end the line.
- Format the Line: Change the line color to a maroon or dark red. Increase the line width for visibility.
- Send Line to Back: Right-click the line and select Send to Back so it appears behind the step markers.
- Add Arrowhead: You can either add an arrowhead via the line’s endpoint by selecting the line, going to Shape Format > Shape Outline > Arrows, and choosing an end arrow style, or create a custom arrowhead using an isosceles triangle shape:
- Insert an isosceles triangle.
- Match the fill color with the line color and remove the outline.
- Rotate the triangle to point in the direction of progression.
- Position the triangle at the end of the line.
- Group the line and triangle together with Ctrl + G.
Connecting the steps with lines and arrows provides a clear visual pathway for the audience to follow the growth process.
Adding Titles and Detailed Text for Each Step
Now, it’s time to add descriptive content to explain each step in your personal growth chart.
- Add Step Numbers: Insert text boxes next to each step marker and type “Step 01,” “Step 02,” etc. Center-align the text and use a bold, clean font such as Open Sans Extra Bold. Adjust the font size to make it prominent.
- Add Titles: Below or beside the step numbers, add titles that summarize each step. Use the same font family but slightly smaller size. Make the titles bold and color them white if placed on a dark background.
- Add Detailed Text: Insert additional text boxes to include detailed descriptions for each step. Use a smaller font size (14-16 pt) and keep the text concise. White font color works well on gray or dark backgrounds.
- Create Background for Text: To enhance readability, draw rectangles behind the text content. Remove the outline and fill the rectangle with a gray or muted color.
- Align and Group: Align the step number, title, and detailed text neatly. Group related text boxes together for easier management and duplication.
- Duplicate for Other Steps: Select the grouped text elements for Step 1, then hold Ctrl + Shift and drag down to duplicate and position for Steps 2, 3, and 4. Update the text accordingly.
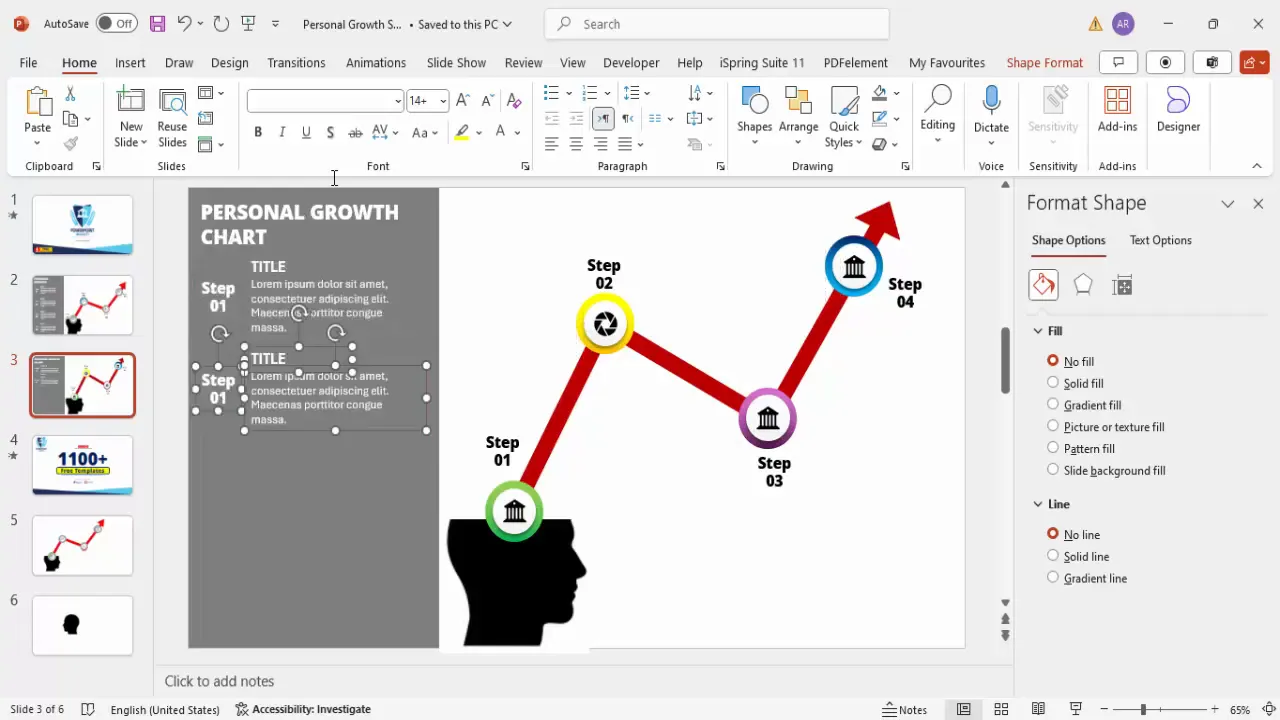
This structured layout helps your audience quickly grasp the key points and details of each personal growth stage.
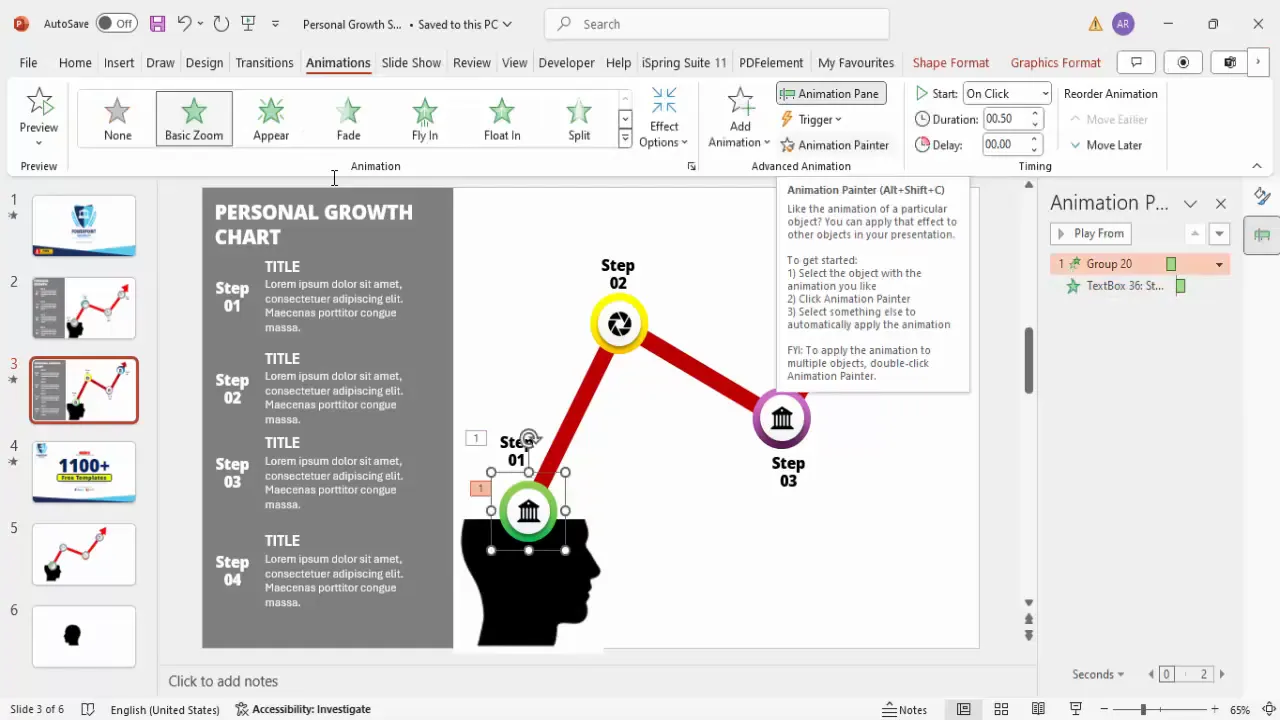
Applying Animations for Interactivity
Animations make your personal growth chart more engaging by revealing information step-by-step. Here’s how to add basic animations:
- Open Animation Pane: Go to the Animations tab and click on Animation Pane to manage all animations.
- Animate Step Markers: Select the first step marker group and apply an entrance animation such as Zoom. Choose Start: On Click.
- Animate Step Numbers: Select the step number text box and apply an entrance animation like Stretch. Set it to Start: After Previous for smooth sequencing.
- Copy Animations: Use the Animation Painter tool to copy the animations from Step 1 to Steps 2, 3, and 4 to maintain consistency.
- Animate Connecting Arrow: Select the connecting line and apply a Wipe animation, preferably from bottom or left, and set it to Start: After Previous.
- Optional Text Animation: You can also animate the detailed text boxes to appear simultaneously with the step titles or after a delay.
These animations ensure your audience’s focus moves naturally from one step to the next, enhancing comprehension and retention.
Customizing Colors and Icons
Personalizing your growth chart with distinct colors and icons can make it more relevant and visually appealing. Here are some tips:
Create Slides in Seconds with ExpertSlides AI |
|
Generate AI Presentations today: |
| TRY NOW! |
- Change Icon Graphics: Select any icon, go to Graphic Format > Change Graphic, and choose an icon that better represents the step’s concept.
- Adjust Icon Colors: Use the Graphic Fill option to apply colors that match your theme or brand palette, such as orange, purple, or blue.
- Modify Gradient Colors: Experiment with different gradient fills on the oval shapes to differentiate steps or indicate progression.
- Use Consistent Fonts: Stick to one or two fonts for titles and text to maintain a clean, professional look.
- Match Arrows and Lines: Ensure the connecting arrows use colors that stand out but complement the overall design.
Customizing these elements helps you tailor the chart to your audience and presentation style.
Final Tips for a Polished Growth Chart
- Keep Text Concise: Avoid overwhelming your slide with too much text. Use bullet points or short sentences for clarity.
- Maintain Alignment: Use PowerPoint’s alignment guides to keep all elements neatly spaced and aligned.
- Use Grouping: Group related elements to move and animate them easily.
- Test Animations: Preview your slide in slideshow mode to ensure animations flow smoothly.
- Use White Space: Don’t overcrowd your slide; allow breathing room for better visual balance.
With these tips, your personal growth chart will look professional, clear, and engaging.
Frequently Asked Questions (FAQ)
What is a personal growth chart and why should I use it?
A personal growth chart is a visual representation of stages, steps, or milestones in an individual’s development or progress. It helps communicate complex growth processes clearly and motivates viewers by showing tangible progress.
Can I use any image for the head silhouette?
Yes, but it’s best to choose a simple, high-contrast silhouette with a white or transparent background for seamless integration into your slide.
How do I make the chart interactive in PowerPoint?
By using animations and triggers, you can make each step appear on click, allowing you to control the flow of information during your presentation.
Can I customize the colors and icons?
Absolutely! PowerPoint allows you to change gradient fills, icon graphics, and colors to suit your branding or presentation theme.
Is this growth chart suitable for all presentation types?
Yes, it’s versatile enough for educational, corporate, coaching, or personal development presentations.
Where can I find free templates for similar charts?
Many creators, including POWERPOINT UNIVERSITY, offer free downloadable templates. You can also explore online resources and Microsoft’s template library.
How can I improve my PowerPoint design skills further?
Practice regularly, explore tutorials, use templates as learning tools, and focus on consistent fonts, colors, and alignment to enhance your presentation quality.
Conclusion
Designing a personal growth chart in PowerPoint is a practical way to visually communicate development stages and plans. By following this detailed guide, you can create a customized, animated, and professional slide that impresses your audience and clarifies your message.
Remember to start with a strong visual foundation like the head silhouette, build step markers with gradient shapes and icons, connect them with lines and arrows, add clear text descriptions, and bring it all to life with animations. Customize colors and icons to fit your style, and keep your design clean and aligned for maximum impact.
With practice, your personal growth charts will become powerful tools in your presentations, helping you engage and inspire your audience effectively.
Check out the full video: How to Create Personal Growth Chart in PowerPoint


