
Creating visually appealing and informative charts in PowerPoint can significantly enhance your presentations, especially when illustrating concepts like personal growth. In this comprehensive tutorial, I’ll walk you through the process of designing a personal growth chart in PowerPoint from scratch. This step-by-step guide will not only help you build a dynamic and engaging slide but also teach you how to use PowerPoint’s powerful tools for shapes, icons, colors, and animations to bring your ideas to life.
This tutorial is perfect for anyone looking to master Powerpoint Chart Slides Design to create impactful presentations that communicate progress, development, or step-by-step processes in a clear and professional way.
Table of Contents
- Getting Started: Setting Up Your PowerPoint Slide
- Inserting and Editing the Head Silhouette Image
- Designing Option Markers with Shapes and Icons
- Connecting Steps with Lines and Arrows
- Adding Titles and Descriptive Text Boxes
- Applying Basic Animations for Interactivity
- Frequently Asked Questions
- Conclusion: Final Tips for Powerpoint Chart Slides Design
Getting Started: Setting Up Your PowerPoint Slide
The first step in creating your personal growth chart is to prepare a fresh canvas in PowerPoint where you will build all your elements.
- Add a new slide: Open your PowerPoint presentation and insert a new blank slide. This will be your working space.
- Set the background: For this tutorial, a white background is ideal as it keeps the design clean and professional.
These simple settings create a neutral base for your design and ensure that the colors and shapes you add later stand out clearly.
Inserting and Editing the Head Silhouette Image
The centerpiece of the personal growth chart is a head silhouette image, which visually represents the concept of personal development and mental growth.
- Insert the head silhouette: Go to Insert > Pictures > Online Pictures. Type head silhouette in the search box to find suitable images.
- Select and insert: Choose a black silhouette with a white background for clarity. Insert it into your slide.
- Resize proportionally: Hold the Shift key while dragging the corner handles to enlarge the image without distorting it.
- Crop the image: Use the crop tool to remove unnecessary parts and focus on the head’s outline.
- Flip horizontally: Rotate the silhouette by flipping it horizontally for the desired orientation.
- Cut the top part: Insert a rectangle shape over the top section of the silhouette, then use Shape Format > Merge Shapes > Subtract to cut it off, creating a clean, stylized look.
- Keep the white background: Since the slide background is white, you can keep the image’s white background to blend seamlessly.
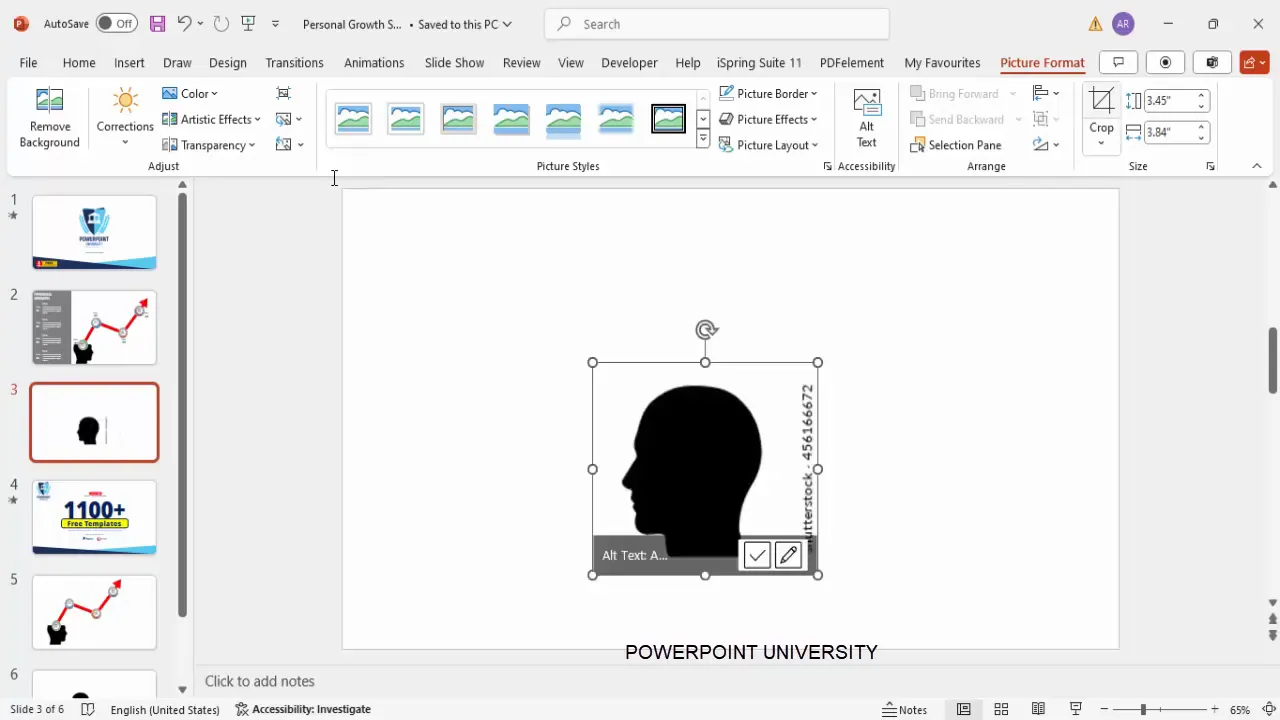
This head silhouette will act as the anchor for your growth steps and options, so positioning and sizing it correctly is crucial.
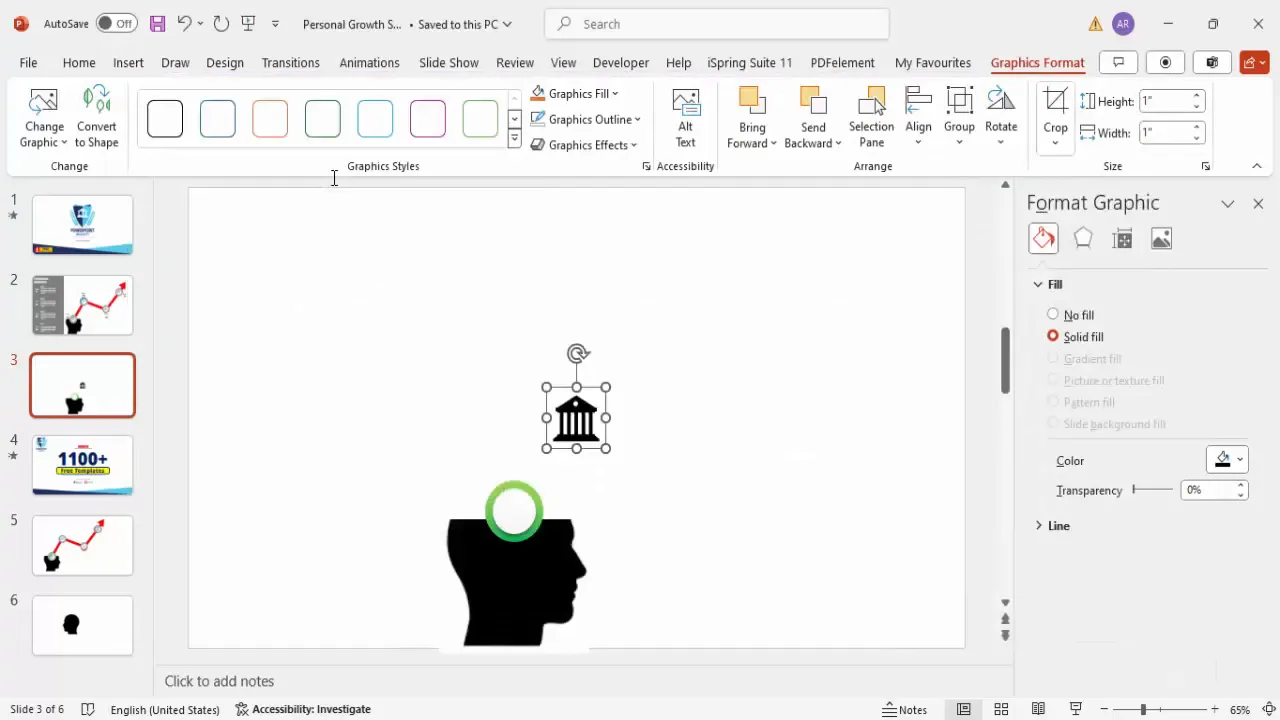
Designing Option Markers with Shapes and Icons
Next, you’ll create the markers that represent each step in the personal growth chart. These options will be visually distinct with colors, gradients, icons, and shadows, making the slide more engaging.
Step 1: Create the base oval shape
- Go to Insert > Shapes and select the oval shape.
- Draw an oval shape on the slide where you want the first step marker.
- Apply a gradient fill by right-clicking the shape, selecting Format Shape, and choosing Gradient Fill.
- Reduce the gradient stops from four to two for a simpler effect.
- Choose two complementary colors—for example, a dark green and a light green—to create a visually appealing gradient.
- Remove the shape outline by setting it to No Outline.
Step 2: Add a smaller overlay oval with shadow
- Duplicate the original oval by pressing Ctrl + D.
- Resize the duplicate to be smaller and place it exactly on top of the original oval.
- Fill this smaller oval with a light gray to white gradient.
- Add a shadow effect by clicking Format Shape > Effects > Shadow and selecting the Offset Bottom preset.
Step 3: Insert an icon in the center
- Go to Insert > Icons and search for an icon that fits the theme of your step—such as a building icon for growth or progress.
- Insert the icon and resize it to approximately 0.5 inches height and width.
- Center the icon in the middle of the oval shapes.
Step 4: Group the shapes and icon
Select the oval shapes and the icon, then group them together with Ctrl + G. This makes duplication and movement easier.
Step 5: Duplicate and customize remaining steps
- Duplicate the grouped option marker for each additional step (e.g., step two, step three, step four).
- Position them vertically or horizontally as per your design layout.
- Customize the gradient colors and icons for each step to differentiate them clearly.
Using different color combinations and icons for each step adds visual interest and helps users quickly recognize each stage.
Connecting Steps with Lines and Arrows
To visually link the steps and indicate progression, you’ll add connecting lines and arrows.
- Go to Insert > Shapes and select the freeform line tool.
- Click at the center of the first option marker, then click again just outside the marker to create a short connecting line.
- Double-click to end the line.
- Format the line with a maroon color or a dark red for contrast against the lighter option colors.
- Increase the line thickness for visibility.
- Send the line to the back so it doesn’t cover the option markers.
Adding an arrowhead
You have two options for arrowheads:
- Using line arrowheads: Select the line, go to Shape Outline > Arrows, and choose an arrowhead style. Increase the size for impact.
- Using a shape arrowhead: Insert an isosceles triangle shape, fill it with the same color as the line, rotate it to point in the desired direction, and place it at the end of the line. Group the line and arrowhead for easy movement.
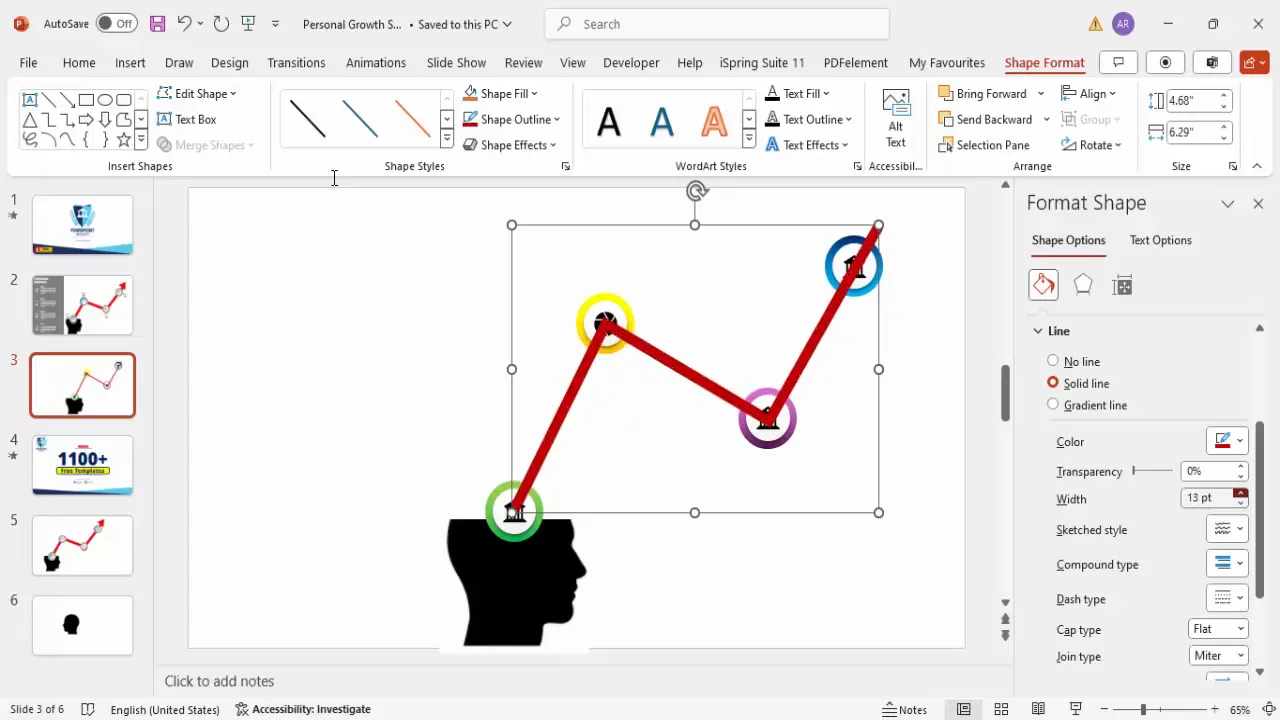
Connecting your steps with clear directional arrows guides the viewer through the process logically and visually.
Adding Titles and Descriptive Text Boxes
With your visual elements in place, it’s time to add text that explains each step in the personal growth chart.
- Add a title for the chart: Insert a rectangle shape at the top or side of the slide as a background for your main title.
- Fill the rectangle with a dark gray or contrasting color and remove the outline.
- Insert a text box on top of this shape and type “Personal Growth Chart” or your preferred title.
- Use a bold, clean font such as Open Sans Extra Bold in white for high contrast.
Creating step titles and detailed descriptions
- For each step, insert a rectangle shape with a dark fill color as a background for the text.
- Insert two text boxes on top of each rectangle:
- One for the step title (e.g., “Step 1”)
- One for the detailed description or explanation of the step.
- Use white font for readability against the dark background.
- Adjust the font size to around 14-16 points for the detailed text and larger for the step titles.
- Align all text boxes neatly for a professional look.
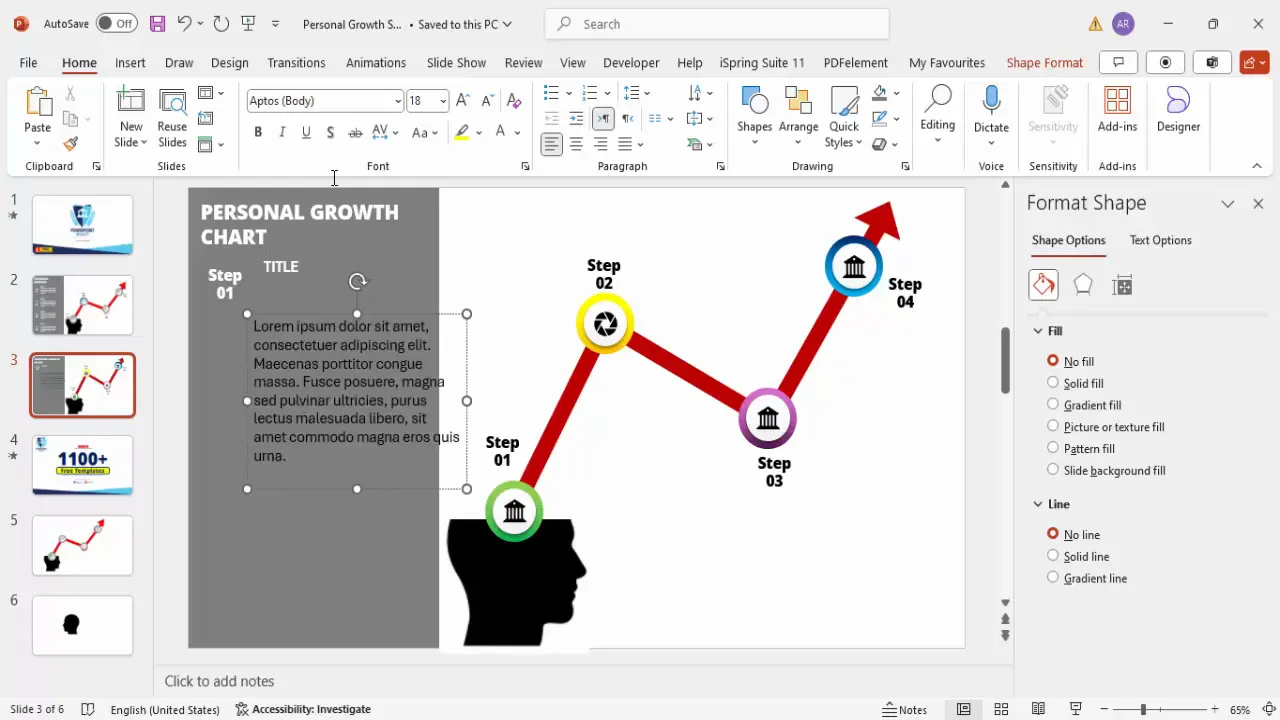
Careful alignment and consistent font choice improve the overall presentation quality and ensure your audience easily understands the chart.

Applying Basic Animations for Interactivity
Animations bring your personal growth chart to life by controlling how and when each element appears, making your presentation dynamic and engaging.
Enabling the animation pane
Go to the Animations tab and open the animation pane to manage your animations effectively.
Animating the head silhouette and options
- Select the head silhouette image and apply an entrance animation, such as Zoom.
- Apply entrance animations to the step option markers, using effects like Stretch or Fade.
- Set the animations to trigger After Previous for smooth, sequential flow.
- Use the animation painter tool to quickly copy animations from one step to the others.
Animating connecting arrows and text
- Apply a Wipe animation to the connecting arrows, choosing the direction from bottom or left for natural flow.
- Synchronize the appearance of detailed text boxes with the corresponding step animations for clarity.
- Adjust timings so that each step’s visual and textual elements appear cohesively.

Animations should enhance your presentation without overwhelming it. Keep effects smooth and purposeful to maintain professionalism.
Frequently Asked Questions
Q1: Can I use other images instead of a head silhouette for the growth chart?
Yes! While the head silhouette is symbolic of personal growth, you can use any image or shape that aligns with your theme, such as a tree, ladder, or mountain. Just make sure it fits well with the overall design and message.
Q2: How do I ensure the colors I select look good together?
Use complementary or analogous color schemes for harmony. Tools like Adobe Color or Coolors can help you generate palettes. Also, test your colors on a white background to check for contrast and readability.
Q3: Can I customize the icons for each step?
Absolutely! PowerPoint allows you to insert and change icons easily. Choose icons that visually represent the concept of each step to make your chart more intuitive.
Q4: What if I want to add more than four steps?
You can duplicate the option markers and text boxes to add as many steps as needed. Just ensure the slide remains uncluttered and visually balanced.
Q5: How do I make sure animations work smoothly during my presentation?
Preview your animations using the animation pane and slide show mode. Adjust timings and trigger settings as needed. Avoid overly complex animations to maintain a professional appearance.
Conclusion: Final Tips for Powerpoint Chart Slides Design
Designing a personal growth chart in PowerPoint is a great way to visually communicate progress, development, or multi-step processes. By combining thoughtful image selection, creative shapes, meaningful icons, and smooth animations, you can create a slide that captivates and educates your audience.
Remember these key takeaways for effective Powerpoint Chart Slides Design:
- Start with a clean, simple background to focus attention on your content.
- Use shapes and icons strategically to create visually distinct steps.
- Apply consistent color schemes and fonts for a professional look.
- Connect elements logically with lines and arrows to guide viewers.
- Enhance engagement with subtle, purposeful animations that support your narrative.
With these techniques, you can build compelling presentations that clearly convey your message and leave a lasting impression.
Feel free to explore and customize your designs further using PowerPoint’s versatile tools. Your creativity combined with these foundational steps will ensure your personal growth charts—and any other PowerPoint chart slides—stand out with clarity and style.
Check out the full video: How to Create Personal Growth Chart in PowerPoint


