

Creating clear and visually appealing flowcharts is essential for illustrating business processes effectively. Whether you’re mapping out decision points, workflows, or actions, a well-designed flowchart can make complex processes easier to understand and communicate. In this comprehensive guide, we’ll walk through how to create a professional business process flowchart using Microsoft PowerPoint in just five minutes. This tutorial is inspired by the expert instructions from POWERPOINT UNIVERSITY, a leading resource for PowerPoint tutorials and free templates.
By following this article, you will learn how to design a simple yet effective process flowchart that includes starting points, decision nodes, multiple process paths, and final actions—all using PowerPoint’s built-in shapes and tools. You will also discover tips for aligning, grouping, and connecting shapes with arrows to build a cohesive flowchart design.
Table of Contents
- Why Use PowerPoint for Flowcharts?
- Getting Started: Adding and Formatting Shapes
- Creating the Start and End Points
- Designing the Process Steps
- Adding Decision Points
- Incorporating Actions After Decisions
- Connecting Shapes with Arrows
- Tips for Aligning and Spacing Elements
- Grouping and Formatting for Easy Editing
- Enhancing Flowcharts with Icons
- Frequently Asked Questions (FAQ)
- Conclusion
Why Use PowerPoint for Flowcharts?
PowerPoint is often underestimated as a tool for creating flowcharts, but it offers several advantages that make it an excellent choice for designing business process diagrams:
- Accessibility: Most professionals already have PowerPoint installed, making it easy to create and share flowcharts without specialized software.
- Ease of Use: PowerPoint’s intuitive interface allows users to drag, drop, and format shapes quickly.
- Customization: You can customize colors, fonts, and styles to match your brand or presentation theme.
- Integration: Flowcharts created in PowerPoint can be seamlessly integrated into presentations, reports, and training materials.
- Free Resources: Channels like POWERPOINT UNIVERSITY provide free templates and tutorials that speed up the design process.
With these benefits, PowerPoint is an ideal starting point for beginners and professionals alike to craft effective flowcharts.
Getting Started: Adding and Formatting Shapes
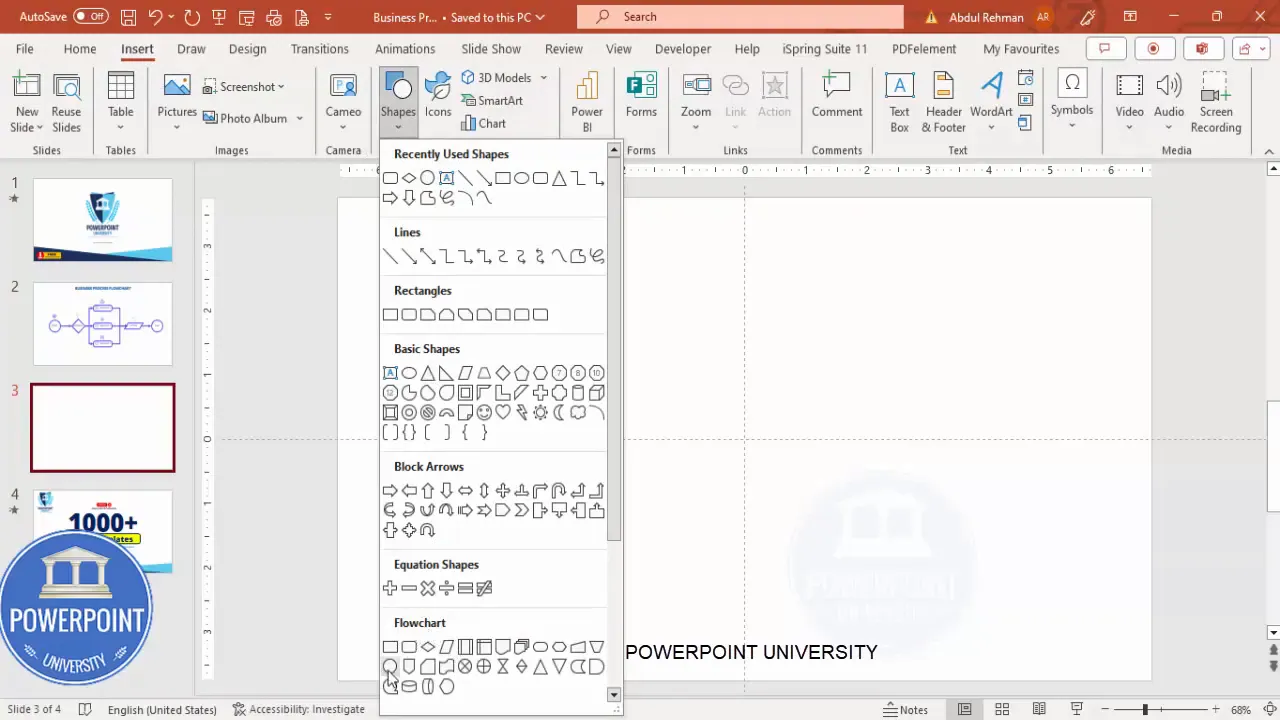
The foundation of any flowchart is its shapes. PowerPoint offers a variety of shapes specifically designed for flowcharts under the “Flowchart” section of the shapes menu. Here’s how to get started:
- Add a New Slide: Start fresh by inserting a new blank slide into your presentation.
- Enable Guides: Navigate to the View tab and enable Guides to help align shapes precisely.
- Insert Shapes: Go to Insert > Shapes. You can select from Basic Shapes or the dedicated Flowchart group.
- Choose Shapes: Hold the Shift key while drawing to keep proportions consistent.
- Format Shapes: Customize the Shape Outline and Shape Fill colors. For this tutorial, a consistent blue color scheme is used to maintain a professional look.
- Add Text: Insert text boxes to label each shape clearly. Use the same font and color as your shapes for consistency.
Creating the Start and End Points
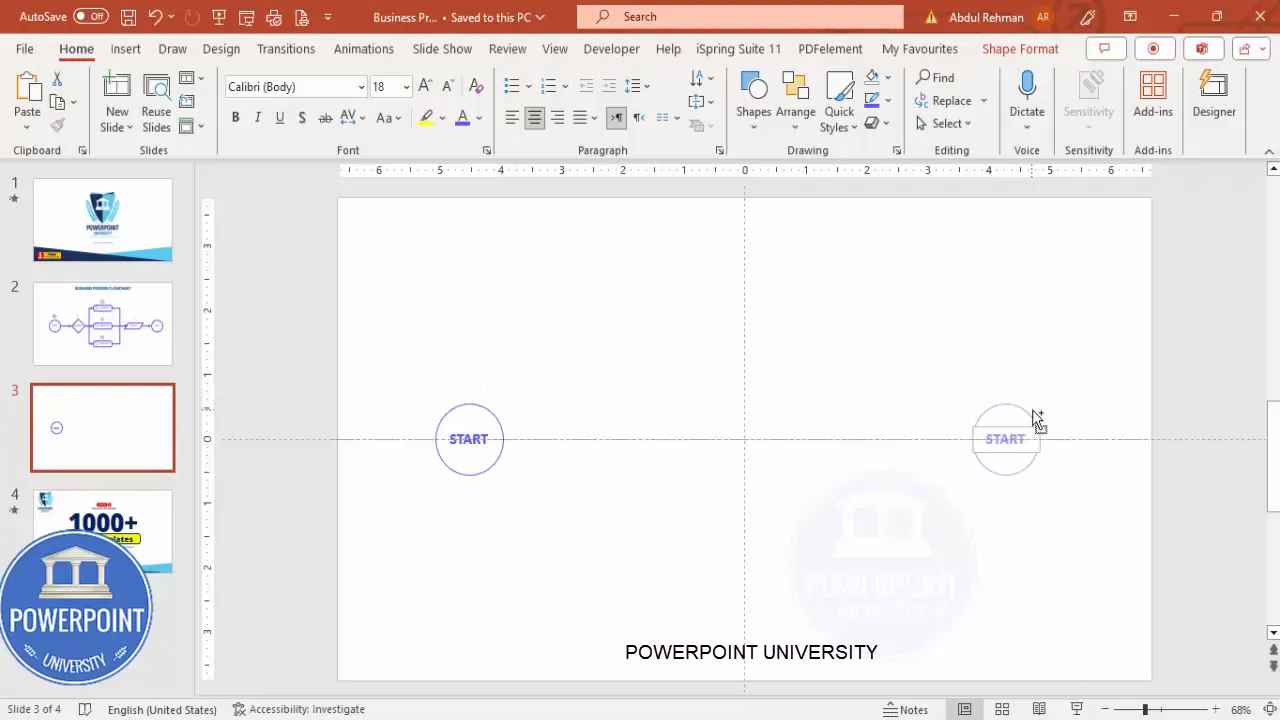
Every process flowchart begins with a start point and ends with an end point. These are typically represented by rounded rectangles or ovals to distinguish them from other steps.
- Start Point: Insert a rounded rectangle or oval shape and fill it with blue. Add the label “Start” in a matching blue font, center-aligned and optionally bolded for emphasis.
- Grouping: Select both the shape and text box, then press
Ctrl + Gto group them. This makes it easier to move and resize the start point as a single unit. - End Point: Duplicate the start shape by holding
Ctrl + Shiftand dragging it to a new position. Change the label to “End.”
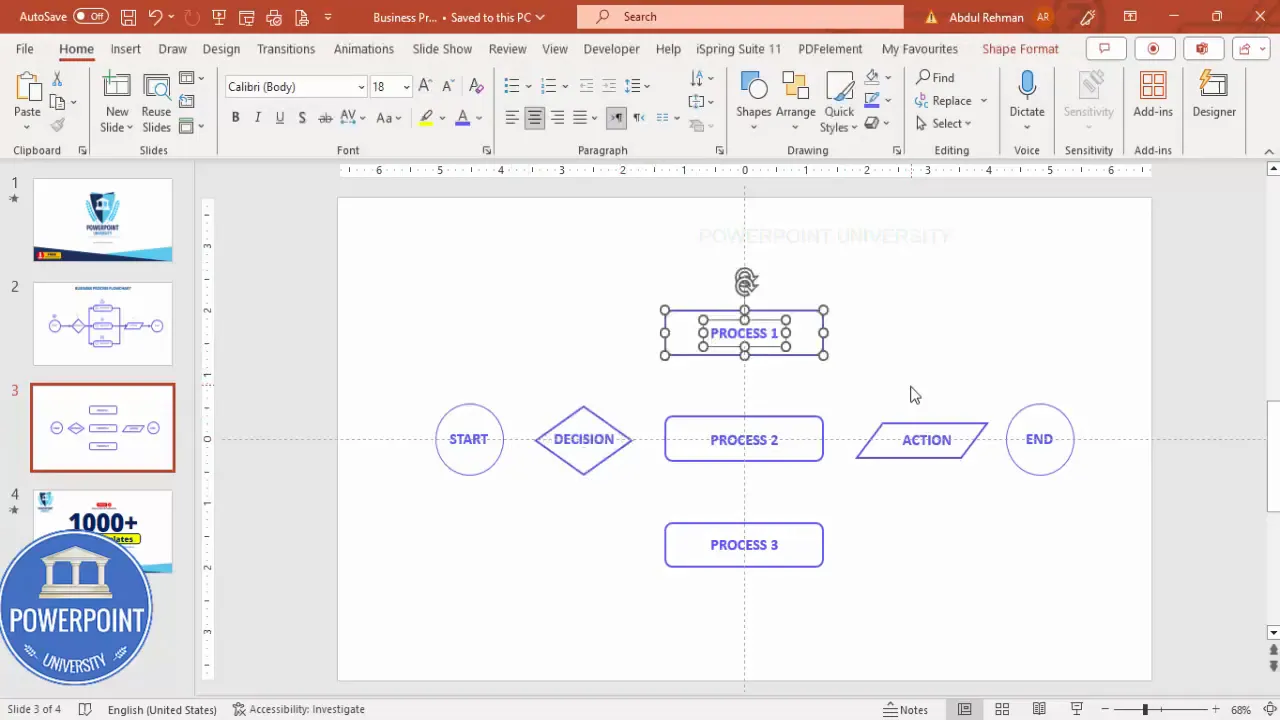
Designing the Process Steps
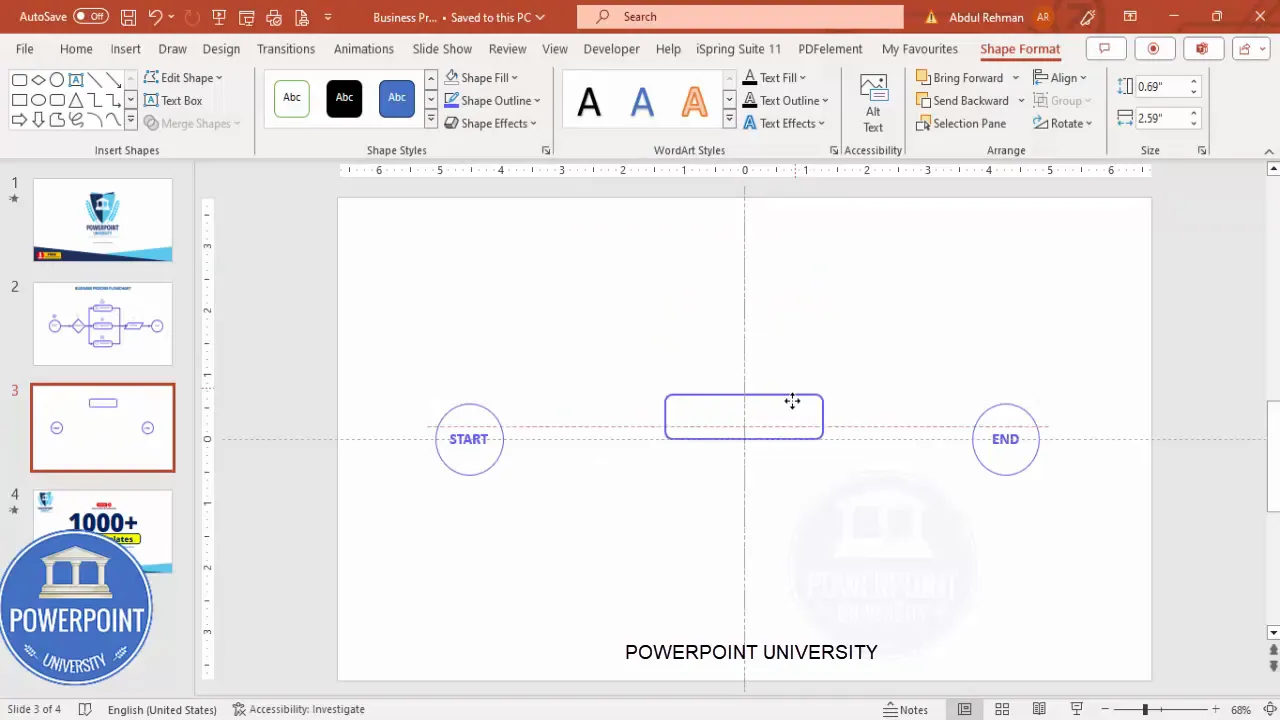
Next, create the process steps that will follow the decision point. These steps typically use the “Alternate Process” shape from the flowchart shapes menu.
- Insert Three Process Shapes: Select the “Alternate Process” shape and insert three copies representing Process 1, Process 2, and Process 3.
- Formatting: Apply a blue outline with no fill for a clean, professional look. Increase the outline weight if desired for better visibility.
- Alignment: Place the first process shape in the center below the decision diamond (which will be added next), then duplicate and drag the other two upward and downward respectively, maintaining equal vertical spacing.
- Labeling: Add text boxes for “Process 1,” “Process 2,” and “Process 3,” ensuring the text is centered within each shape.
Adding Decision Points
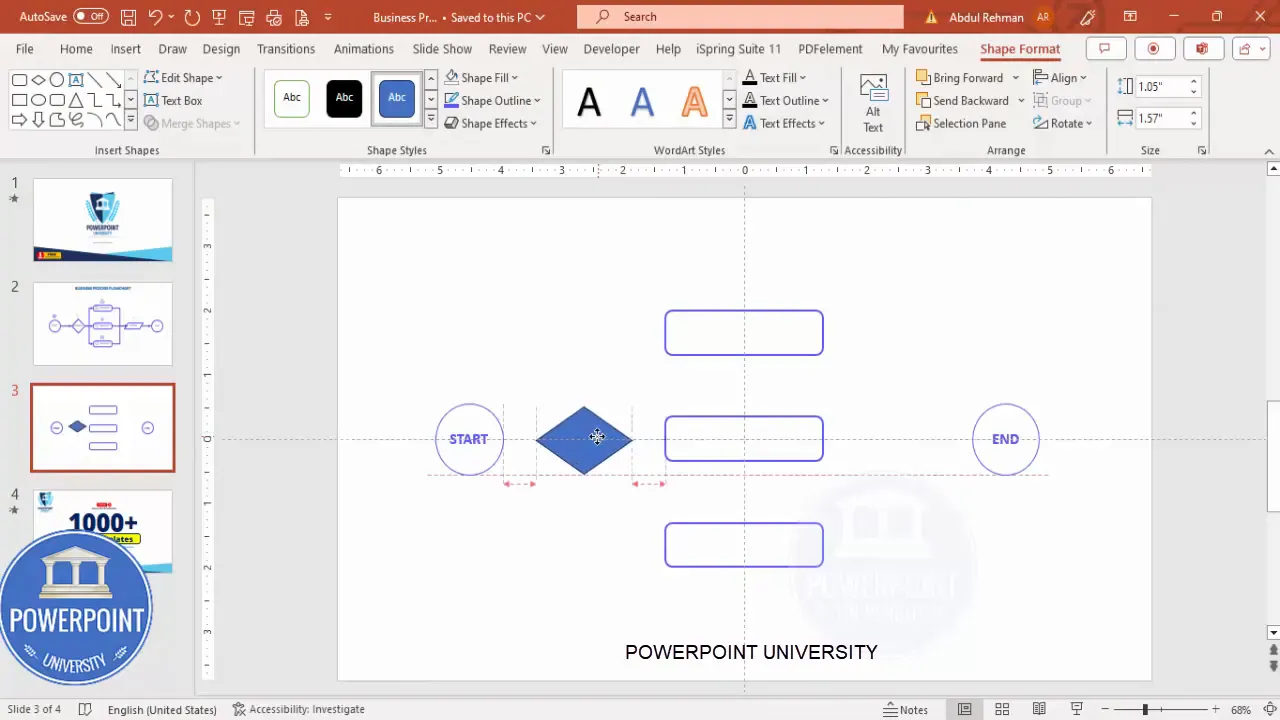
Decision points are crucial for mapping out divergent paths in a process. In flowcharts, these are represented by diamond shapes.
- Insert a Diamond Shape: From the flowchart shapes, select the diamond shape and hold Shift while drawing to keep it proportional.
- Position: Place the diamond centrally between the start point and the process steps.
- Label: Add a text box with the word “Decision” and center it inside the diamond.
- Duplicate: Use
Ctrl + Dto duplicate the decision shape if needed for labeling or connecting paths.
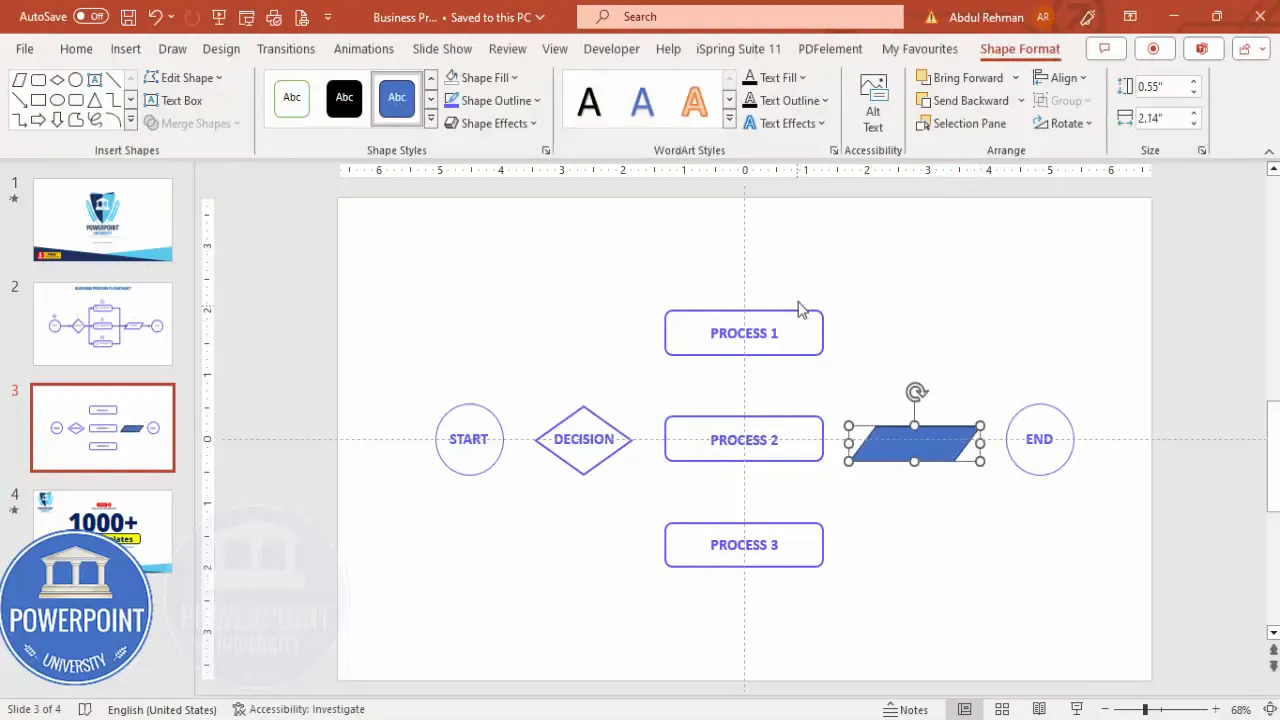
Incorporating Actions After Decisions
After decisions are made, the next logical step is to depict the actions that result from each process path.
- Choose Action Shapes: PowerPoint’s flowchart shapes include a “Data” shape that works well for representing actions.
- Insert and Position: Place action shapes to the right of each process step, ensuring alignment and sufficient spacing.
- Label: Add text boxes labeled “Action” inside each shape.
- Formatting Consistency: Use the format painter tool to copy the style from one action shape to others, ensuring uniformity.
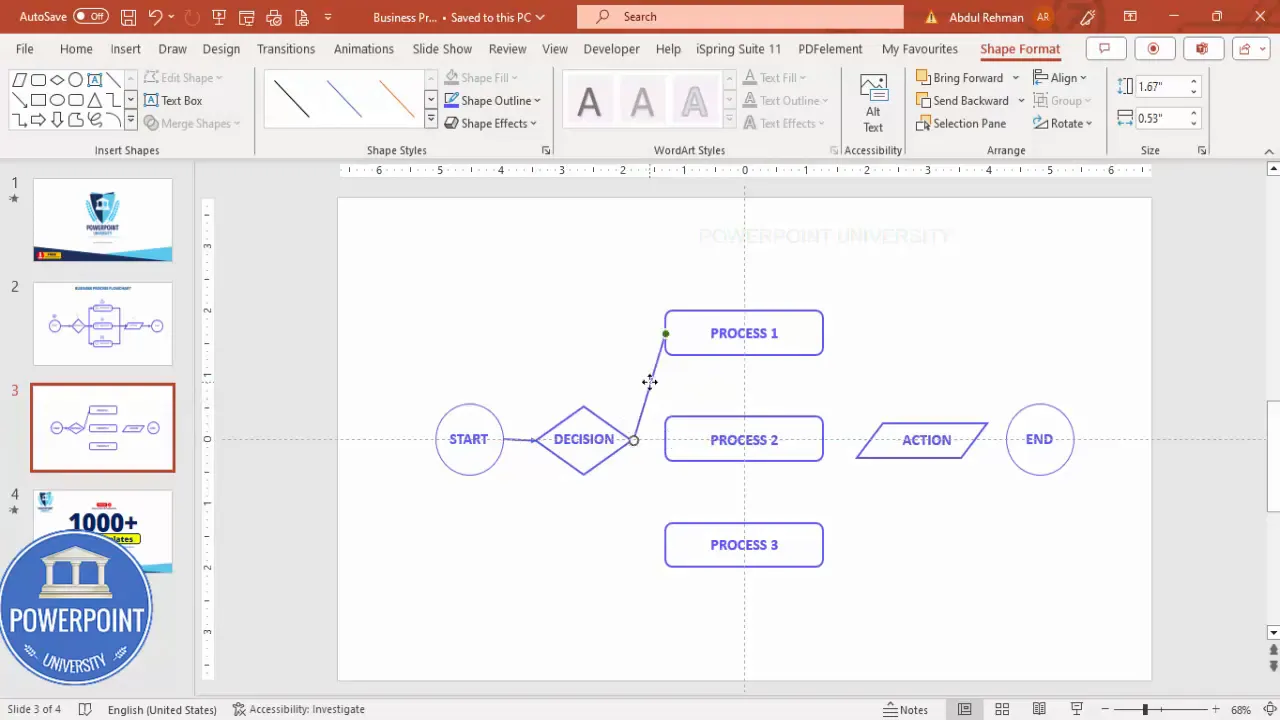
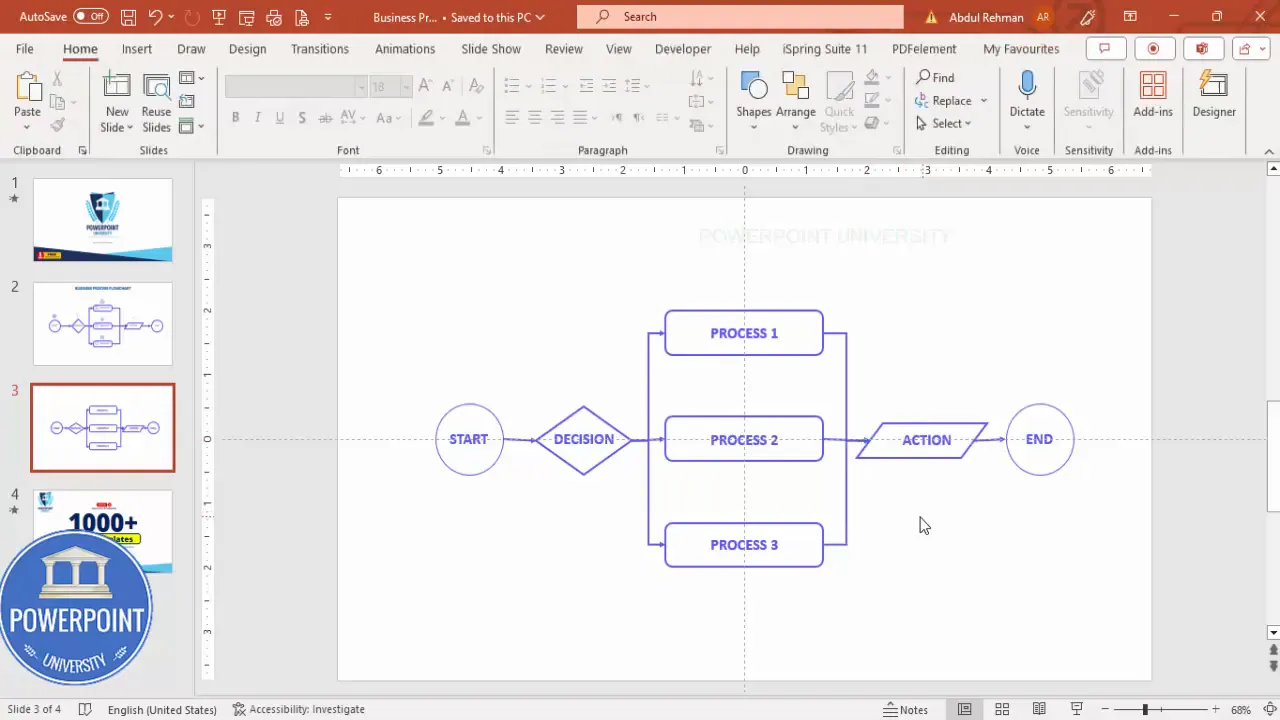
Connecting Shapes with Arrows
Arrows are essential in flowcharts to indicate the direction of the process flow and decision outcomes. PowerPoint provides line arrows that can be customized for clarity.
- Insert Arrow Lines: Go to Insert > Shapes > Lines, and select the arrow line.
- Draw Connections: Connect the start shape to the decision diamond, the decision to each process step, and each process step to its corresponding action.
- Customize Arrows: Set the arrow color to match the flowchart’s blue theme and increase the line weight for visibility.
- Use Connector Types: Right-click arrows and select Connector Type > Elbow for neat right-angle connections that improve readability.
- Duplicate Arrows: Use
Ctrl + Dto quickly duplicate arrows and adjust their positions.
Tips for Aligning and Spacing Elements
Uniform alignment and consistent spacing are critical for professional-looking flowcharts. Here are some tips to achieve this:
- Enable Guides: Use PowerPoint’s guides and gridlines to snap shapes into place.
- Distribute Shapes Evenly: Select multiple shapes, right-click, and use the Distribute Vertically or Distribute Horizontally options.
- Use the Align Tool: Align shapes centrally or to the left/right edges to maintain neat columns or rows.
- Consistent Sizing: Hold the Shift key while resizing shapes to keep them proportional.
- Check Connectors: Ensure arrows connect perfectly to shape edges. Adjust connector types if lines don’t join properly.
Grouping and Formatting for Easy Editing
Grouping elements allows you to move or format multiple shapes and text boxes as a single object, making editing simpler and faster.
- Group Related Items: Select the shape and its label, then press
Ctrl + Gto group. - Group Sections: Group entire sections like all processes or all actions if you plan to move them together.
- Use Format Painter: Apply consistent formatting by copying styles from one shape and applying them to others.
- Lock Positions: Grouping helps prevent accidental misalignment when editing other parts of the flowchart.
Enhancing Flowcharts with Icons
Adding icons can make your flowchart more visually engaging and easier to interpret. Here’s how to incorporate icons:
Create Slides in Seconds with ExpertSlides AI |
|
Generate AI Presentations today: |
| TRY NOW! |
- Insert Icons: Use PowerPoint’s Insert > Icons feature to search for relevant symbols like arrows, checkmarks, or process-related images.
- Placement: Place icons near decision points or actions to reinforce the meaning.
- Maintain Style: Choose icons that match your flowchart’s color scheme and style for a cohesive look.
- Size Appropriately: Ensure icons are large enough to be visible but not overpowering the main flowchart elements.
Frequently Asked Questions (FAQ)
What is the best shape to start a flowchart in PowerPoint?
The best shape to start a flowchart is usually a rounded rectangle or oval, which clearly indicates the beginning of a process.
How do I ensure my connectors (arrows) attach correctly to shapes?
Use connector lines instead of simple lines. Right-click the connector, select Connector Type, and choose options like “Elbow” or “Straight” to ensure they snap to shape edges and move dynamically when shapes are repositioned.
Can I customize colors and fonts in flowchart shapes?
Yes, PowerPoint allows full customization of shape fills, outlines, and text fonts. Consistency in color and font choice is key to a professional look.
Is it better to group shapes in PowerPoint flowcharts?
Grouping is highly recommended as it simplifies moving, resizing, and formatting multiple elements together, reducing misalignment and saving time during edits.
How can I maintain equal spacing between shapes?
Select all shapes you want to space evenly, then use the Format > Align > Distribute Vertically or Distribute Horizontally option to space them equally.
Are there any free templates available for flowcharts?
Yes, many resources like POWERPOINT UNIVERSITY offer free downloadable flowchart templates that can be customized to fit your needs.
Conclusion
Creating a professional business process flowchart in PowerPoint is straightforward once you know the right steps and tools to use. By leveraging PowerPoint’s flowchart shapes, alignment guides, connector lines, and grouping features, you can design clear and visually appealing diagrams that help communicate complex processes efficiently.
Remember to start with a clear plan of your process, use consistent formatting, and check connections between shapes for clarity. Adding icons can further enhance understanding and engagement. With practice, you’ll be able to create these flowcharts in just minutes, making your presentations and business documents more effective.
For those looking to speed up their workflow, consider downloading free templates and exploring tutorials from trusted sources like POWERPOINT UNIVERSITY. These resources provide excellent starting points and inspiration for all skill levels.
Now that you have the tools and knowledge, open PowerPoint and start designing your flowchart today!
Check out the full video: PowerPoint Flow Chart in 5 minutes | Tutorial 1038


