
Creating visually compelling and informative slides in PowerPoint can truly elevate your presentations and engage your audience effectively. In this detailed guide, I’ll walk you through how to design a dynamic “4 Winning Race Options” infographic slide in PowerPoint, combining clear design principles with practical step-by-step instructions. This tutorial is inspired by the creative process developed by POWERPOINT UNIVERSITY, a channel dedicated to empowering you with professional PowerPoint skills and over a thousand free templates.
Whether you’re preparing a business pitch, project update, or any presentation requiring a race-themed infographic, this tutorial will help you create a clean, colorful, and animated slide that highlights four distinct options or steps. By the end, you’ll have a reusable template that you can customize with your own content and colors to fit various presentation needs.

Table of Contents
- Getting Started: Setting Up the Slide
- Creating the Running Icon
- Designing the Four Options with Parallelograms
- Cutting and Fragmenting Shapes for Custom Design
- Coloring and Adding Design Elements
- Adding Text Boxes and Option Numbers
- Adding the Finishing Ribbon Effect
- Animating the Slide with Morph Transition
- Frequently Asked Questions
- Conclusion
Getting Started: Setting Up the Slide
Begin by adding a new blank slide in your PowerPoint presentation. This gives you a clean canvas to start designing your infographic.
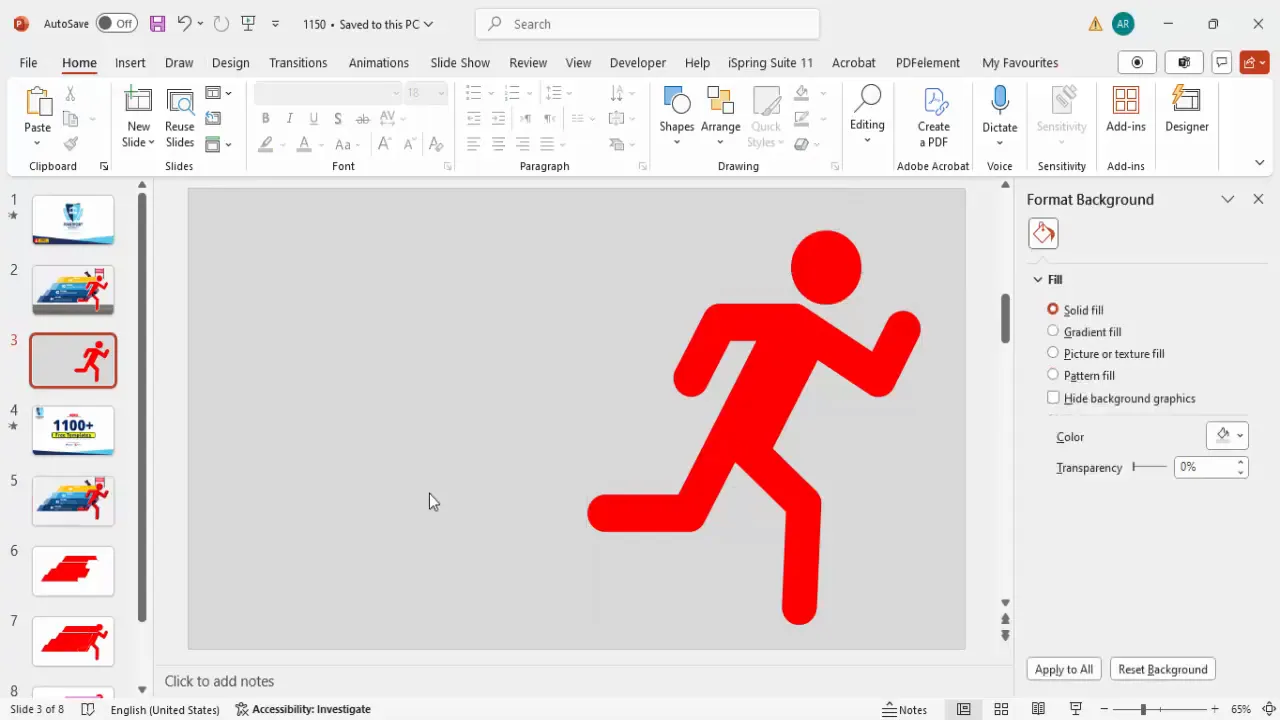
Next, change the background of the slide to a subtle gray tone. A neutral background helps your colorful elements stand out and maintains a professional look without overwhelming the viewer.
To change the background color:
- Right-click on the slide background and choose Format Background.
- Select Solid fill and pick a gray shade that’s neither too dark nor too light.
Position your work area slightly toward the right side of the slide. This gives ample space on the left for your main icon and lets the options spread out clearly.
Creating the Running Icon
To visually anchor your racing infographic, use a running person icon. PowerPoint’s icon library has a perfect choice for this.
Here’s how to insert and customize the running icon:
- Go to the Insert tab and select Icons.
- In the search box, type run to filter relevant icons.
- Select the running person icon and click Insert.
- Resize the icon by holding the Shift key (to maintain proportions) and dragging the corner outward.
- Position the icon on the left side of the slide, aligned vertically with your options area.
- Apply a bold red color to the icon for high visibility and to evoke a sense of urgency and energy.
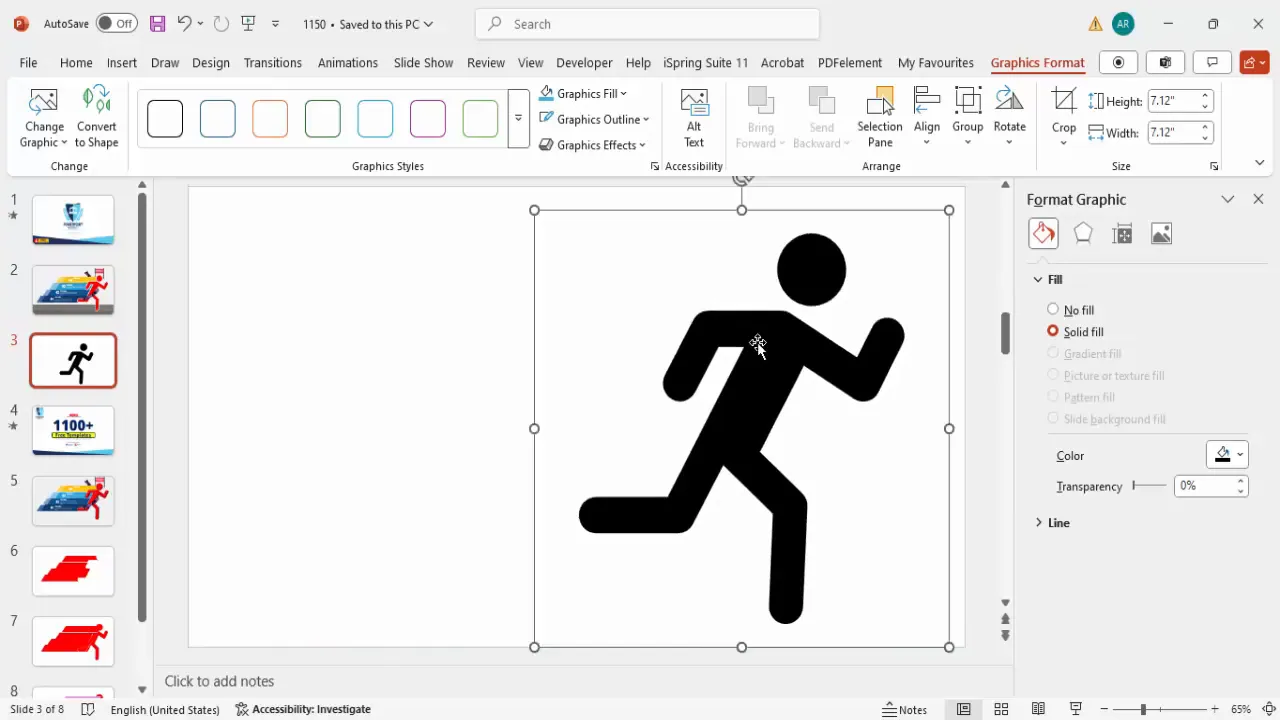
- Convert the icon to a shape to enable further editing: Select the icon, go to Graphic Format > Convert to Shape.
- Right-click and choose Group > Ungroup to break the icon into editable components.
- You can now adjust individual parts if desired, such as bringing parts closer for a compact look.
Designing the Four Options with Parallelograms
The core of this infographic is the four options represented by parallelograms—these shapes create a dynamic, forward-moving feel that complements the racing theme.
To create and position these shapes:
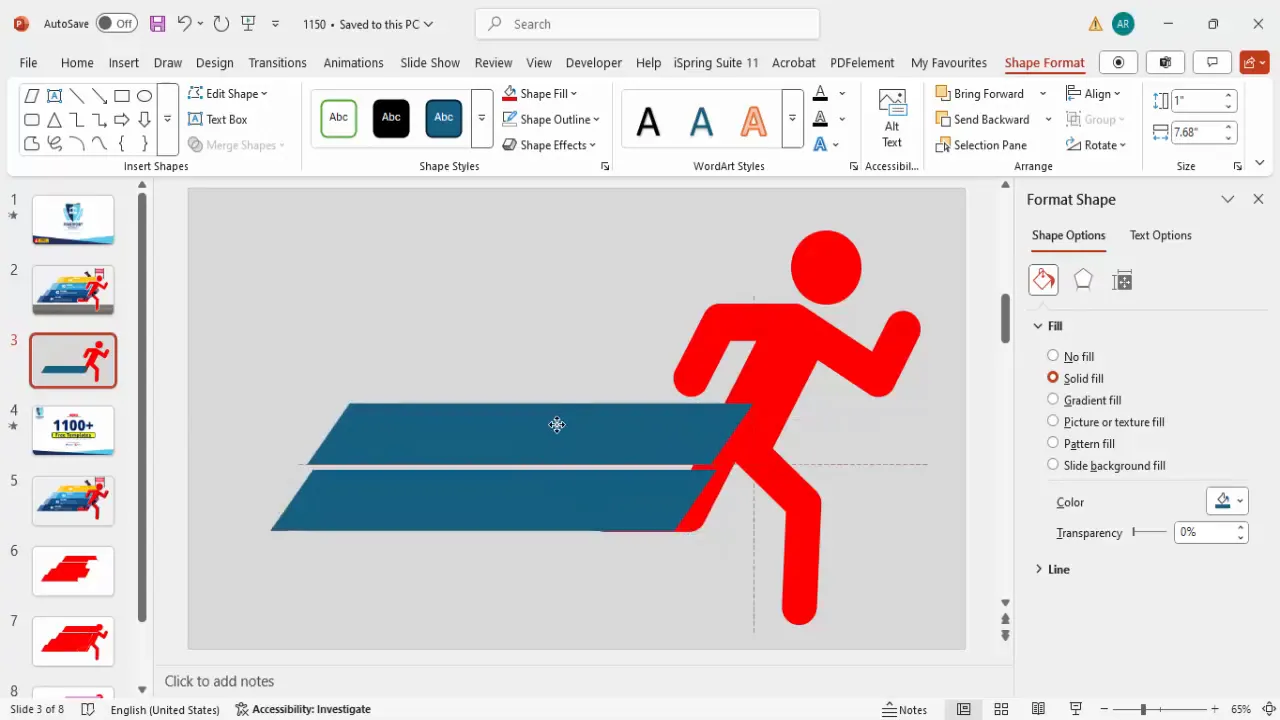
- Go to Insert > Shapes and select the Parallelogram from the Basic Shapes category.
- Draw the parallelogram on the right side of the slide where you want your options to appear.
- Remove the shape outline for a cleaner look by selecting the shape, then choosing No Outline under Shape Outline.
- Adjust the height of the shape to around 1 inch for a balanced proportion.
- Use the orange adjustment handle on the shape to curve or skew the parallelogram slightly, enhancing its dynamic appearance.
- Align the first parallelogram perfectly in your options area.
- Duplicate the shape three times by pressing Ctrl + D to create four total parallelograms.
- Space them evenly with a small gap to maintain neatness and readability.
- For clarity during design, temporarily fill each shape with different colors.
Cutting and Fragmenting Shapes for Custom Design
To create a unique, fragmented look and to prepare the shapes for color customization, use PowerPoint’s Merge Shapes feature with the Fragment option.
Here’s how to proceed:
- Before merging, duplicate your slide to safeguard your original layout.
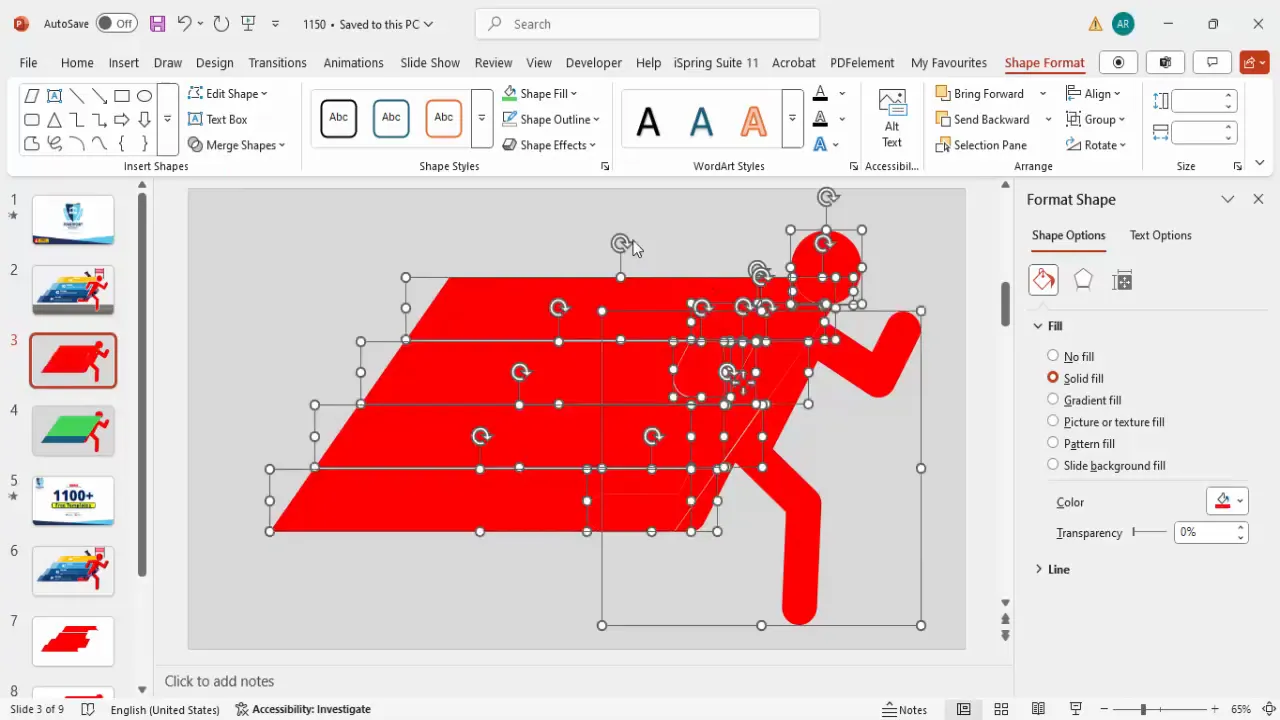
- Select all four parallelograms by holding Shift and clicking each one.
- Go to Shape Format > Merge Shapes and select Fragment.
- This breaks the shapes into smaller fragments that you can individually color and manipulate.
- Duplicate this fragmented group for experimentation.
- Delete the original shapes on your working slide to avoid clutter.
- Copy and paste the fragmented shapes from the duplicated slide back to your working slide.
- Now, each shape fragment is an independent object ready for color filling.
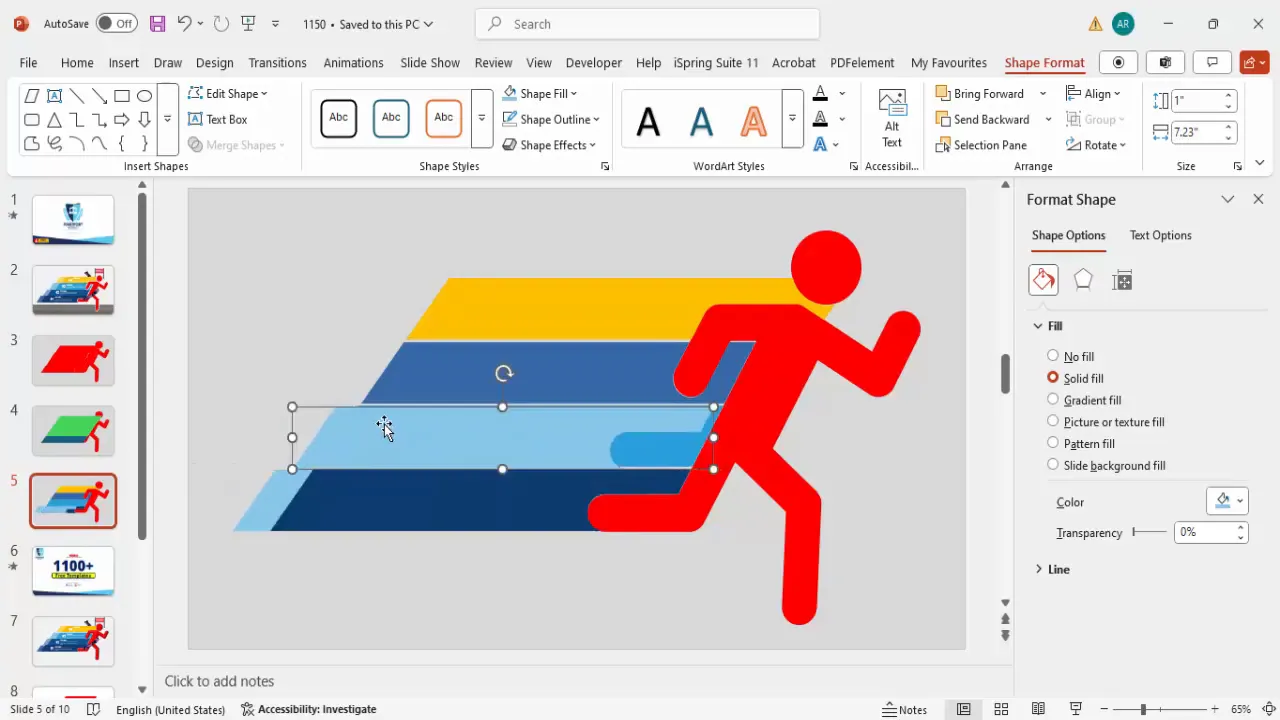
Coloring and Adding Design Elements
Color is a critical element in PowerPoint slide design, especially for infographics where clarity and engagement are paramount. Use contrasting and complementary colors to distinguish each option clearly.
Coloring tips and design additions:
- Fill each fragmented shape with a unique, vibrant color to differentiate the options.
- Use the Shape Format > Fill option to select your colors.
- Consider a palette of reds, blues, greens, and purples for energy and visual appeal.
- For added depth, duplicate some shapes, fill them with lighter shades, and send them to the back to create subtle shadow or layering effects.
- This layering adds a professional, polished look without cluttering the slide.
- Maintain consistent spacing and alignment for all shapes.
These small design elements enhance the overall aesthetics and readability of your slide.
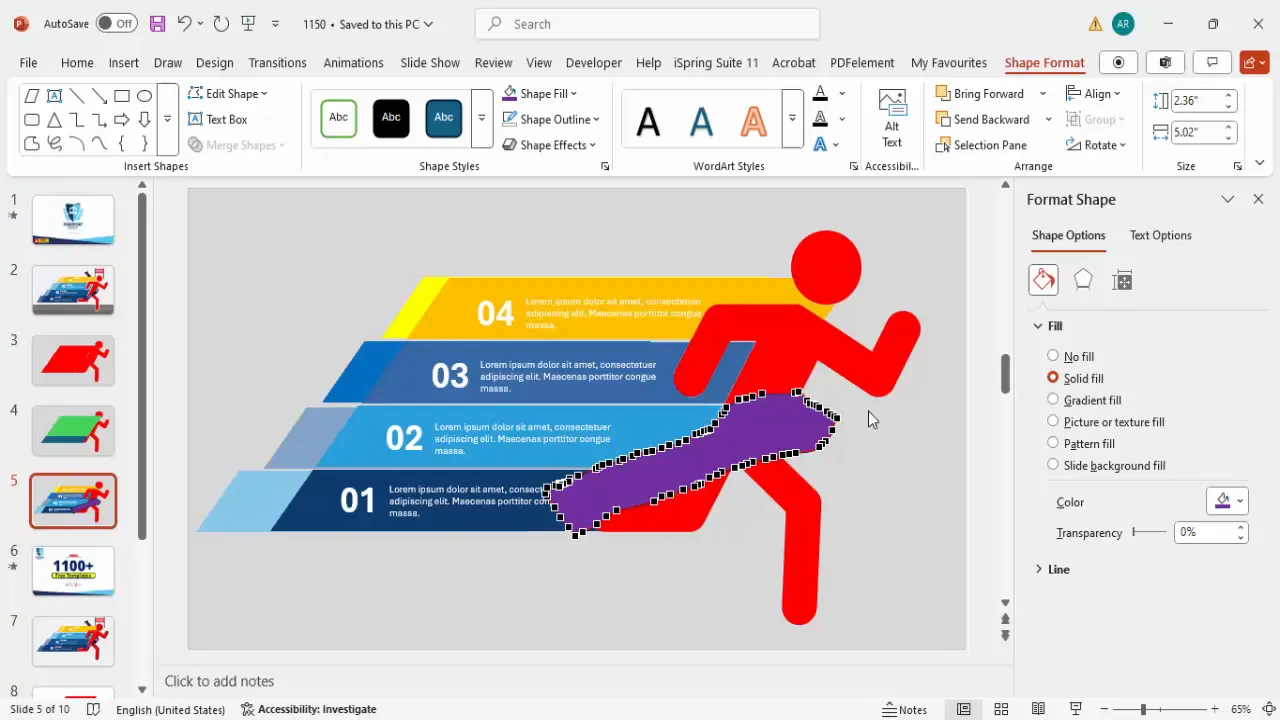
Adding Text Boxes and Option Numbers
Once the shapes are ready, it’s time to add descriptive text and numbering for each option. This step is crucial for communicating your message clearly.
Follow these steps for adding text:

- Insert a text box inside each parallelogram.
- Type the option number (e.g., 01, 02, 03, 04) using bold, large fonts to make them standout.
- Use white font color for high contrast against the colored shapes.
- Align the numbers centrally or left-aligned based on your design preference.
- Below the option number, add a title or headline describing the option briefly.
- Add detailed descriptive text below the title using a smaller font size.
- Use placeholder text like Lorem ipsum for layout purposes, then replace it with your own content.
- Duplicate the text box group for each option and adjust positions accordingly.
- Maintain consistent font styles and sizes across all options to ensure uniformity.
Adding the Finishing Ribbon Effect
To visually represent the excitement of crossing a finish line, add a ribbon or barrier effect that the runner icon appears to break through. This adds storytelling depth and symbolic meaning to your slide.
Steps to create the ribbon effect:
- Go to Insert > Shapes and select the Freeform Shape tool.
- Draw a ribbon-like shape crossing horizontally near the runner’s hands or chest, suggesting the finish line.
- Fill the shape with a vibrant color such as purple and remove the outline.
- Duplicate the ribbon shape and rotate or position it for symmetry or layered effect.
- Edit points of the freeform shape as needed to smoothen curves or adjust angles.
- Send the ribbons behind the runner icon using Shape Format > Send to Back.
- Optionally, add effects or textures to the ribbon for enhanced realism.
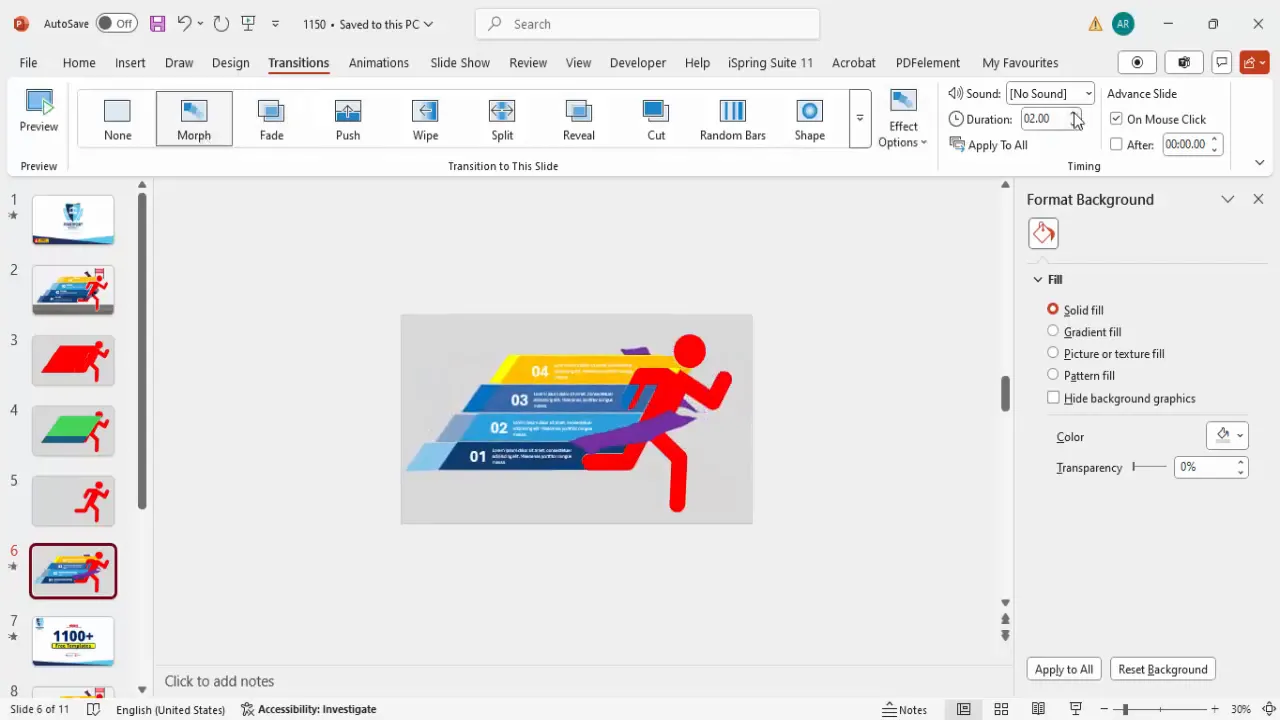
Animating the Slide with Morph Transition
Animation adds a dynamic flair that captures attention and helps illustrate progression or change effectively. PowerPoint’s Morph Transition is a powerful tool to animate your infographic smoothly without complex timeline setups.
Here’s how to apply the morph animation:
- Group all option shapes and texts together by selecting them and pressing Ctrl + G.
- Also group the runner icon and ribbon shapes separately for easier management.
- Duplicate your slide.
- On the duplicated slide, shrink the grouped options and move them outside the visible slide area to the right.
- Move other elements as needed to create the effect of options sliding away or appearing.
- Select the second slide, go to the Transitions tab, and choose Morph.
- Set the duration to around 0.75 seconds for a quick, smooth transition.
- Preview the animation to see the options slide out or in seamlessly.
This animation technique helps you create engaging presentations with minimal effort, making your PowerPoint slide design stand out professionally.
Frequently Asked Questions
Q1: Can I customize the colors and fonts used in this infographic?
Absolutely! The shapes and text boxes are fully editable, so you can change colors, fonts, sizes, and layouts to match your brand or presentation theme.
Q2: Is the running icon editable after conversion to a shape?
Yes, once converted to shapes and ungrouped, you can edit individual parts of the icon, resize, recolor, or reposition them to suit your design preferences.
Q3: Can I add more than four options using this design?
While this tutorial focuses on four options, you can add more parallelograms and repeat the process. Just ensure spacing and slide layout remain balanced and readable.
Q4: What if I want a different animation effect instead of the Morph transition?
You can explore other animations such as Fade, Wipe, or Fly In based on your style. Morph is recommended for its smoothness and professional feel but feel free to experiment.
Q5: Can I download pre-made templates similar to this design?
Yes, POWERPOINT UNIVERSITY offers a wide range of free templates, including race and infographic themes. These can be downloaded and customized easily.
Conclusion
Mastering PowerPoint slide design involves combining creativity with practical techniques to communicate your message effectively. This tutorial on creating a 4 Winning Race Options infographic slide guides you through the entire process—from setting up your slide and designing custom shapes to adding color, text, and animations.
By following these steps, you’ll be able to build professional, engaging slides that not only look great but also help your audience grasp your content quickly and clearly. The use of icons, shapes, and animation like the Morph transition adds polish and interactivity, making your presentations memorable.
Remember, the key to great PowerPoint slide design is clarity, consistency, and creativity. Experiment with colors, fonts, and layouts while maintaining readability. Don’t hesitate to use grouping and duplication features to save time and keep your slides organized.
For ongoing inspiration and free PowerPoint templates, you can explore resources like POWERPOINT UNIVERSITY. Happy designing!
Check out the full video: 4 Winning Race Options infographic Slide in PowerPoint


