Creating visually engaging and informative slides is a pivotal skill in professional presentations. If you’re looking to elevate your PowerPoint Slide Design, learning to craft dynamic infographic slides can make a significant difference. In this comprehensive article, I’ll walk you through how to create an 8 Options infographic slide in PowerPoint, combining design precision with interactive elements to captivate your audience effectively.
This tutorial is inspired by and based on advanced techniques that help you build a highly customizable slide with eight distinct options, each featuring icons, colors, and detailed text. Whether you’re preparing for a business pitch, a corporate update, or an educational presentation, this slide design will add clarity and professionalism to your visuals.
Table of Contents
- Overview of the 8 Options Infographic Slide
- Preparing the Slide and Setting Up Guides
- Creating the Base Shapes for the Infographic
- Fragmenting and Cleaning Up the Shapes
- Unionizing the Shape Components
- Coloring the Options and Adding Icons
- Inserting Option Numbers and Detailed Text
- Applying Animations for Interactive Effects
- Frequently Asked Questions (FAQs)
- Conclusion
Overview of the 8 Options Infographic Slide
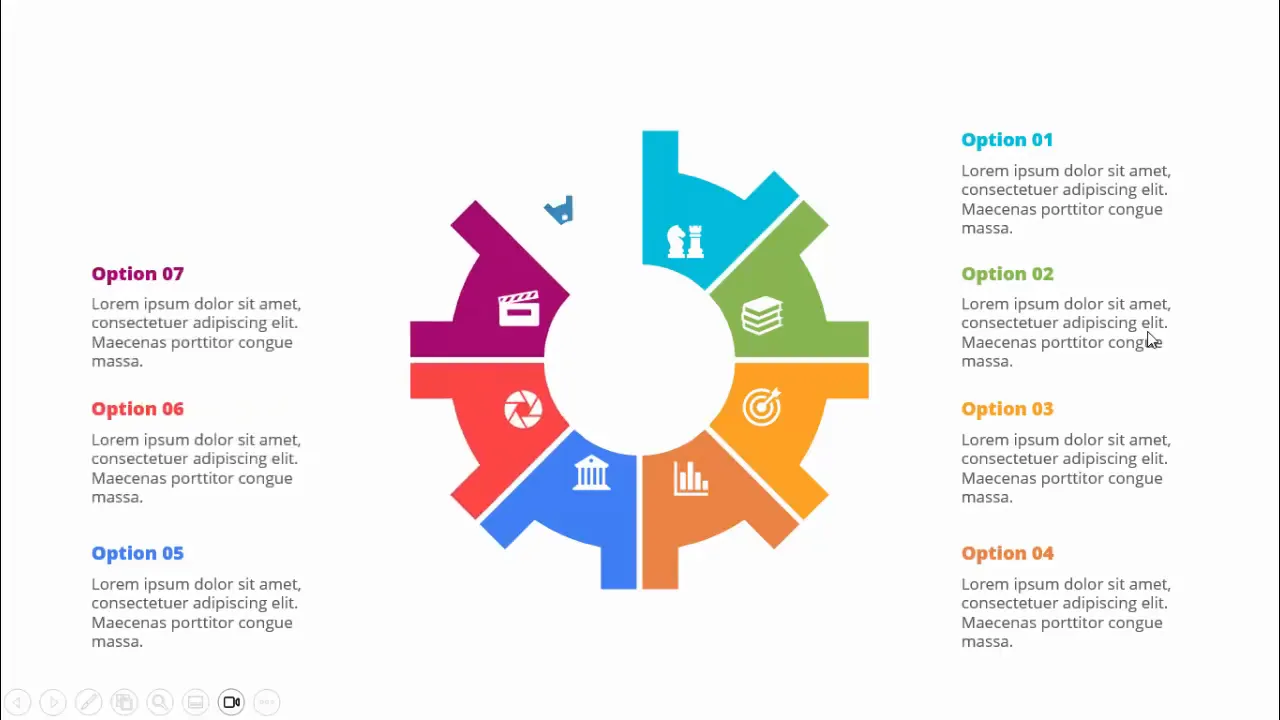
The 8 Options infographic slide is designed to showcase multiple choices or segments in a visually appealing circular format. Each option can display an icon, an option number, and descriptive text, all color-coded to distinguish one from another. The slide is interactive, enabling users to click through each option and highlight it with animations and color changes.
This approach to PowerPoint Slide Design is ideal for business models, marketing funnels, step-by-step processes, or any presentation requiring clear segmentation of information.
Preparing the Slide and Setting Up Guides
Before diving into shape creation and detailed design, it’s crucial to prepare your slide environment properly. Here’s how to start:
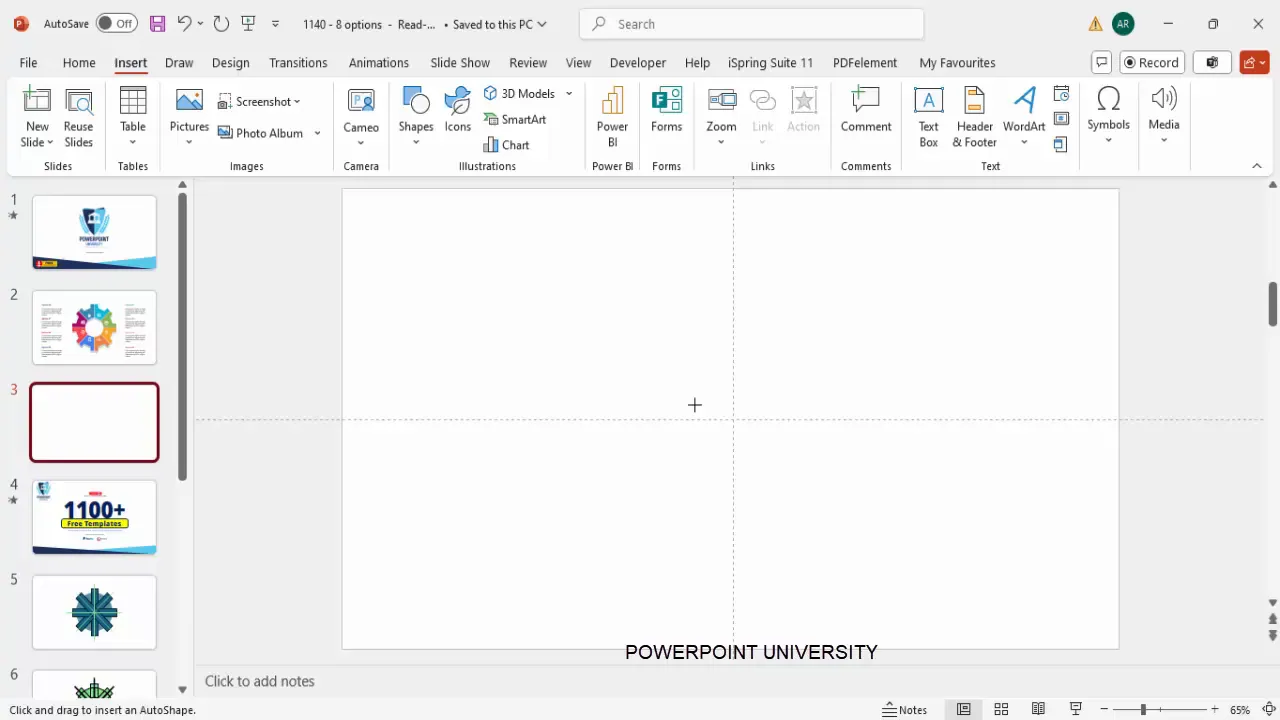
- Add a new slide: Open your PowerPoint presentation and insert a blank new slide.
- Enable Guides: Go to the View tab and enable guides. This helps align objects precisely and maintain symmetry throughout the design.
Using guides is a fundamental step in PowerPoint Slide Design for ensuring your infographic elements are perfectly centered and balanced.
Creating the Base Shapes for the Infographic
The infographic’s visual structure is built from basic shapes including hollow circles and rectangles. Follow these steps to create the foundational shapes:
- Insert a Hollow Circle: From the Insert tab, select Shapes, then choose the Circle Hollow shape. Click on the slide to place it.
- Format the Circle: Go to the Shape Format tab. Set both height and width to 4 inches. Use Align Center and Align Middle to position it perfectly on the slide.
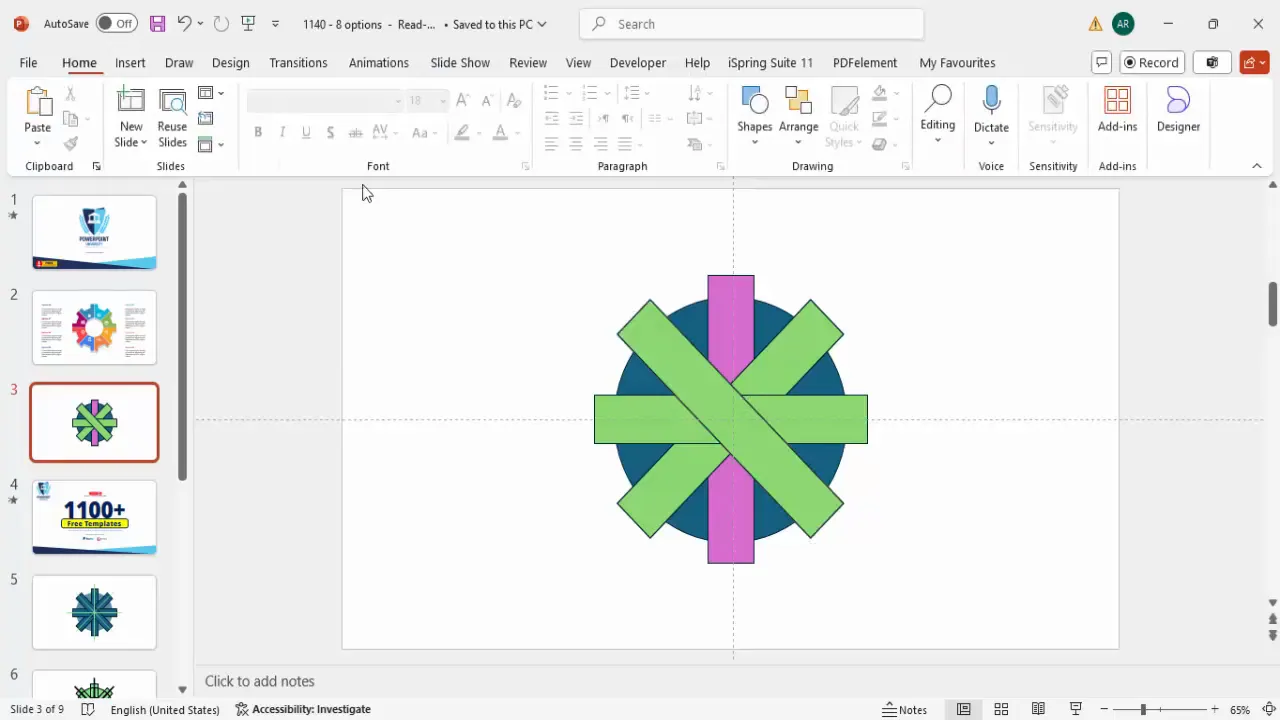
- Create Rectangular Segments: Insert a rectangle shape. Adjust its width to 0.8 inches and height to 4.7 inches. Apply a distinct color to differentiate this segment.
- Duplicate and Rotate: Duplicate the rectangle by pressing Ctrl + D. Change its color for visual distinction. Then, rotate the rectangle by pressing Alt + Right Arrow three times (each press rotates 15 degrees, so three times equals 45 degrees).
- Repeat Duplication and Rotation: Continue duplicating and rotating rectangles to create eight segments evenly spaced around the circle.
- Create Smaller Rectangles: Insert smaller rectangles for additional detail or layering. Duplicate and rotate these smaller rectangles using the same steps.
This technique creates the radial layout of the infographic, where each segment corresponds to an option.
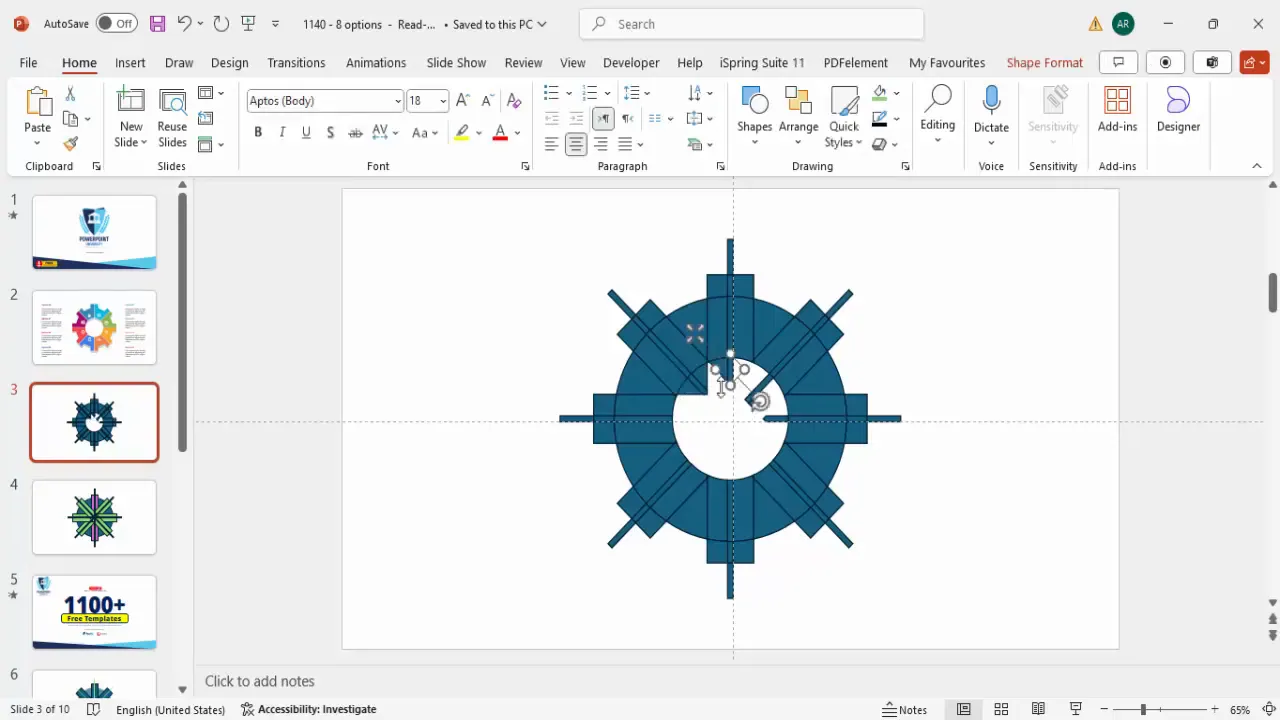
Fragmenting and Cleaning Up the Shapes
Now that you have all the shapes arranged, the next step is to fragment the shapes to separate overlapping parts and clean up unnecessary elements.
- Duplicate the Slide: Before you proceed, duplicate your slide as a backup in case you need to revert changes.
- Select All Objects: Press Ctrl + A to select all shapes on the slide.
- Fragment the Shapes: Go to the Shape Format tab, click Merge Shapes, and select Fragment. This breaks the shapes into smaller pieces where they overlap.
- Delete Inner Objects: Carefully select and delete all small fragments inside the hollow circle to clean up the infographic. Zoom in to make precise selections and avoid deleting the main shapes.
- Be Patient: This part is time-consuming but essential to get clean and crisp segments for each option.
Fragmenting shapes allows the infographic to have distinct clickable areas for each option, which is crucial for interactivity.
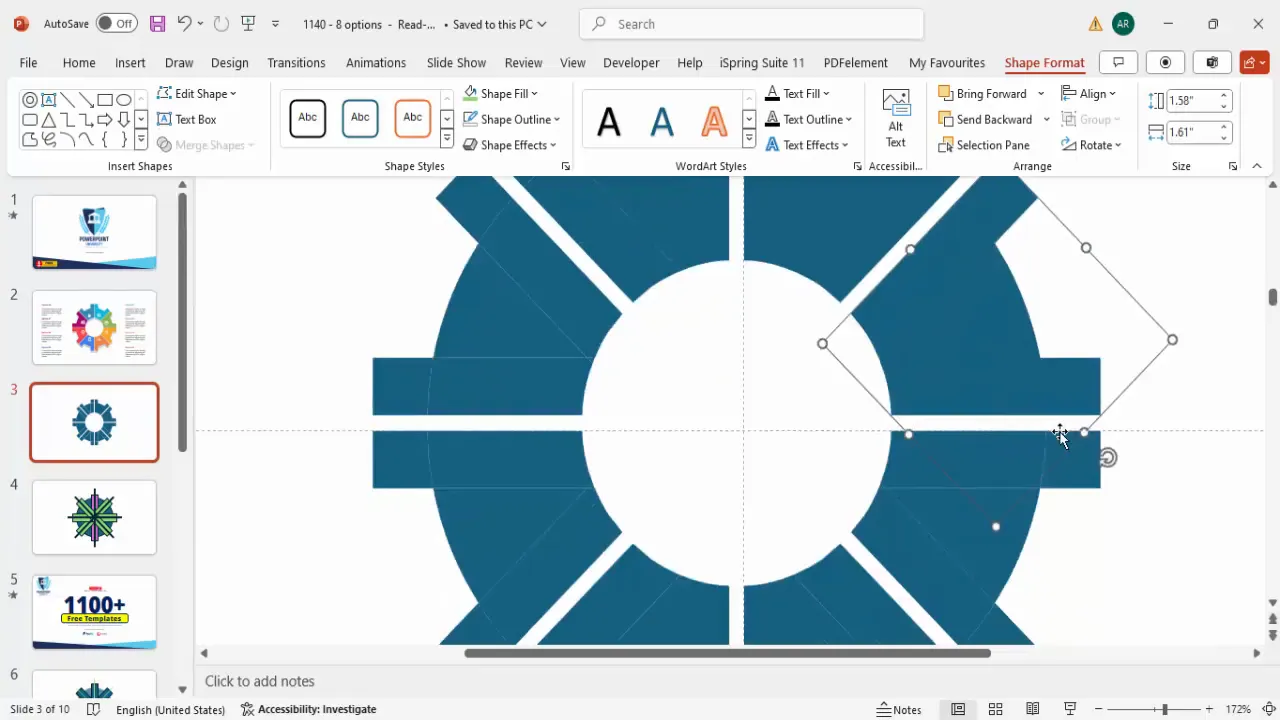
Unionizing the Shape Components
After cleaning up the fragmented shapes, it’s important to group and unite the segments into solid shapes for easier handling and coloring.
- Remove Outlines: Select all objects (Ctrl + A), go to Shape Format > Shape Outline, and select No Outline. This improves the look and makes selection easier.
- Select Segment Pieces: For each option segment, hold the Shift key and select all parts belonging to that segment, including smaller rectangles.
- Union Shapes: With all parts selected for a segment, go to Shape Format > Merge Shapes > Union. This merges the pieces into one shape.
- Repeat for All Segments: Perform the union operation on all eight segments to have clean, solid shapes.
Unionizing segments simplifies the design and prepares the slide for applying colors and interactive elements.
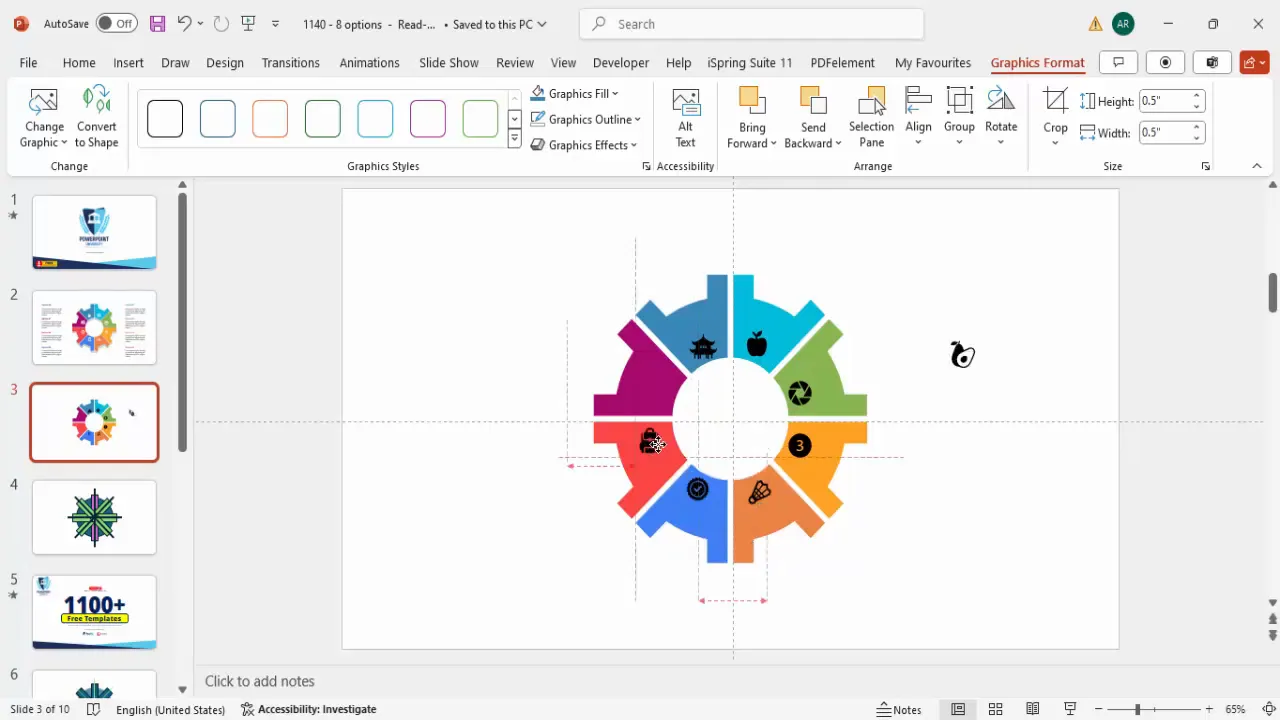
Coloring the Options and Adding Icons
With all segments unified, it’s time to add colors and icons to enhance visual appeal and communicate meaning.
- Apply Colors: Select each segment and apply a distinct color that fits your presentation’s theme or purpose. This color differentiation helps audiences easily identify each option.
- Insert Icons: Go to Insert > Icons. Choose icons relevant to your content or select random icons for placeholders. Insert eight icons, one for each option.
- Resize and Position Icons: Set the height and width of each icon to 0.5 inches. Position each icon centrally within its respective segment.
- Adjust Icon Colors: Change icon colors to white or another contrasting color to ensure visibility against the segment’s background.
- Group Icons with Segments: Select each icon with its segment and press Ctrl + G to group them. Grouping ensures icons move together with their segments.
Adding icons is a powerful way to create a visual narrative and make the slide more engaging.
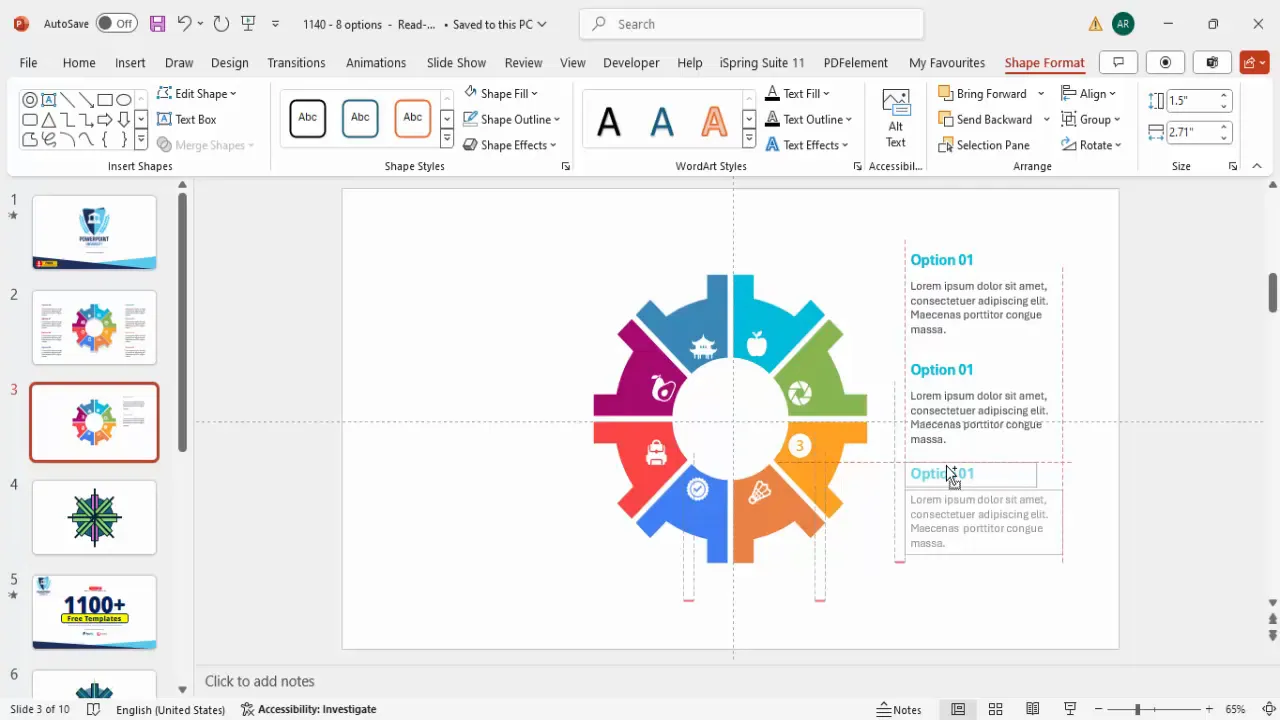
Inserting Option Numbers and Detailed Text
Next, add text elements to label each option and provide additional description or details.

- Add Option Numbers: Insert a text box near each segment and type “Option 01”, “Option 02”, etc. Make the option number bold to stand out.
- Add Detailed Text: Insert another text box below or beside each option number. Use placeholder text such as lorem ipsum for now, and adjust font size to fit the space.
- Style Text: Change the font color to gray for detail text and match the option number color to its segment color (e.g., blue segment gets blue option number).
- Align Text: Select option number and detail text boxes and align the text left for consistency and readability.
- Group Text Elements: Group the option number and detail text boxes together to maintain layout integrity.
- Duplicate and Adjust for All Options: Use Ctrl + Shift to duplicate the grouped text and reposition for each option. Change the option number and text content accordingly.
Well-placed and styled text enhances clarity and provides necessary context for each infographic segment.
Applying Animations for Interactive Effects
To increase viewer engagement, adding simple animations to each option can make your slide more dynamic and interactive.
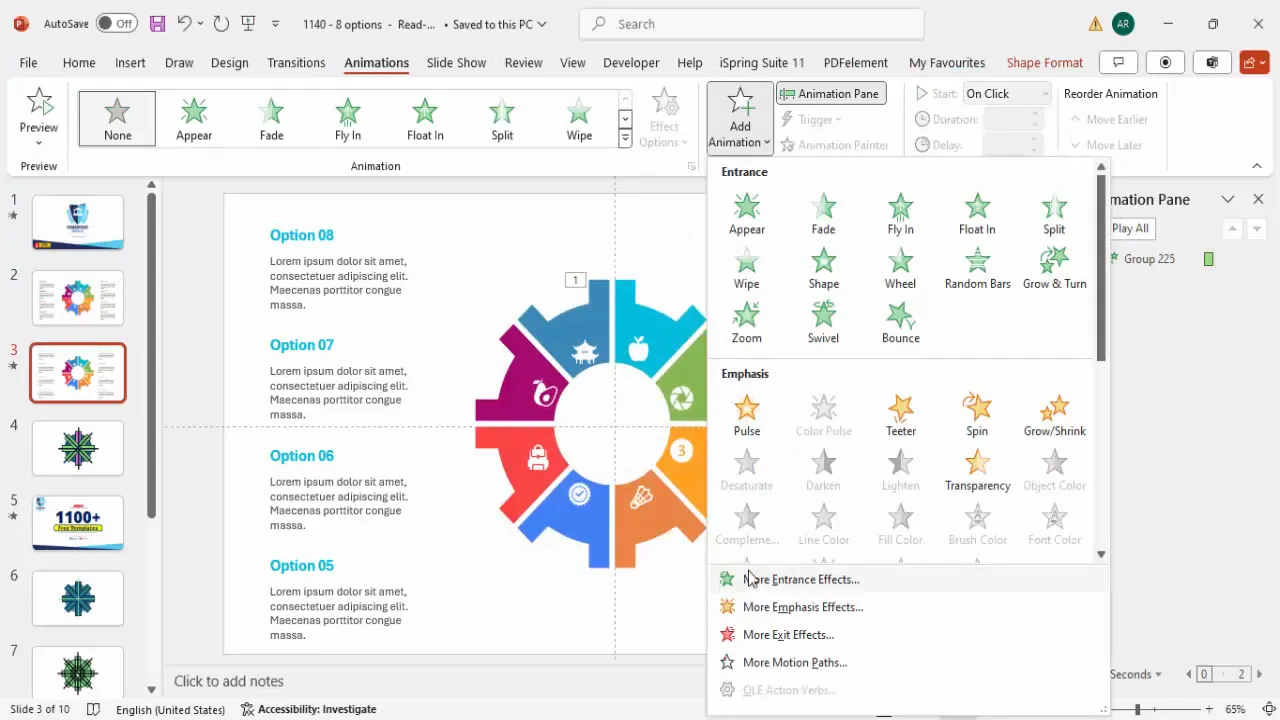
- Open Animation Pane: Go to the Animations tab and click Animation Pane to manage animations.
- Add Entrance Animation: Select the first option group (shape, icon, and text). Click Add Animation > More Entrance Effects. Choose Basic Zoom and click OK.
- Add Stretch Animation: With the same option group selected, add another animation: Add Animation > More Entrance Effects. Choose Stretch, set it to stretch from the left, and set it to start After Previous.
- Copy Animation: Use the Animation Painter to copy these animations to all other options for consistent effect.
- Test the Animation: Play the slide show to ensure the animations trigger smoothly with each click, highlighting each option in sequence.
Animations, when used sparingly and purposefully, can guide your audience’s attention and make your PowerPoint Slide Design more professional and polished.
Frequently Asked Questions (FAQs)
What is the benefit of using an 8 Options infographic slide in presentations?
The 8 Options infographic slide provides a clear and visually appealing way to present multiple choices or steps. It helps organize complex information and makes it easier for audiences to follow and remember the content.
Can I customize the icons and colors in this slide?
Absolutely. PowerPoint allows you to select icons that fit your presentation’s theme and change colors to match your brand or style guidelines. Customization is key to making the slide relevant and visually cohesive.
Is it necessary to fragment and union shapes?
Yes, fragmenting and unionizing shapes allows you to create distinct segments for each option that behave independently. This is essential for adding interactive animations and color differentiation.
How do I ensure the slide looks balanced and aligned?
Using PowerPoint’s guides and alignment tools is critical. Enabling guides helps you position shapes and text precisely, ensuring symmetry and professional design quality.
Can I use this infographic slide for other numbers of options?
While this tutorial focuses on eight options, the principles apply to other numbers as well. You may need to adjust rotation angles and spacing accordingly.
Conclusion
Mastering PowerPoint Slide Design involves more than just placing text and images on a slide. Creating interactive, visually structured infographic slides like the 8 Options design elevates your presentations and engages your audience effectively.
By following the detailed steps to prepare your slide, create and fragment shapes, unionize components, add icons and text, and apply animations, you can produce a professional infographic slide that stands out. Remember, patience is key during the more time-consuming tasks like fragmenting shapes, but the result is a clean, interactive, and visually appealing slide.
Experiment with colors, icons, and text to tailor the slide to your specific content and branding. With practice, you’ll find this method invaluable for delivering complex information in an accessible and impressive way.
For more creative PowerPoint tutorials and free templates, consider exploring resources that offer ready-made designs to supplement your work and inspire new ideas.
Check out the full video: Create 8 Options Infographic Slide in PowerPoint


