If you’re looking to elevate your PowerPoint presentations with creative, visually appealing infographic slides, mastering the art of footprint infographic slides is a fantastic skill to add to your repertoire. This comprehensive guide walks you through crafting an engaging footprint slide in PowerPoint, helping you communicate processes, journeys, or stepwise information effectively. The design combines simple shapes, icons, and animations to capture attention and make your message memorable.
In this tutorial, we’ll cover everything from setting up your slide background to inserting and customizing footprint icons, adding descriptive text, and finally animating your slide for a professional finish. Whether you’re a beginner or looking to refine your PowerPoint slide design skills, this step-by-step guide is packed with actionable tips to help you create polished infographic slides that stand out.
Let’s dive in and learn how to make a footprint infographic slide in PowerPoint that not only looks great but also enhances your storytelling.
Table of Contents
- Getting Started: Setting Up Your Slide
- Inserting and Customizing Footprint Icons
- Adding Text Boxes and Connecting Lines
- Customizing Colors for Visual Impact
- Applying Animations for Interactive Slides
- Tips for Effective PowerPoint Slide Design
- Frequently Asked Questions (FAQ)
- Conclusion
Getting Started: Setting Up Your Slide
Before diving into the creative part, it’s essential to set a solid foundation for your footprint infographic slide. A well-chosen background color and clean canvas make all the difference in the clarity and appeal of your slide.
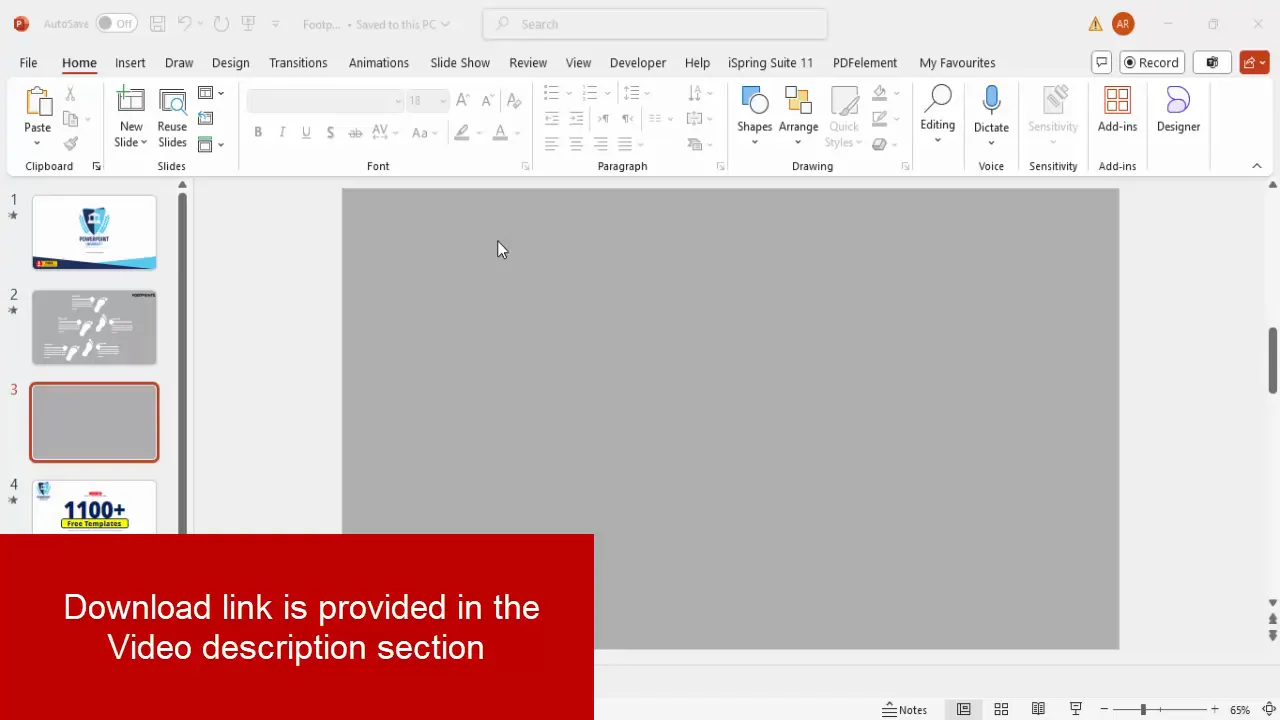
Step 1: Add a New Slide
Start by inserting a new slide into your PowerPoint presentation. You can do this by clicking the Home tab and then selecting New Slide. Choose a blank layout to give yourself a clean workspace.
Step 2: Set the Slide Background
Change the slide background color to a neutral gray shade. This sets a subtle tone that makes white footprints and text pop out clearly. To do this:
- Right-click on the slide background and select Format Background.
- Choose Solid Fill and select a gray color that suits your preference.
- Apply the background to the current slide.
Setting a gray background is a smart choice because it contrasts well with white and other bright colors, which we will use later for the footprints and text elements.
Inserting and Customizing Footprint Icons
The core visual element of this infographic slide is the footprint icon, which symbolizes steps or stages in a process. PowerPoint’s built-in icon library provides a convenient way to insert these footprints.
Step 3: Insert Footprint Icons
Follow these steps to insert footprints:
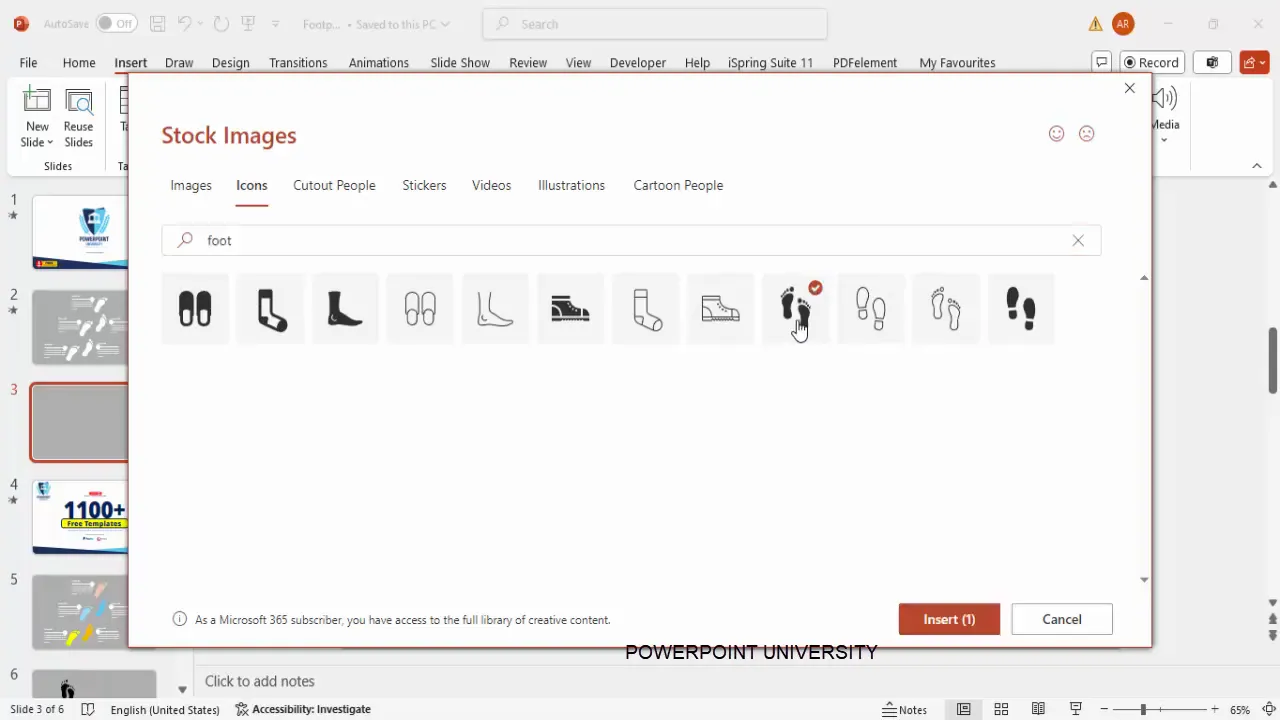
- Go to the Insert tab and click on Icons.
- In the search bar, type foot.
- Select the footprint icon from the results and click Insert.
Step 4: Resize and Customize the Footprint
Once inserted, resize the footprint icon by holding the Shift key and dragging from a corner to maintain aspect ratio. This ensures the icon doesn’t get distorted.
Step 5: Separate and Group Left and Right Foot Icons
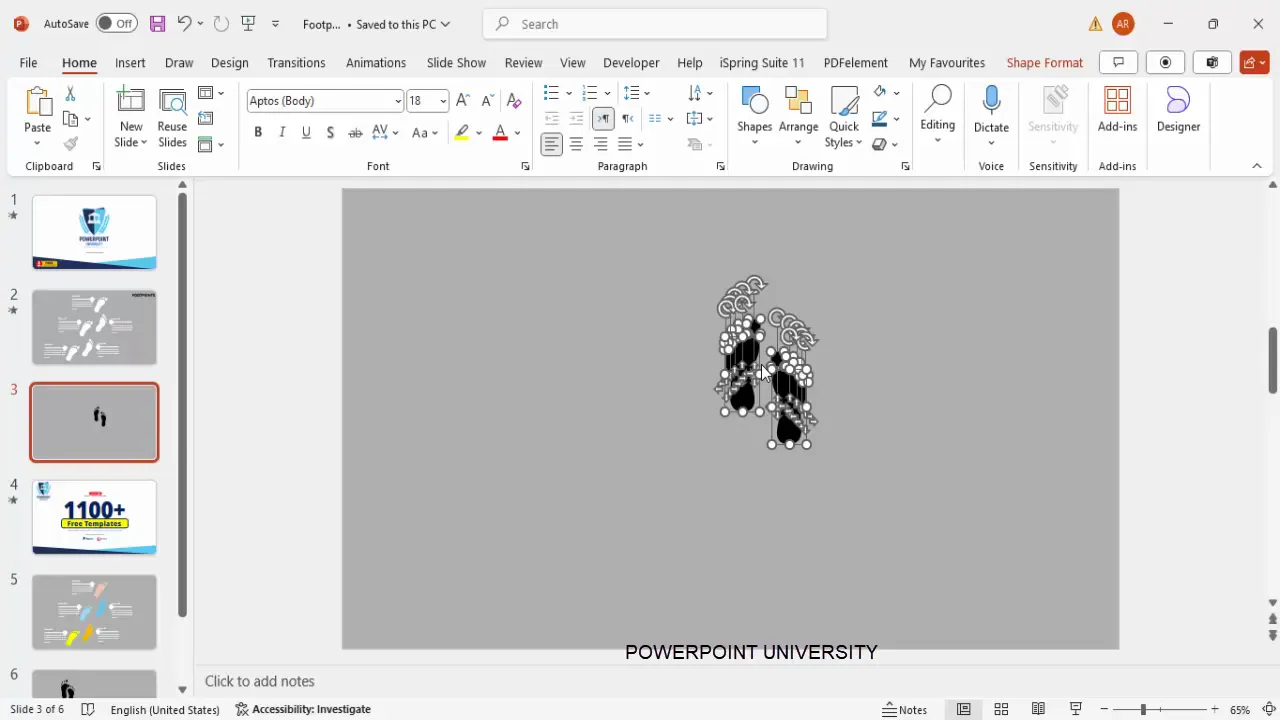
The footprint icon in PowerPoint is a composite graphic consisting of two parts: left and right footprints. To manipulate them individually:
- Select the footprint icon.
- Go to the Graphic Format tab and choose Convert to Shape. This converts the icon into editable shapes.
- Now, you can select the left and right footprints separately.
Group each footprint separately by selecting it and pressing Ctrl + G (or Command + G on Mac). This makes it easier to duplicate and position them.
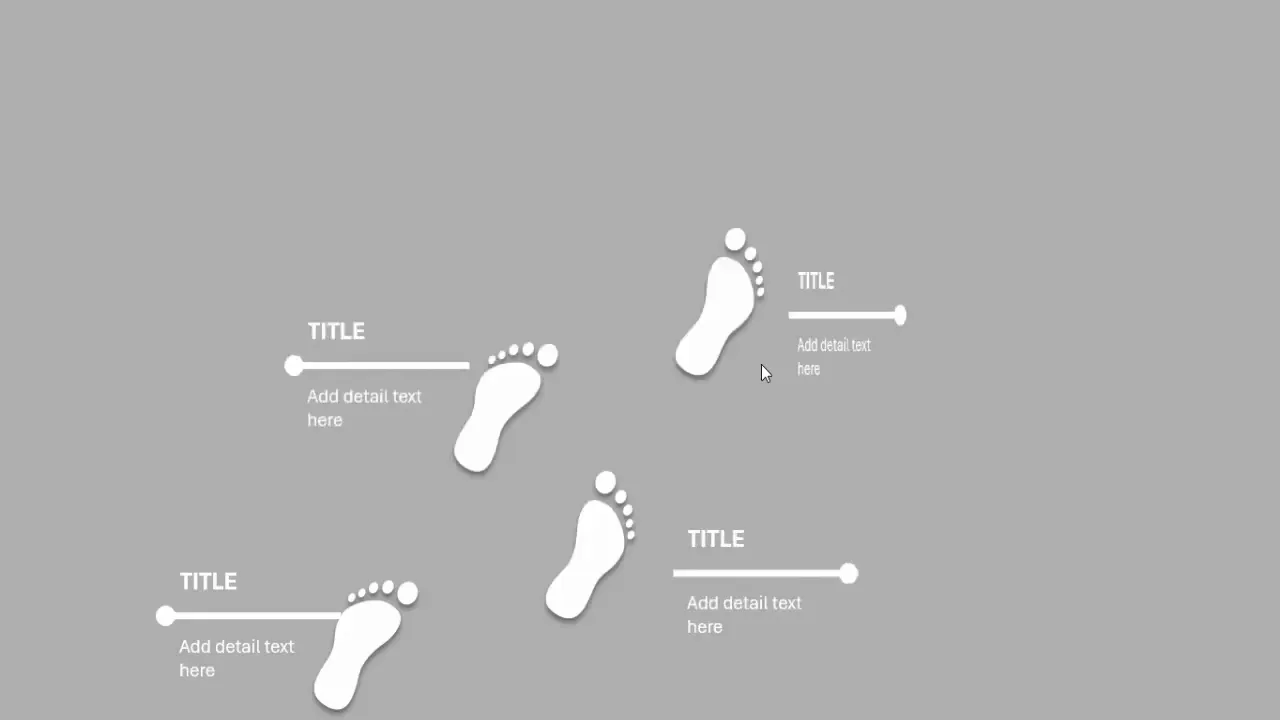
Step 6: Color and Effects
To make the footprints visually appealing:
- Select both footprints and change their fill color to white using the Shape Fill option.
- Add a subtle shadow effect by going to Shape Effects → Shadow → Preset Bottom. This adds depth and makes the footprints stand out against the gray background.
- Rotate the footprints slightly using the circular rotation handle to add a natural stepping effect.
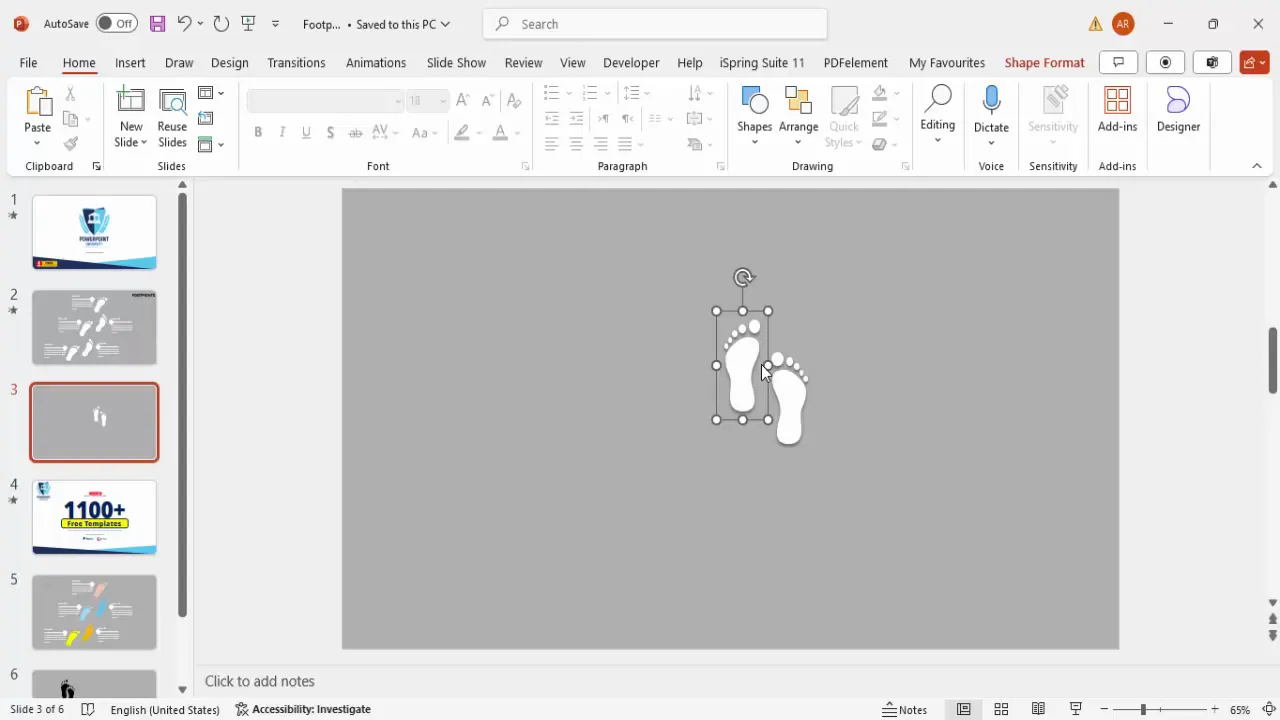
Step 7: Duplicate and Arrange Footprints
To represent multiple steps, duplicate the grouped footprints by selecting both and pressing Ctrl + D. Arrange the footprints in a sequence to simulate walking steps:
- Place the first footprint at the starting position.
- Move the second footprint slightly forward and to the side to mimic a walking pattern.
- Repeat the duplication and positioning for the third, fourth, and fifth footprints.
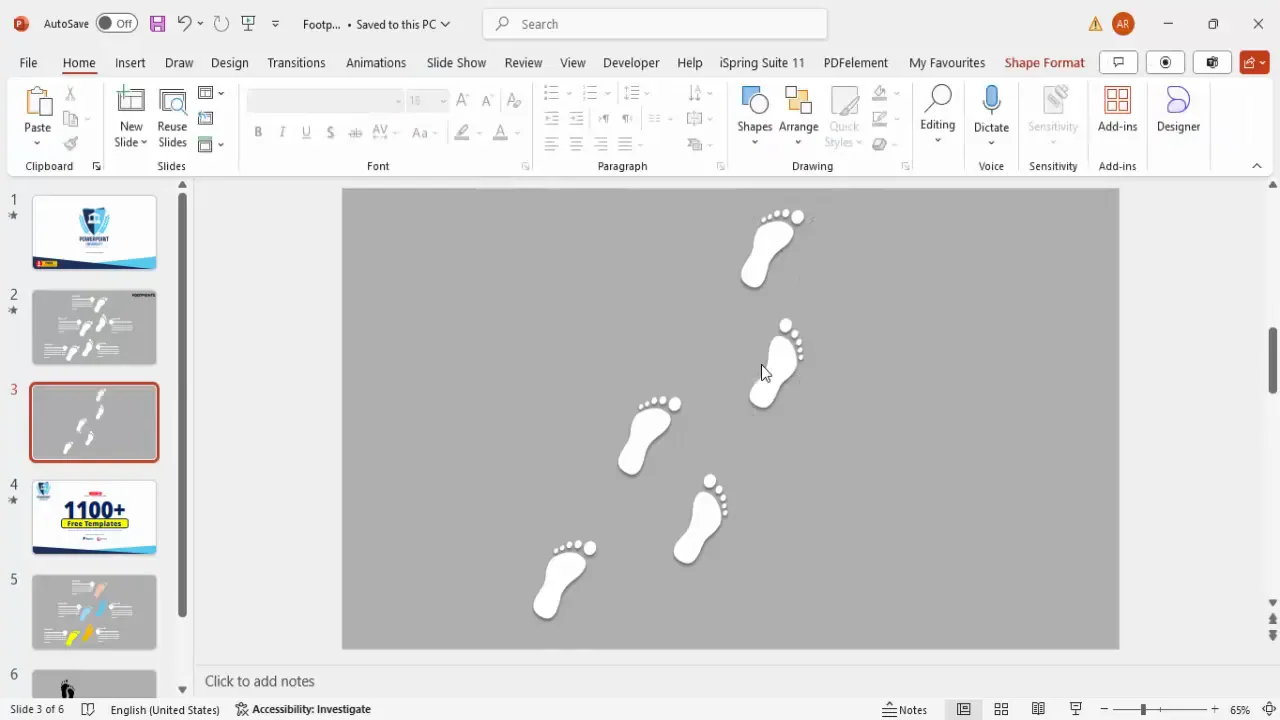
This layout visually represents a journey or process flow, guiding your audience through each step effortlessly.
Adding Text Boxes and Connecting Lines
With the footprints in place, the next step is to add descriptive text and connectors that explain each step clearly. This transforms the slide into an effective infographic.
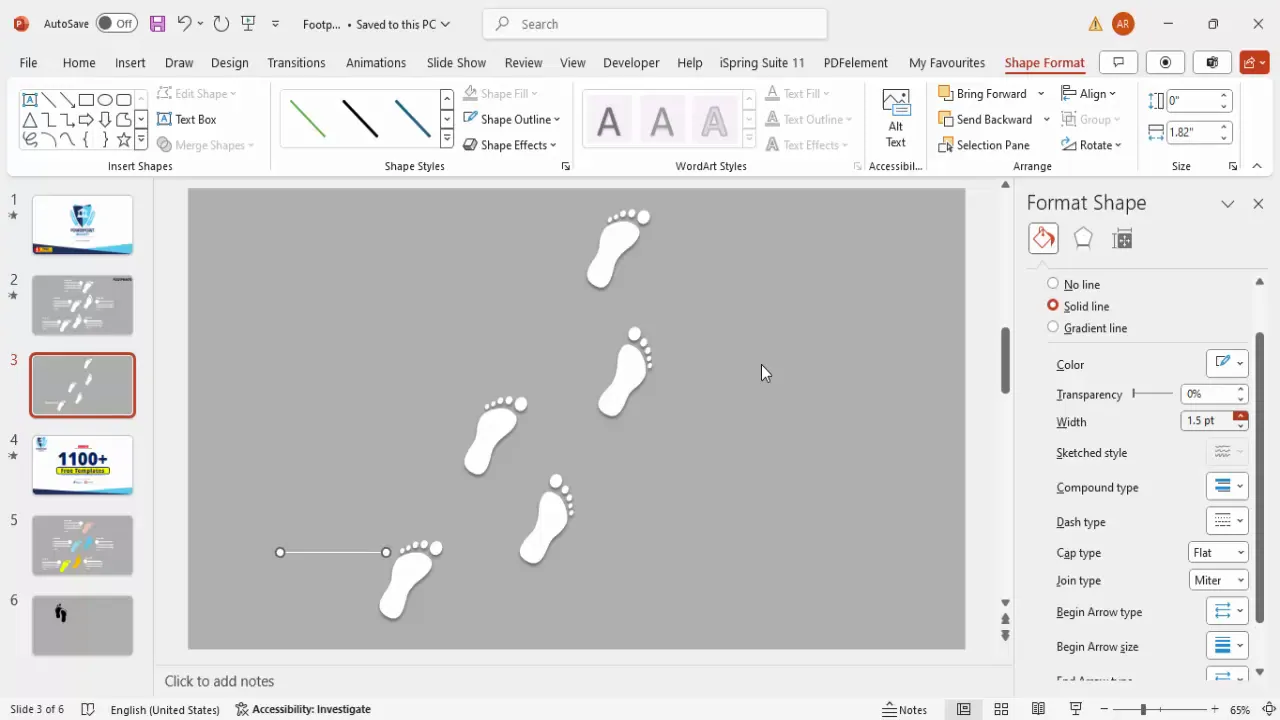
Step 8: Insert Connecting Lines
To visually link footprints with their respective descriptions, add lines with arrowheads:
- Go to Insert → Shapes and select the straight Line.
- Hold the Shift key while drawing to ensure the line is perfectly horizontal or vertical.
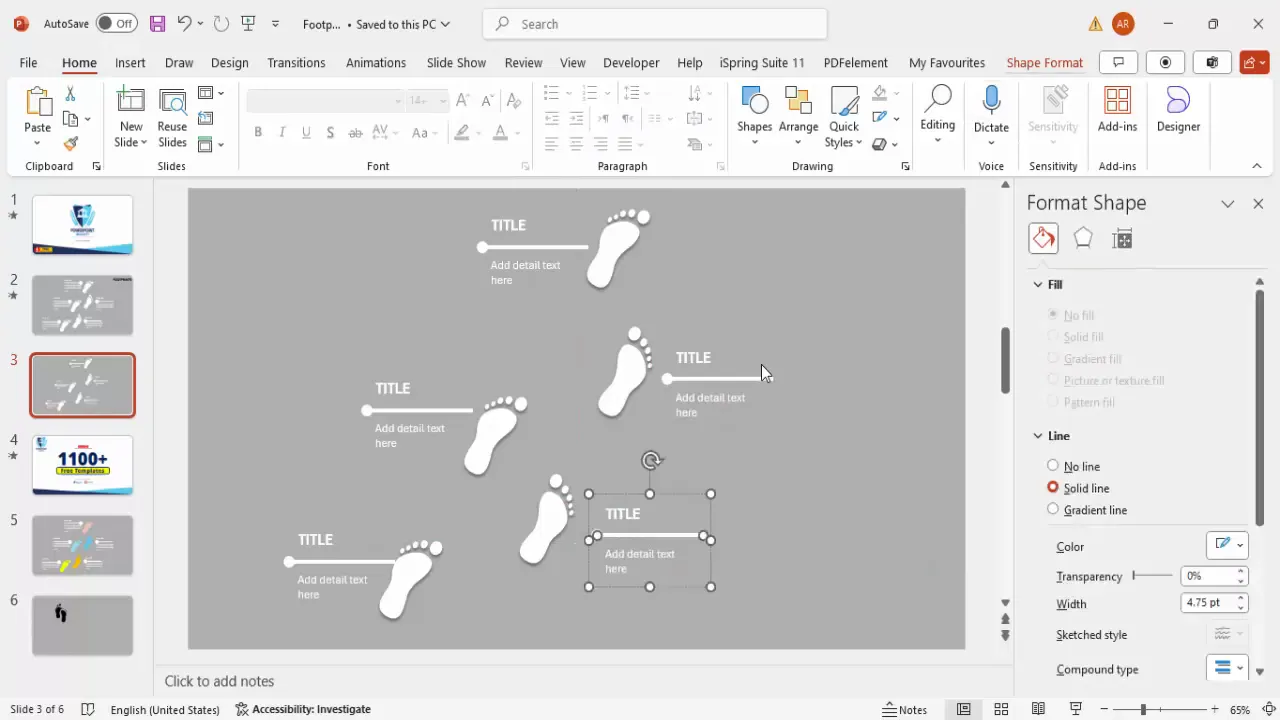
- Change the line color to white for visibility.
- Right-click the line, select Format Shape, and increase the line width for emphasis.
- Set the end arrow type to an oval arrowhead for a softer look.
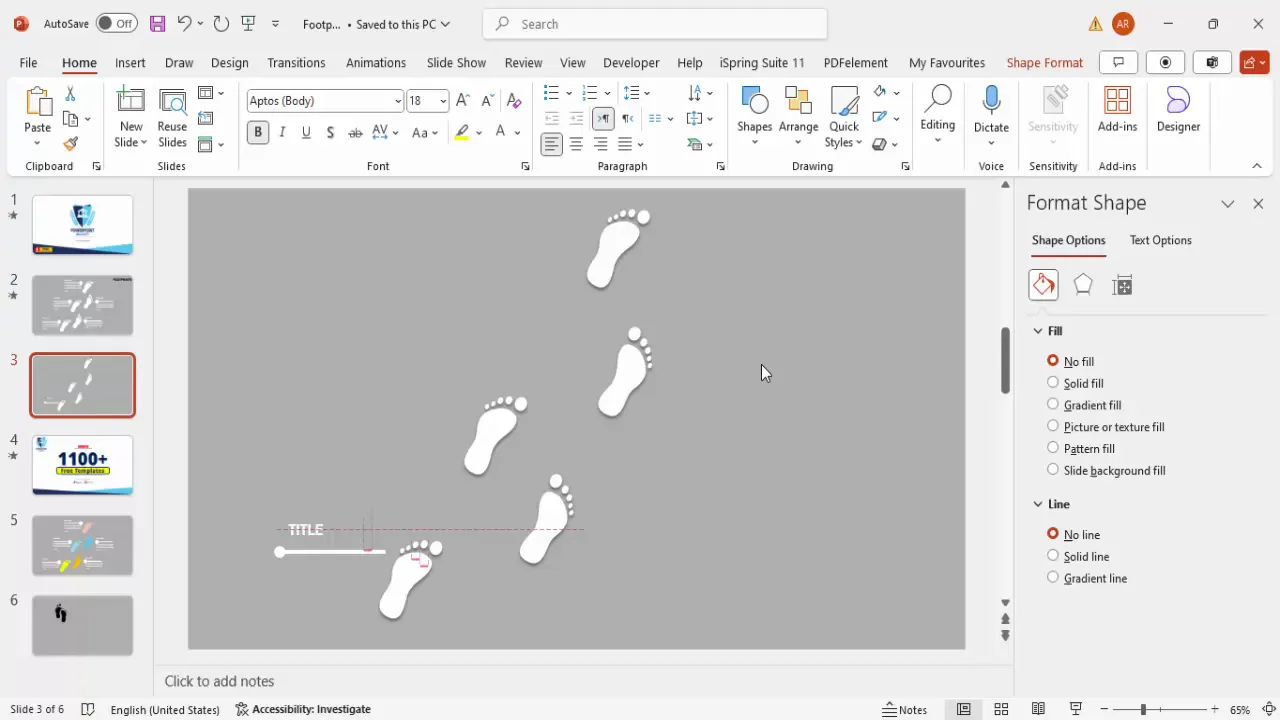
Step 9: Add Text Boxes for Steps
Now, add text boxes to describe each step in the footprint infographic:
- Insert a text box near the line to add the step number and title. Use bold, white font for legibility.
- Below the title, insert another text box for detailed descriptions. Use a smaller font size and align the text appropriately (left or right) based on your design preference.
Step 10: Group Line and Text Elements
To keep your slide organized and make moving elements easier:
- Select the line and both text boxes for a single step.
- Press Ctrl + G to group them.
- Duplicate the grouped elements for each step using Ctrl + D.
- Position each group beside the corresponding footprint.
For steps on the opposite side of the footprints, flip the grouped text and line horizontally using the Rotate → Flip Horizontal option to create a balanced slide layout.
Customizing Colors for Visual Impact
Colors are a powerful tool in PowerPoint slide design. They help differentiate steps, highlight important information, and enhance slide aesthetics.

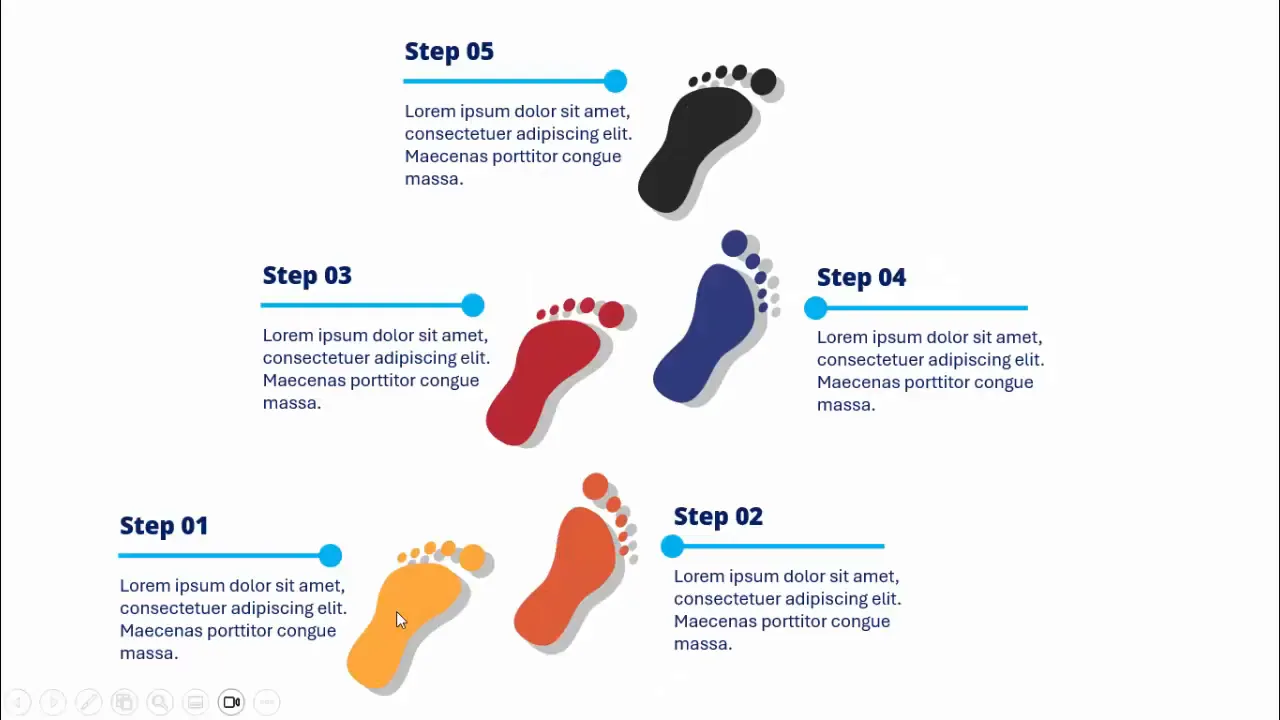
Step 11: Apply Different Colors (Optional)
If you want to add vibrancy and clarity, assign different colors to each footprint and its corresponding text group:
- Choose colors like yellow, green, blue, or any palette that matches your branding.
- Apply these colors to the footprints’ fill and the lines/text elements.
However, if you prefer a clean and minimalist look, keeping all elements white on a gray background is equally effective.
Applying Animations for Interactive Slides
Animations add interactivity and professionalism to your PowerPoint slide. Instead of overwhelming your audience with all information at once, animations help reveal content step-by-step.
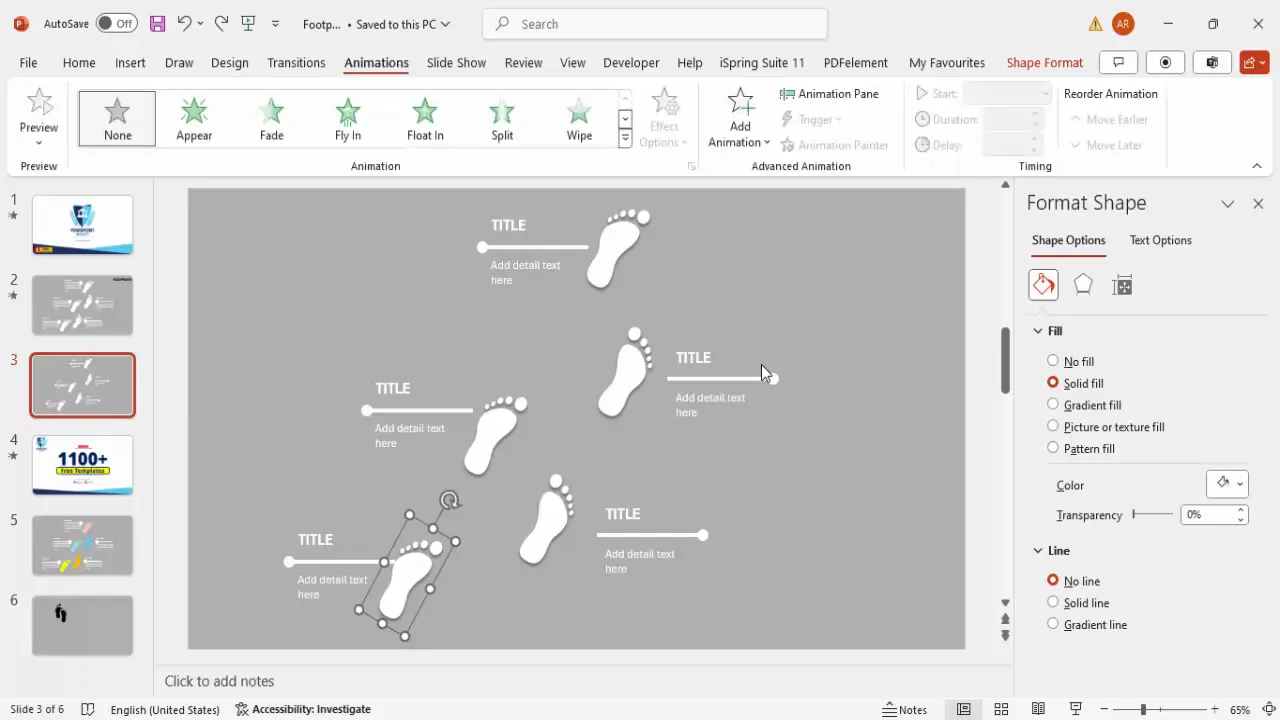
Step 12: Enable the Animation Pane
Go to the Animations tab and click Animation Pane to open the animation panel on the right side of your screen. This panel helps you manage and sequence your animations.
Step 13: Animate Footprints and Text
Apply the following animations:
- Select the first footprint and set its animation to Appear.
- Select the corresponding text group, then add a Stretch entrance effect.
- In the effect options, set the stretch to come from the right or left depending on the side of the slide.
- Set the text animation to start After Previous so it follows the footprint animation smoothly.
Use the Animation Painter tool to quickly copy the animation settings from one group to another, adjusting the direction (right or left) as needed for each step.
Step 14: Preview and Adjust Animations
Play the slideshow and click to reveal each footprint and its corresponding text sequentially. If desired, tweak animation timings or effects to better fit your presentation style.
Tips for Effective PowerPoint Slide Design
Creating a footprint infographic slide is an excellent exercise in PowerPoint slide design. Here are some additional tips to keep your slides professional and engaging:
- Consistency is Key: Maintain consistent font styles, sizes, and colors across the slide for a polished look.
- Use White Space Wisely: Don’t overcrowd the slide. Adequate spacing between footprints and text improves readability.
- Keep Text Concise: Use short titles and bullet points to make information digestible.
- Leverage Grouping: Group related elements to move and animate them easily.
- Test Animations: Always preview animations in slideshow mode to ensure smooth transitions.
- Match Your Brand: Customize colors and fonts to align with your corporate branding for a cohesive presentation.
- Backup Your Design: Save your work frequently and consider exporting your slide as an image or PDF for sharing.
Frequently Asked Questions (FAQ)
What is the easiest way to insert footprint icons in PowerPoint?
The easiest method is to use PowerPoint’s built-in Icons feature under the Insert tab. Simply search for “foot” and select the footprint icon you like.
Can I customize the footprint icons after inserting them?
Yes! Convert the icon to shapes via the Graphic Format tab by selecting Convert to Shape. This lets you edit individual parts, change colors, add effects, and resize without distortion.
How do I create a stepping effect with footprint icons?
Duplicate the grouped footprints and arrange them sequentially with slight rotations and horizontal/vertical offsets to simulate walking steps.
Is it possible to animate footprints and text separately?
Absolutely. Use the Animation Pane to assign different entrance effects to footprints and their corresponding text boxes, sequencing them to appear step-by-step.
Can I use different colors for each footprint?
Yes, applying different colors can make your infographic more vibrant and help differentiate each step. However, a monochromatic scheme like white on gray can also be very clean and effective.
What fonts and sizes work best for text on infographic slides?
Use bold, sans-serif fonts for titles (e.g., Arial, Calibri, or Segoe UI) with font sizes around 24-28 pt for titles and 16-20 pt for descriptive text to ensure readability.
Can I reuse this footprint infographic slide design for other presentations?
Definitely. Once created, you can duplicate the slide and modify the text and colors to suit different topics or branding requirements.
Conclusion
Creating a footprint infographic slide in PowerPoint is a powerful way to visualize processes, journeys, or stepwise instructions in your presentations. By following this detailed guide, you can build a professional slide that communicates your message clearly and keeps your audience engaged.
Key takeaways include:
- Start with a neutral background to make your footprints and text stand out.
- Leverage PowerPoint’s icon library and convert icons to shapes for customization.
- Use grouping and duplication to efficiently create multiple footprint steps.
- Add connecting lines and text boxes to explain each step clearly.
- Customize colors and apply subtle effects for visual appeal.
- Use animations to reveal steps sequentially, enhancing interactivity.
Investing time in designing such infographic slides enhances your overall PowerPoint slide design skills and helps you deliver presentations that are both informative and visually captivating. Whether for business, education, or creative storytelling, footprint slides are a versatile tool in your presentation toolkit.
Keep experimenting with colors, layouts, and animations to find what best fits your style and audience. Happy designing!
Check out the full video: Create Footprint Infographic Slide in PowerPoint


