
Creating visually appealing and engaging PowerPoint slides can sometimes feel like a daunting task—especially when you want to go beyond the default templates and add custom designs that truly capture attention. Today, I’m going to walk you through a detailed, step-by-step process to design a dynamic five-step infographic slide in PowerPoint. This tutorial will help you bring your presentations to life by combining custom shapes, color variations, icons, and text, all while maintaining a professional and polished look.
This guide is inspired by my extensive experience in PowerPoint slide design and is tailored to help you master the art of creating custom infographic slides that can be adapted for business presentations, educational content, or any scenario where you need to clearly communicate a multi-step process.
Table of Contents
- Introduction to Custom PowerPoint Slide Design
- Creating Custom Curved Shapes for Your Slide
- Applying Color Schemes and Layering for Visual Impact
- Adding Icons and Text for Clear Communication
- Optional: Adding Basic Animations to Enhance Engagement
- Final Tips for Professional PowerPoint Slide Design
- Frequently Asked Questions (FAQ)
Introduction to Custom PowerPoint Slide Design
PowerPoint is an incredibly versatile tool, but the true power lies in how creatively you can use its features to design slides that stand out. The five-step infographic slide is a classic example of how you can visually break down a process into digestible, actionable steps, making it easier for your audience to follow along.
In this tutorial, I’ll show you how to create a slide where each step is highlighted with a distinctive color and includes icons, titles, and supporting text. The design is intuitive—when you click, the corresponding step lights up, guiding your audience through the information step-by-step.
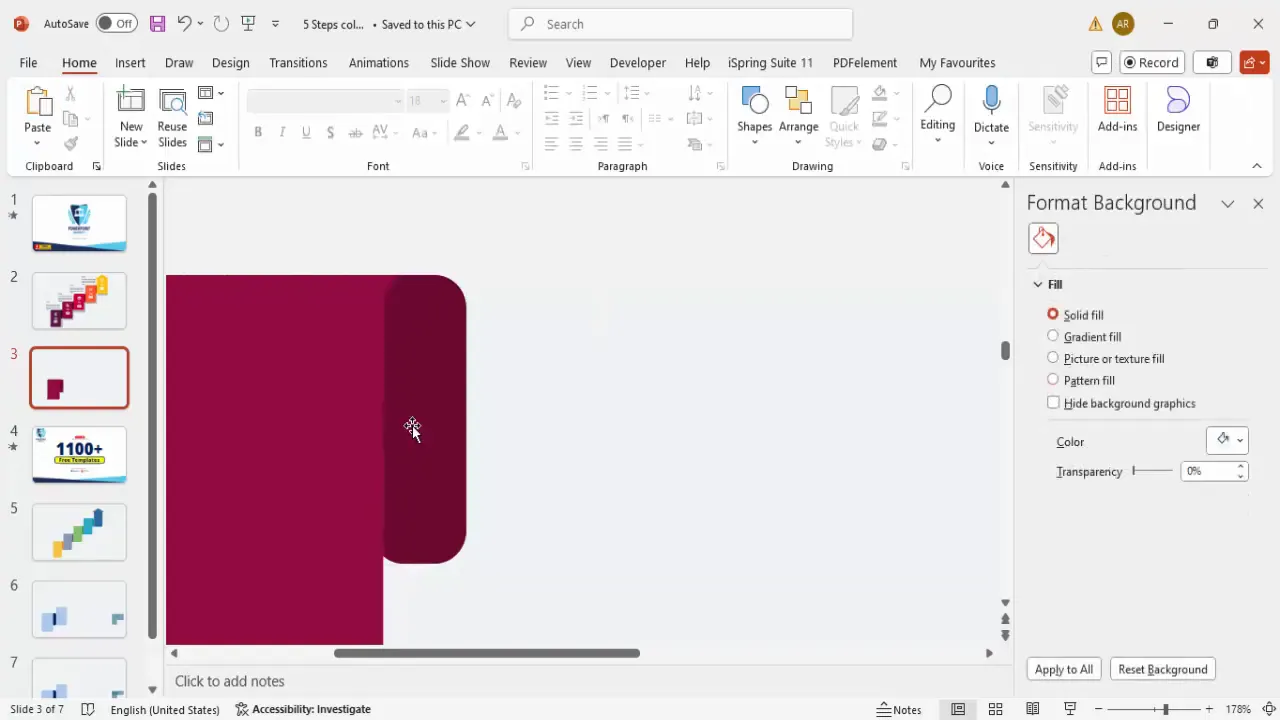
Before we dive into the details, make sure to set your slide background to a light color to enhance visibility and contrast for your shapes and text.
Creating Custom Curved Shapes for Your Slide
One of the biggest challenges in PowerPoint slide design is finding the right shapes that fit your vision. The curved shapes used at the top and bottom of each step segment in this infographic are not available as default shapes in PowerPoint, so we need to create them manually.
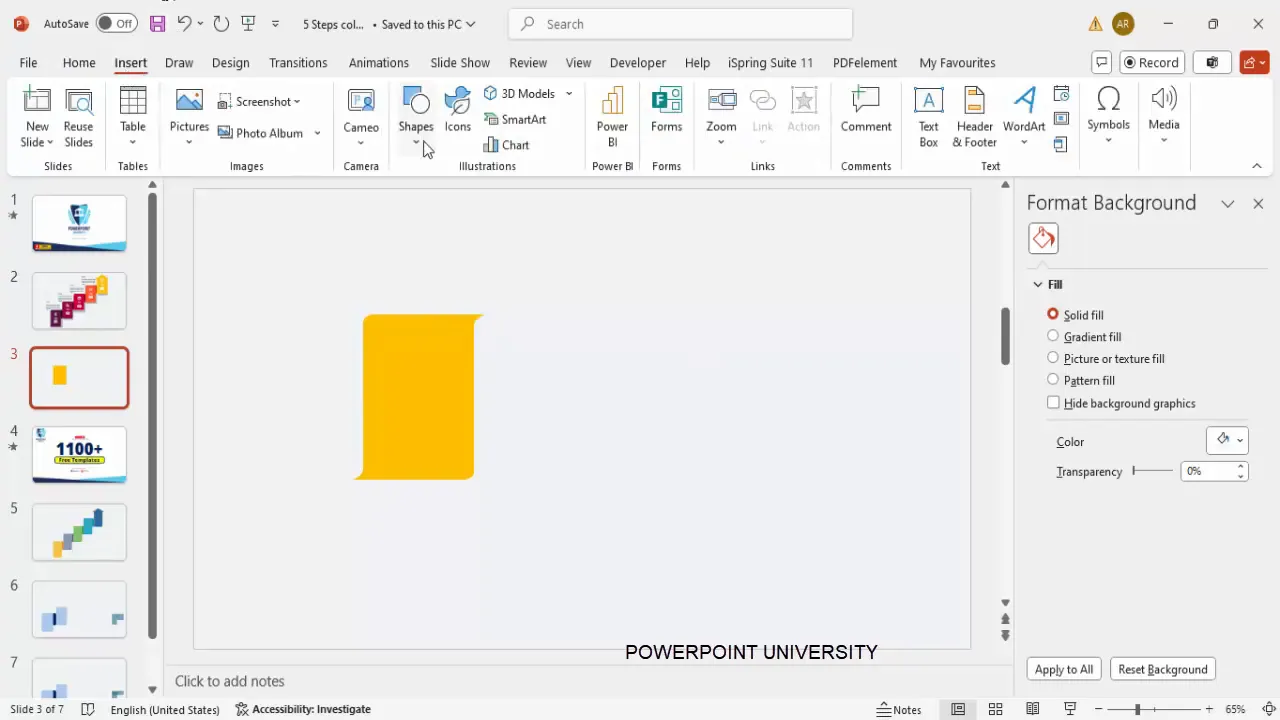
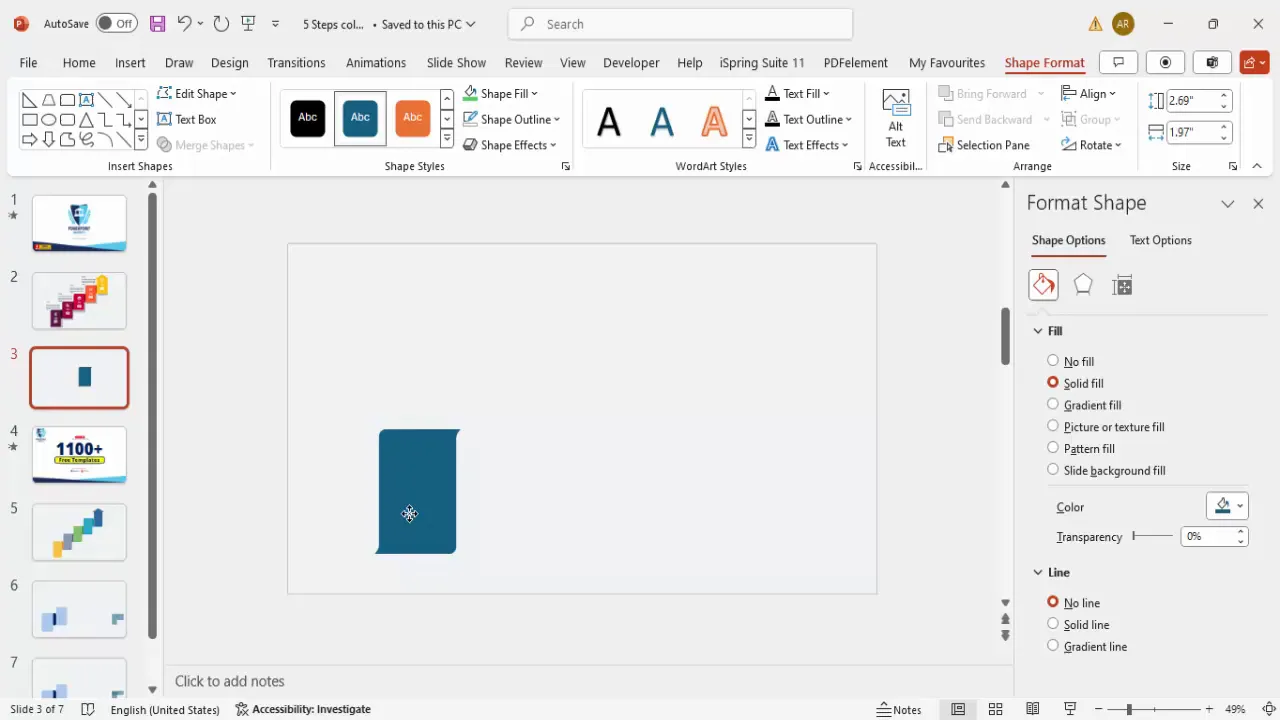
Step 1: Drawing the Base Rectangle
- Go to Insert > Shapes and select the Rectangle tool.
- Draw a rectangle of the desired size for your step block.
- Remove the outline by setting Shape Outline to No Outline.
- Adjust the transparency to around 30-40% so you can see the overlapping shapes clearly during editing.
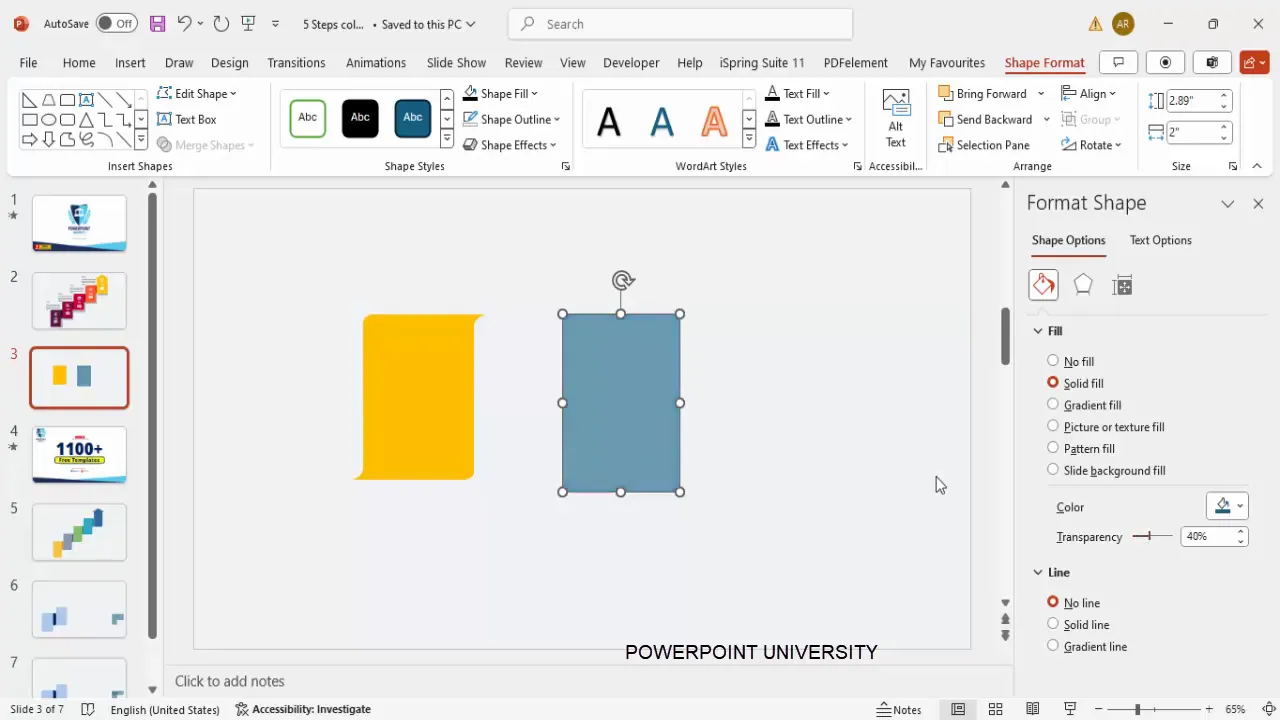
Step 2: Creating the Curved Edges Using Rounded Rectangles
- Insert a small Rounded Corner Rectangle shape.
- Make this shape transparent and remove the outline.
- Position it strategically on the top edge of the base rectangle to create the curved effect.
- Duplicate this shape by pressing Ctrl + D and resize it to cover the area you want to cut for the curve.
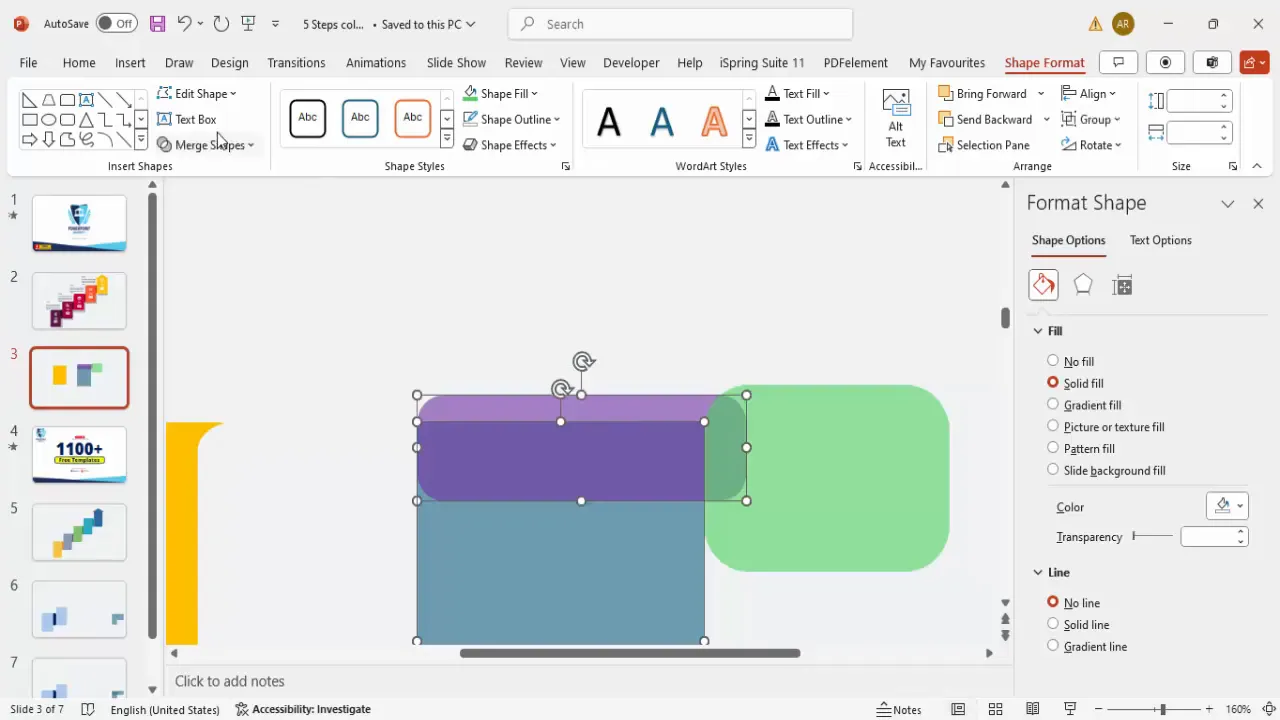
Next, we’ll merge and subtract shapes to create the curves:
- Select the base rectangle and then the rounded rectangle while holding the Shift key.
- Go to Shape Format > Merge Shapes and choose Union to combine them.
- Then select this new shape and the duplicate rounded rectangle.
- Use Subtract to cut the curved area, creating the desired top curve.
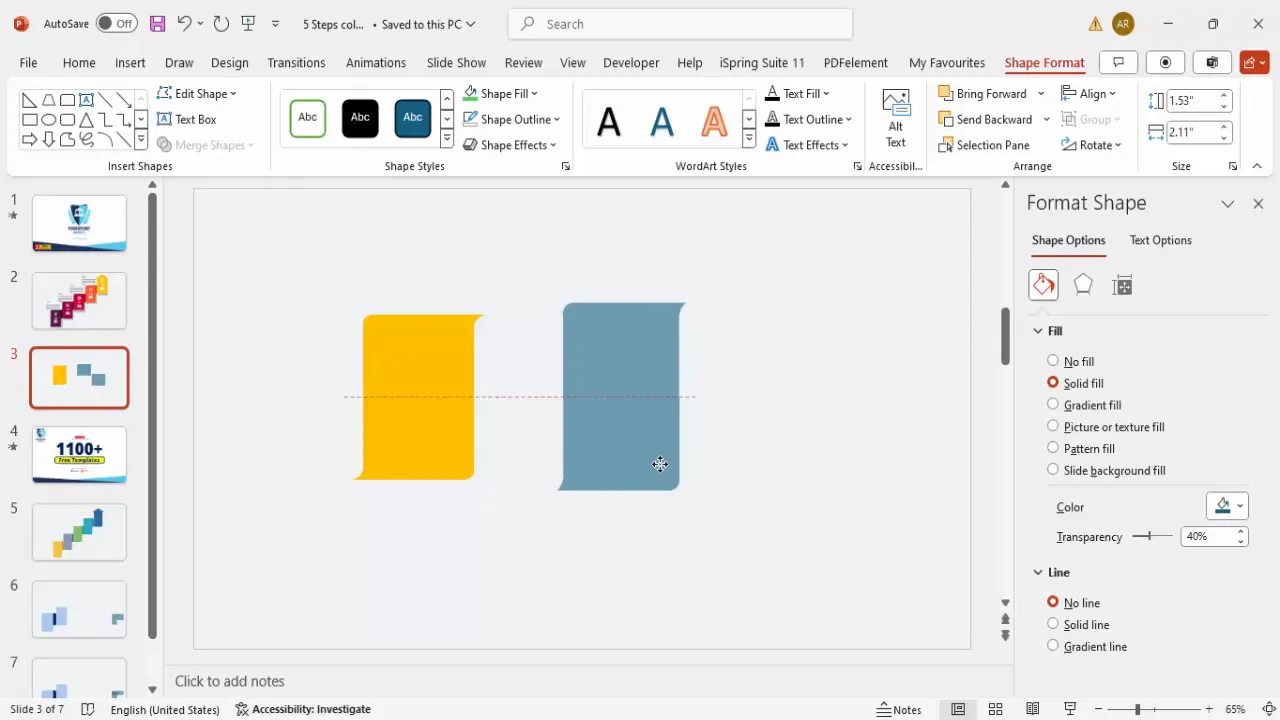
Step 3: Creating the Bottom Curve
The bottom curve is created similarly:
- Insert a rectangle that covers half of the height of your new shape.
- Select this rectangle along with your merged shape and apply Subtract to cut the bottom portion.
- Duplicate the resulting shape, flip it vertically and horizontally, and align it to the other side.
- Finally, select both halves and merge them into a single shape using Union.
Step 4: Refining the Shape
Adjust the height of the shape to fit your design requirements, and set transparency back to 0% to make the shape fully visible. This base shape will be the foundation for each step in your infographic.
Step 5: Adding Depth with Layered Rounded Rectangles
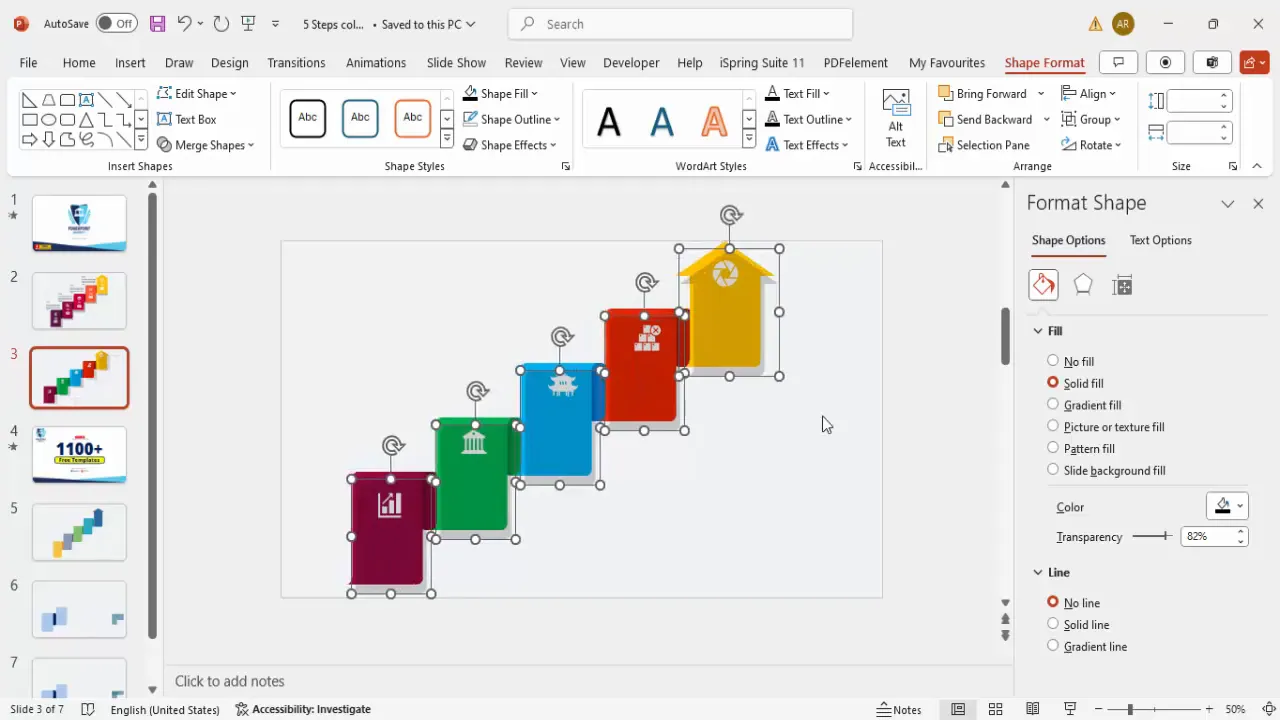
To add a subtle 3D effect and depth to the shape, insert a small rounded corner rectangle, color it darker than your base shape, and position it along the curve. Send this shape to the back to create a layered look. This adds visual interest and makes your slide look more professional.
Applying Color Schemes and Layering for Visual Impact
Color plays a crucial role in PowerPoint slide design, especially when you want to distinguish between multiple steps. Here’s how you can apply effective color schemes and layering:
Step 1: Choose Your Color Palette
Select a set of contrasting yet harmonious colors for your five steps. For example:
| Step | Base Color | Darker Shade |
|---|---|---|
| Step 1 | Purple | Darker Purple |
| Step 2 | Green | Darker Green |
| Step 3 | Blue | Darker Blue |
| Step 4 | Orange | Darker Orange |
| Step 5 | Teal (or any other choice) | Darker Teal |
You can customize these colors according to your brand or presentation style. Use More Colors in PowerPoint to tweak shades for a consistent look.
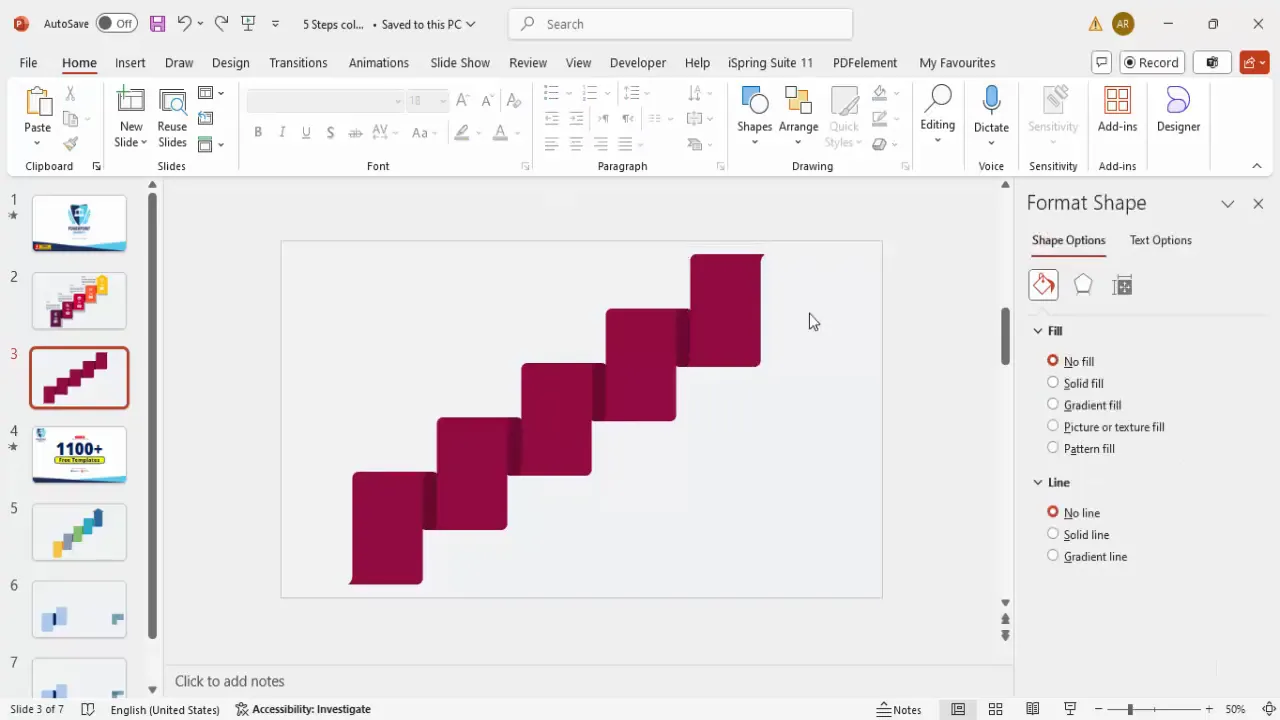
Step 2: Duplicate and Arrange Shapes for Each Step
- Select your base shape and its depth layer, then press Ctrl + D to duplicate.
- Arrange and stack the shapes vertically or horizontally depending on your slide layout.
- Adjust the size and spacing to fit your slide neatly.
- Use Group (Ctrl + G) to keep the shapes organized.
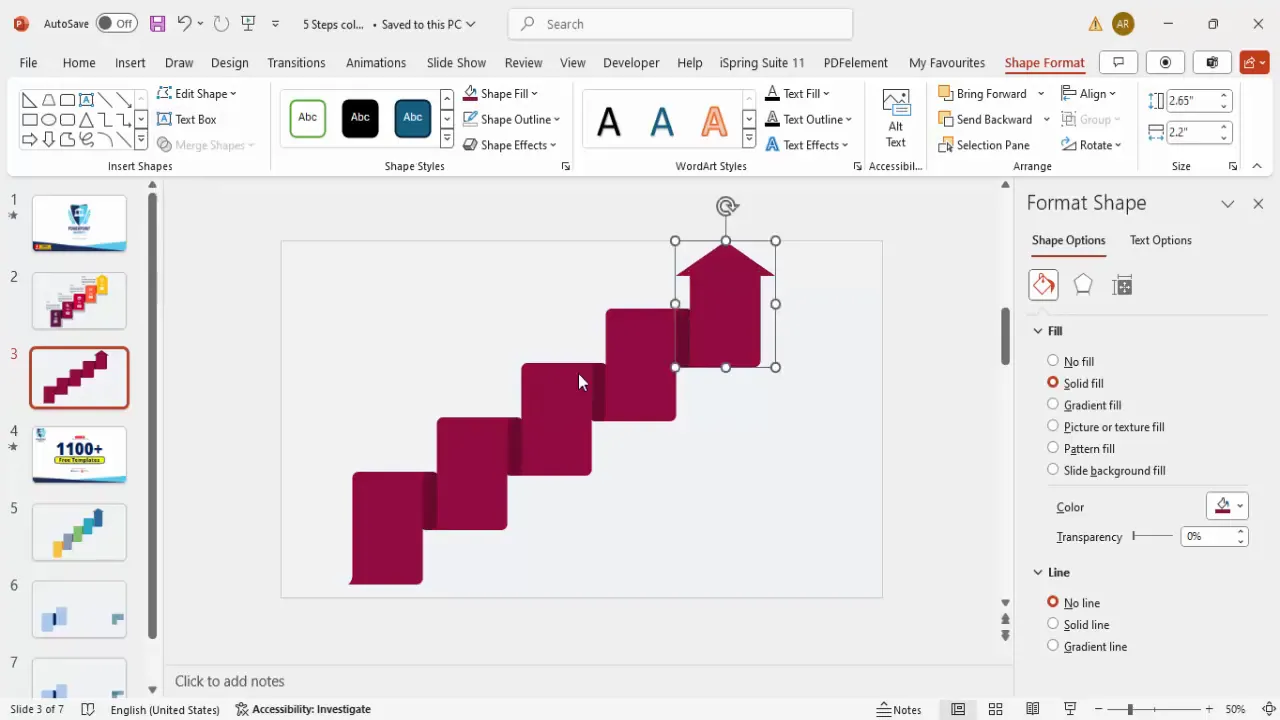
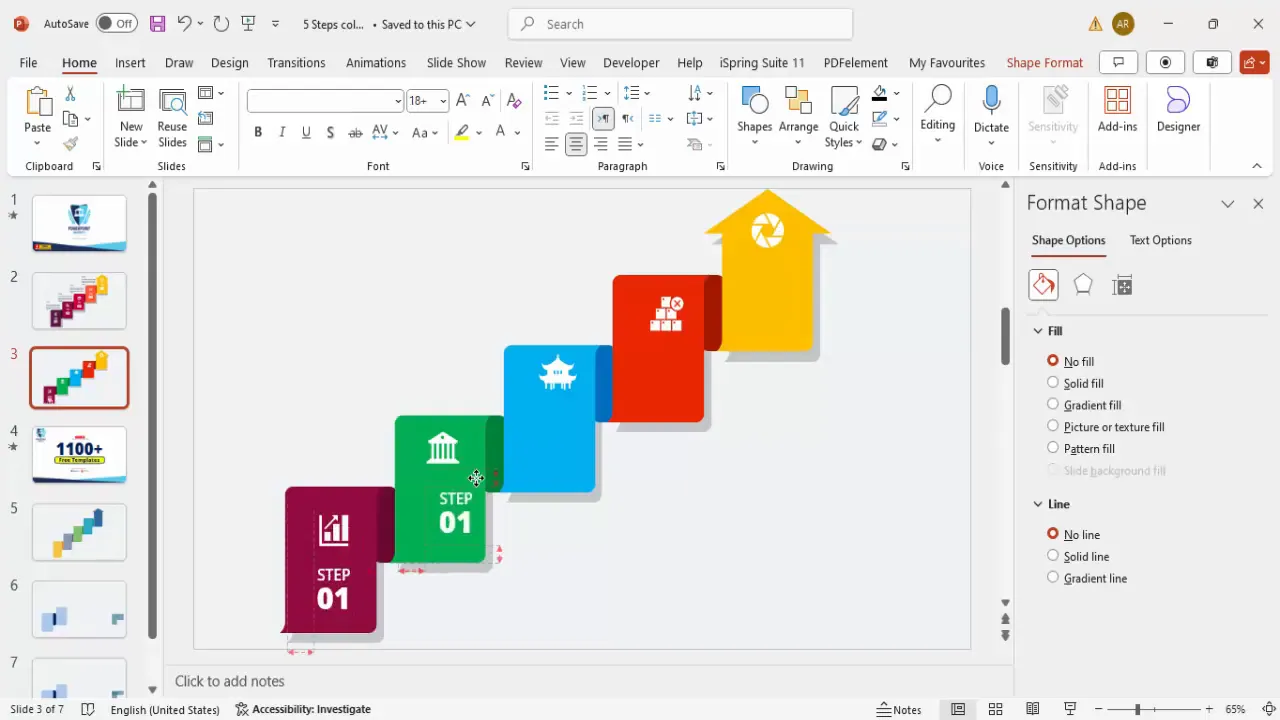
Step 3: Adding Arrowheads for Direction
To visually indicate progression through the steps, add arrowheads at the top or side of each shape:
- Insert a small rectangle and a triangle shape aligned to form an arrowhead.
- Remove outlines and color them to match your step’s color scheme.
- Merge the rectangle and triangle using Union for a clean arrow shape.
- Position the arrowhead on the shape to indicate flow.
Adding Icons and Text for Clear Communication
Icons and text are essential to help your audience quickly grasp the meaning of each step. Here’s how to add them effectively:

Step 1: Insert Icons
- Go to Insert > Icons in PowerPoint.
- Choose icons that are relevant to each step’s content or theme.
- Insert the icons and resize them to fit neatly inside your infographic shapes, around 0.7 font size equivalent.
- Fill the icons with white or a contrasting color for visibility.
You can also add a subtle shadow effect to icons to enhance their presence:
- Duplicate the icon (Ctrl + D).
- Change the duplicate’s color to black and increase transparency.
- Offset it slightly behind the original icon and send it to back.
Step 2: Add Step Numbers and Titles
- Insert a text box for the step number (e.g., “Step 01”).
- Use a bold, clean font such as Open Sans Semi Bold or Extra Bold to make the numbers stand out.
- Position the step number prominently on the shape.
- Add another text box below the number for the step title, making it bold but smaller than the number.
- Group the number and title together for easy duplication and alignment.
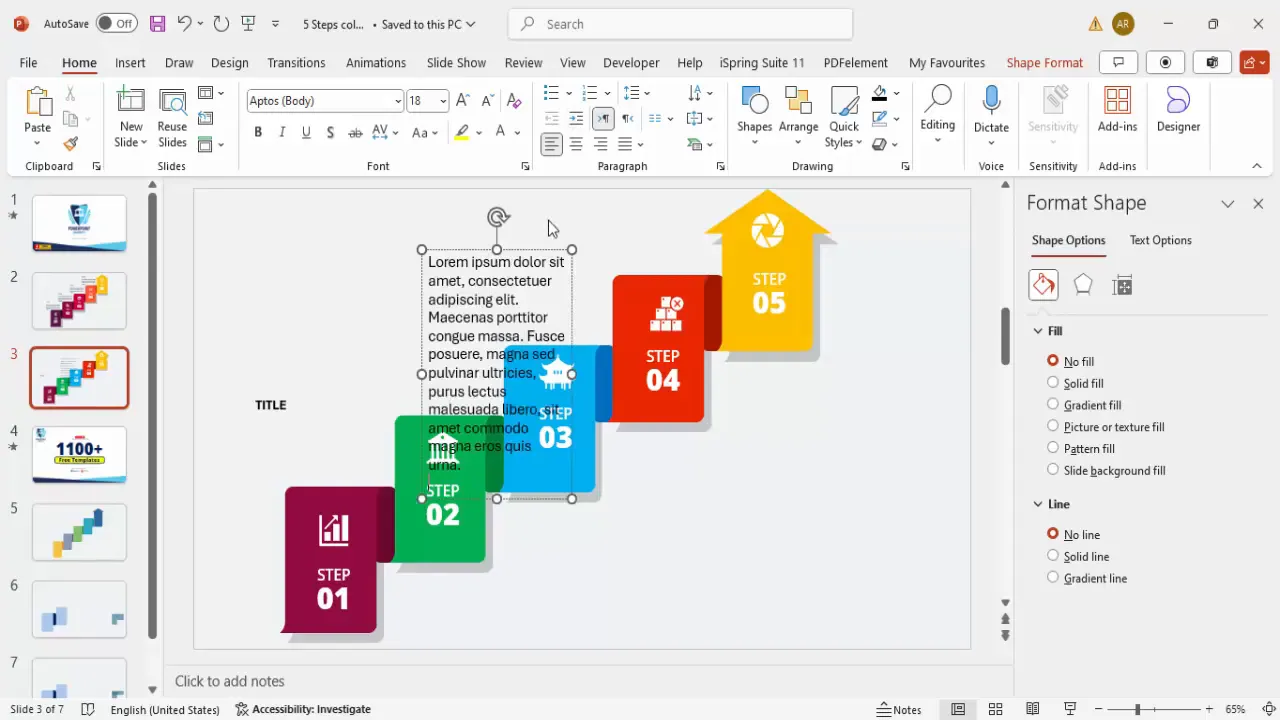
Step 3: Insert Descriptive Text
Below each step title, add a text box for detailed description or explanation. Keep the text concise but informative:
- Use placeholder text like “Lorem ipsum” while designing, then replace with your real content.
- Keep the font size readable but not too large—usually 12 to 14 pt works well.
- Align the text consistently across all steps.
- Group the description with the step title and number for easier management.
Optional: Adding Basic Animations to Enhance Engagement
To make your infographic slide interactive and engaging, consider adding simple animations:
- Use Click trigger animations to highlight each step as you move through the presentation.
- Fade in icons, text, and shapes one by one to focus audience attention.
- Keep animations subtle and professional—avoid overly flashy effects.
- You can also keep the slide static if you prefer a clean, no-animation approach.
Final Tips for Professional PowerPoint Slide Design
Here are some key takeaways to ensure your PowerPoint slide design looks polished and effective:
- Consistency: Use consistent colors, fonts, and sizes across all steps to maintain visual harmony.
- Alignment: Properly align all elements using PowerPoint’s alignment guides for a clean layout.
- Whitespace: Don’t overcrowd your slide; allow breathing room around text and icons.
- Contrast: Ensure text and icons contrast well against the background colors for readability.
- Grouping: Group related elements to make moving and editing easier.
- Save your template: Once your infographic is complete, save it as a custom template for future use.
Frequently Asked Questions (FAQ)
Q1: Can I customize the colors and shapes in this infographic?
Absolutely! The shapes are fully editable, and you can change colors, sizes, and positioning to match your brand or presentation style.
Q2: Are these infographic steps animated?
Animations are optional. You can add simple fade-in or click-trigger animations to highlight each step, or keep it static depending on your preference.
Q3: Can I use different icons for each step?
Yes, PowerPoint’s icon library allows you to insert any icons that fit your content. Choose icons that visually represent each step’s purpose for maximum impact.
Q4: How can I make sure my slide looks professional?
Focus on consistent use of fonts, colors, and alignment. Avoid clutter, use whitespace effectively, and keep text concise. Group your elements to maintain structure.
Q5: Is this infographic slide suitable for all presentation types?
This slide is versatile and can be adapted for business, education, project planning, marketing funnels, or any multi-step process presentation.
Conclusion
Designing a custom five-step infographic slide in PowerPoint is a fantastic way to visually communicate processes in a clear, engaging, and professional manner. By creating custom curved shapes, applying cohesive color schemes, integrating meaningful icons, and adding descriptive text, you enhance your audience’s understanding and retention of your message.
Whether you’re a seasoned PowerPoint user or just starting, mastering these design techniques empowers you to create slides that not only look great but also tell your story effectively. Remember, the key to effective PowerPoint slide design is balancing creativity with clarity—making sure your visuals support, not overshadow, your content.
Start experimenting with these steps today, and watch your presentations transform into compelling visual narratives!
Check out the full video: This is how to create the Steps Design PPT


