
Creating visually appealing and effective PowerPoint presentations is a skill every professional needs. Whether you’re preparing for a business meeting, a training session, or a conference, a well-designed slide can communicate your message clearly and impress your audience. In this comprehensive guide, we’ll walk through the step-by-step process of designing a neat and clean four-step infographic slide in PowerPoint.
This tutorial is inspired by expert techniques from POWERPOINT UNIVERSITY, a trusted source for free PowerPoint templates and design tutorials. By the end of this article, you’ll be able to design an engaging infographic slide that combines icons, colors, text, and animations seamlessly to keep your presentation dynamic and professional.
Keyphrase: PowerPoint Slide Design
Table of Contents
- Why Use Infographic Slides in PowerPoint
- Preparing the Slide: Setting the Background and Guides
- Creating the Base Shape Using Trapezoids and Rounded Rectangles
- Adding Lines and Arrows for Visual Flow
- Designing Accent Triangles for Style
- Inserting Icons and Adding Text Content
- Duplicating and Coloring Multiple Steps
- Adding Animation Effects to Enhance Interaction
- Frequently Asked Questions
- Conclusion
Why Use Infographic Slides in PowerPoint
Infographic slides are powerful tools to present complex information in a visually digestible manner. They are especially useful when you want to:
- Break down processes into clear, step-by-step visuals
- Highlight key points or milestones in a project
- Engage your audience with colorful and dynamic elements
- Use icons and graphics to reinforce your message
Incorporating infographics into your PowerPoint Slide Design not only enhances understanding but also keeps your audience’s attention throughout the presentation.
Preparing the Slide: Setting the Background and Guides
Before diving into shapes and icons, start by preparing your PowerPoint slide to create a clean workspace:
- Add a new slide: Insert a fresh slide where your infographic will be built.
- Choose a light background color: Select a subtle, light-colored background to ensure your shapes and text stand out clearly. Light backgrounds reduce eye strain and make colors pop.
- Enable guides: Go to the View tab and enable Guides to help align your shapes and text precisely. Guides are essential for maintaining balance and symmetry in your design.
Setting these basics paves the way for a professional and well-aligned slide.
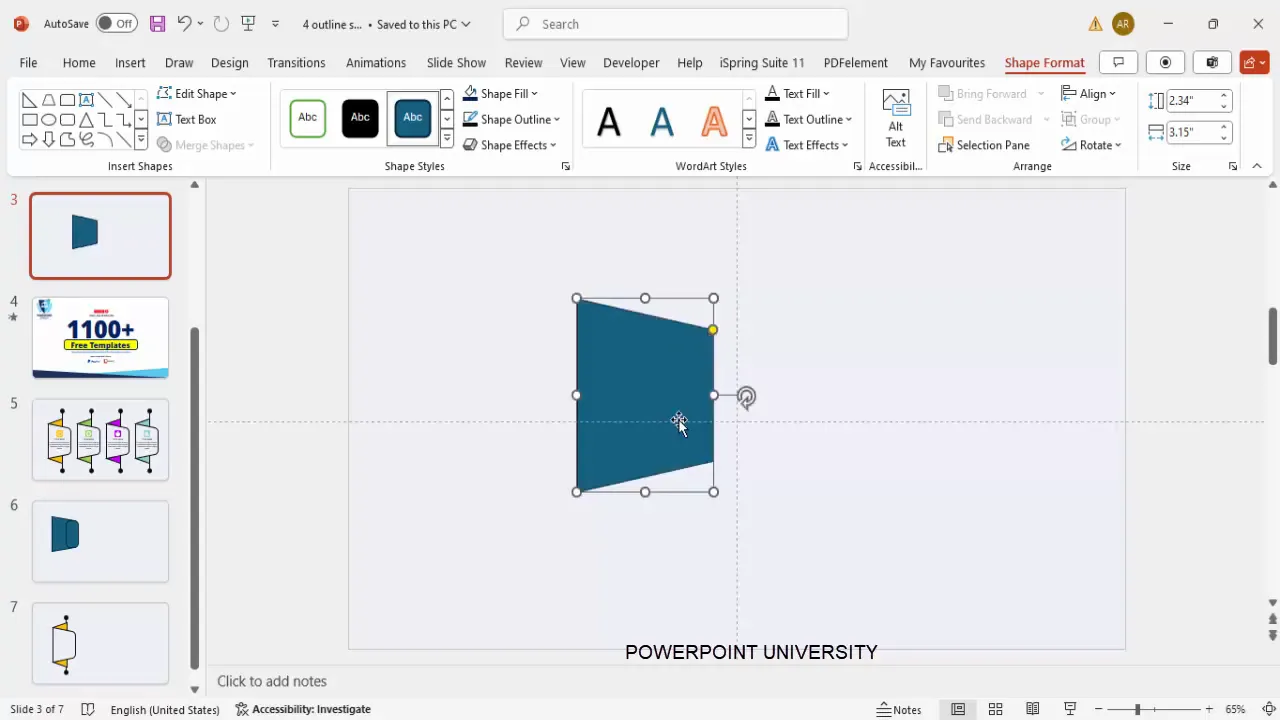
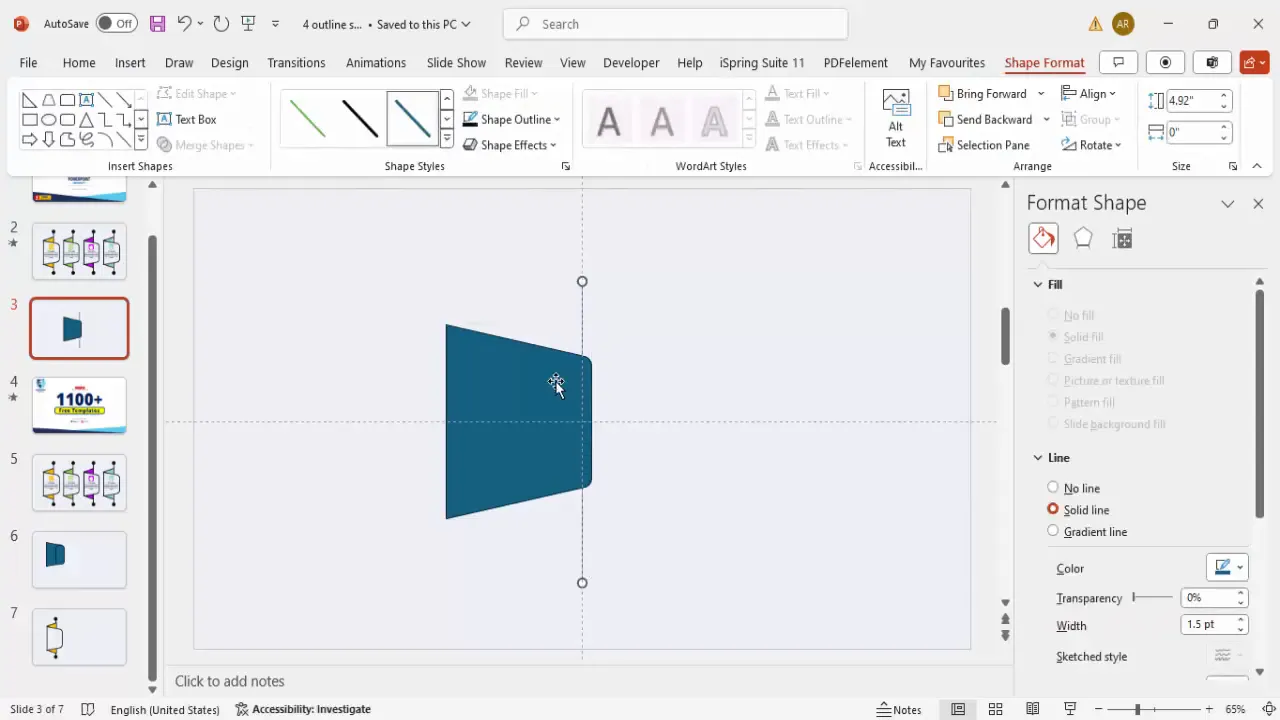
Creating the Base Shape Using Trapezoids and Rounded Rectangles
The core of the infographic step is a custom-shaped block that combines sharp and curved edges for a modern look. Here’s how to create it:
- Insert a trapezoid: From the Insert > Shapes menu, select the Trapezoid shape from the basic shapes category.
- Draw and rotate: Draw the trapezoid on the slide, then rotate it 90 degrees to the right using the Rotate options under the Shape Format tab.
- Adjust height: Resize the trapezoid by adjusting its height while keeping its width consistent. Make sure the shape is centered on the slide.
- Create a rounded corner: Insert a Rounded Rectangle from the Rectangles section of shapes. Draw a small rounded rectangle and position it on the right side of the trapezoid where you want the corner to be curved.
- Combine shapes: Select both the trapezoid and the rounded rectangle, then use the Merge Shapes > Union feature under the Shape Format tab to combine them into one shape with a pointed left corner and a curved right corner.
This custom shape forms the foundation of each step in the infographic.
Adding Lines and Arrows for Visual Flow
To guide the viewer’s eye and indicate progression, adding a vertical line with arrows is effective:
- Insert a vertical line: Go to Insert > Shapes and select the Line tool. Hold Shift while drawing a vertical line to keep it straight.
- Style the line: Set the line’s outline color to black or another color that complements your design. Increase the line weight to around 0.5 pt (two quarters) for visibility.
- Add arrowheads: Under Shape Outline > Arrows, select oval-shaped arrowheads for both the beginning and end of the line, setting their size to the largest available. This creates a unique and polished arrow effect.
- Send line to back: Right-click the line and choose Send to Back to place it behind the main shape.
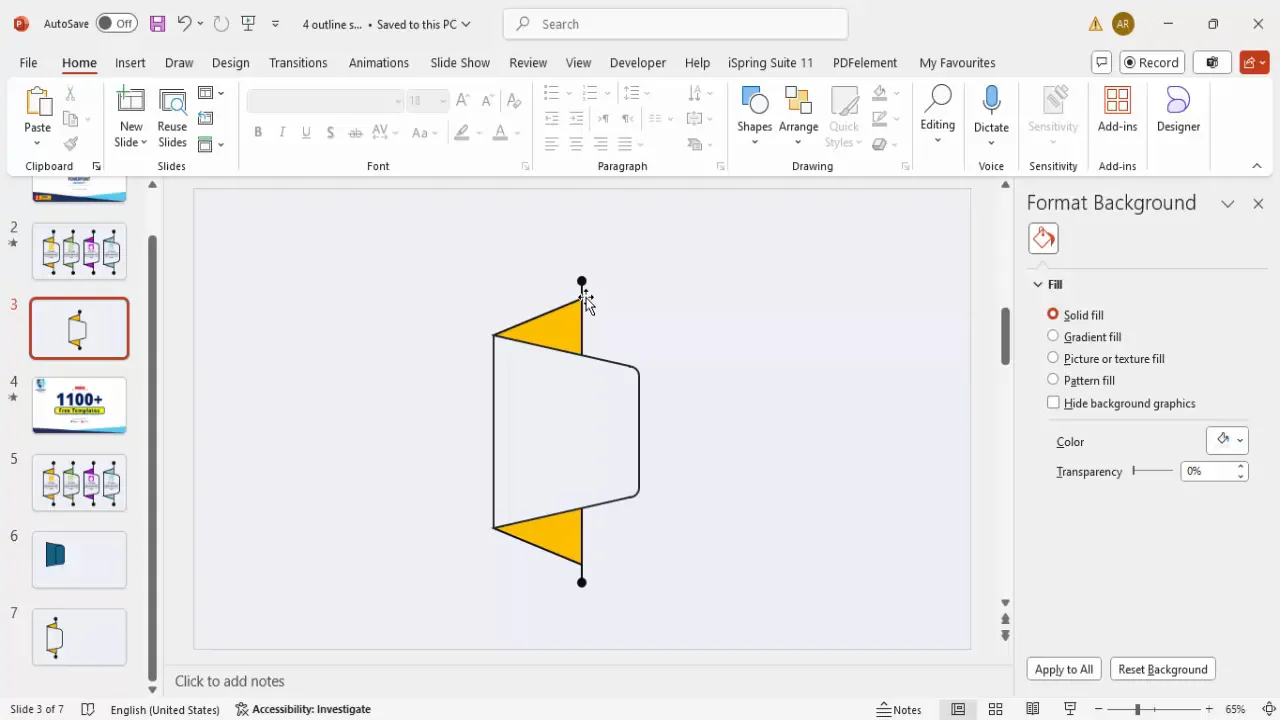
Designing Accent Triangles for Style
Adding small triangular accents on the left side of the base shape enhances the design by adding depth and visual interest:
- Insert triangles: From Insert > Shapes, select the Triangle shape.
- Style the triangles: Choose a fill color like orange or another bright accent color. Set the outline color to match the line color and adjust the weight to the same as the line (two quarters).
- Rotate and position: Rotate the triangles using the circular rotation handle or the Rotate option to align them with the base shape’s edges.
- Send to back: Send the triangles behind the base shape to layer them correctly.
- Duplicate: Hold Ctrl + Shift and drag the triangle to create a second one below the first, maintaining consistent spacing.
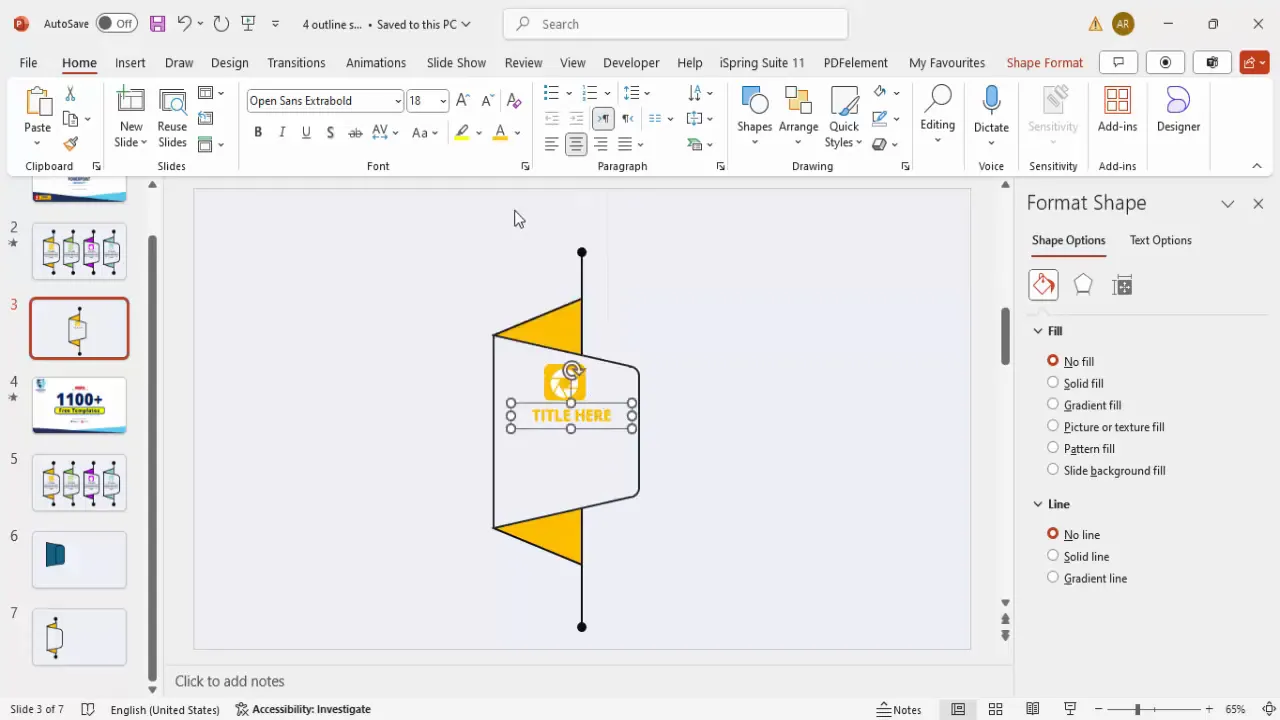
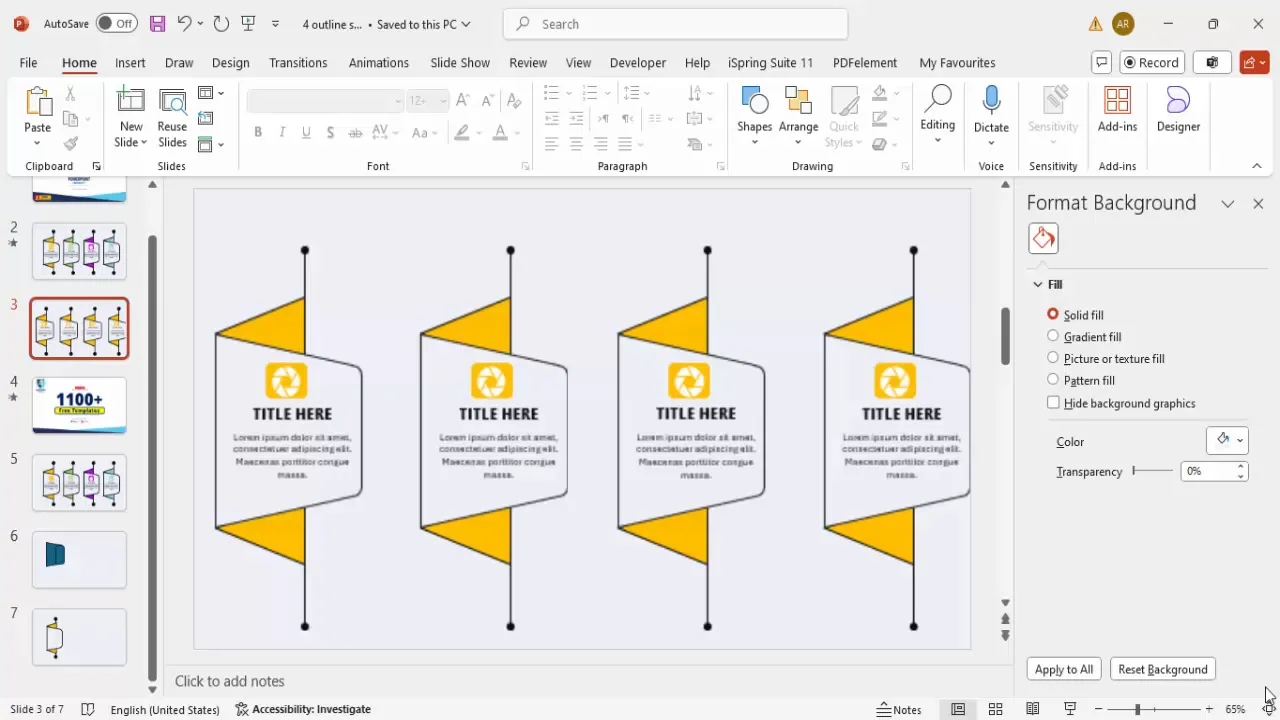
Inserting Icons and Adding Text Content
With the base design ready, it’s time to bring in icons and text to communicate your message clearly. Follow these steps:
- Insert icons: Go to Insert > Icons and choose icons that are relevant to each step in your infographic. For example, you could use a light bulb for ideas, a gear for processes, or an apple for education.
- Resize icons: Adjust the icon size to fit neatly inside the infographic step, typically around 0.6 in height.
- Create a rounded rectangle background: Insert a small rounded rectangle behind the icon. Set the fill color to white and remove the outline for a clean look. Bring it to front to ensure the icon sits on top of it.
- Add title text: Insert a text box above or beside the icon and type your step title. Use a clean, bold font like Open Sans Extra Bold. Center-align the text and match the font color with your design’s color palette.
- Add detailed text: Insert another text box below the title for descriptive content. Keep the font size smaller (around 12 pt) for readability and limit the text to a few lines to avoid clutter.
Duplicating and Coloring Multiple Steps
To create a four-step infographic, duplicate the first step and customize the colors and icons for each:

- Group the first step: Select all objects (shapes, icons, and text) related to the first step and press Ctrl + G to group them.
- Duplicate the step: Hold Ctrl + Shift and drag the grouped step to the right. Repeat this until you have four steps aligned horizontally.
- Adjust colors: Select each step and change the fill and outline colors to different shades (e.g., green, blue, purple, orange) to create visual variety and to differentiate the steps.
- Change icons: Use the Graphic Format > Change Graphics > Icons option to swap icons for each step to match the content.
- Fine-tune alignment: Ensure all steps fit neatly within the slide and are evenly spaced.
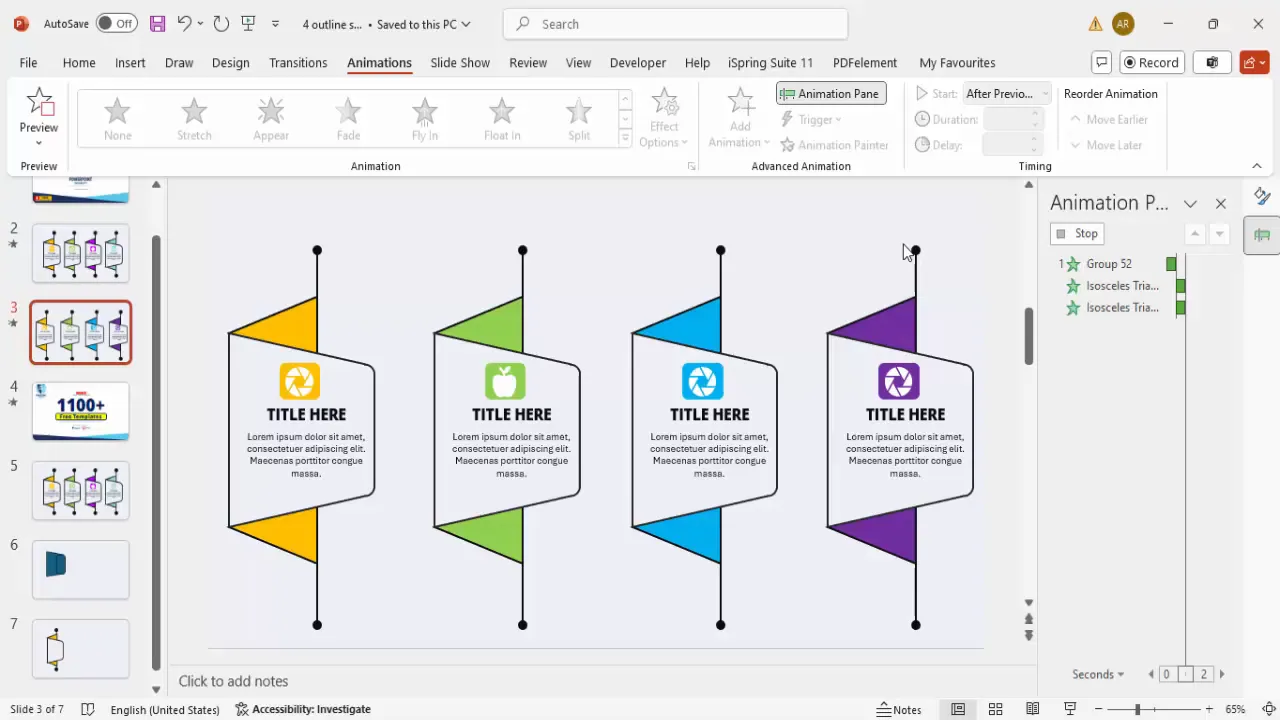
Adding Animation Effects to Enhance Interaction
Animations add a dynamic touch to your infographic, helping to control the flow of information during your presentation. Here’s how to apply them:
- Ungroup and regroup: Select all grouped steps and press Ctrl + Shift + G to ungroup. Then, regroup only the main shapes and icons for each step separately to isolate animation targets.
- Open animation pane: Go to the Animations tab and enable the Animation Pane for better control.
- Add stretch animation: Select the first step’s group and apply the Stretch animation effect from the More Intense Effects category. Set it to stretch from the right.
- Animate triangles: Apply the same stretch animation to the triangles, but set them to stretch from the left and start After Previous.
- Use animation painter: Use the Animation Painter tool to copy the animation settings from the first step to the other steps for consistency.
- Adjust timing: Ensure each step’s animation starts After Previous to create a smooth sequence.
- Remove unwanted animations: Check for any accidental animations applied to lines or other elements and remove them.
- Preview: Run the slideshow to verify the animations play in the correct order and look clean.
Frequently Asked Questions
How can I customize colors to match my brand?
To customize colors, select the shapes and text boxes you want to change, then go to the Shape Format or Text Format tab. Use the Shape Fill or Font Color options to pick colors from your brand palette. You can also save custom colors in PowerPoint’s theme colors for consistency across slides.
Can I add more than four steps?
Yes! The design is flexible and scalable. After creating the first four steps, you can duplicate additional steps as needed. Just make sure to adjust the slide layout or slide width to accommodate more steps without overcrowding.
What fonts work best for infographic slides?
Sans-serif fonts like Open Sans, Arial, Calibri, or Helvetica are excellent choices for infographic slides because they are clean and highly readable. Use bold or extra-bold weights for titles and regular or light weights for body text to maintain hierarchy.
How do I ensure my animations run smoothly?
Use the Animation Pane to control the timing and order of animations. Set animations to start On Click or After Previous as per your presentation flow. Avoid overusing animations to keep the slide professional and avoid distracting the audience.
Is it possible to use this design in other presentation software?
While this tutorial is specific to PowerPoint, most shapes and concepts can be recreated in other tools like Google Slides or Keynote. However, some features like advanced shape merging or specific animation effects might differ or be unavailable.
Conclusion
Mastering PowerPoint Slide Design is crucial for delivering compelling presentations that engage and inform your audience. By following this detailed guide on creating a neat and clean four-step infographic slide, you can transform ordinary content into visually appealing stories that resonate.
Remember, the key steps include preparing a clean slide background, crafting custom shapes with a mix of pointed and rounded edges, adding directional lines and accent triangles, inserting meaningful icons and concise text, and finally, applying smooth animations to enhance viewer engagement.
Experiment with colors, fonts, and icons to match your brand and presentation goals. With practice, you’ll be able to build a library of infographic slides that save you time and elevate the quality of your presentations.
Happy designing!
Check out the full video: Neat and Clean PPT Design


