
PowerPoint slides are a fundamental part of any professional presentation, and creating visually engaging slides can significantly elevate your communication. If you’re looking for a creative way to replace traditional bullet points and add a vibrant, professional flair to your presentations, this guide is for you. In this comprehensive tutorial, you’ll learn how to design a 5-option infographic slide using colorful rectangular shapes and icons, complete with animations, all in PowerPoint.
This step-by-step article will walk you through the entire process, from setting up your slide to adding dynamic animations, ensuring your slides stand out with clarity and style. Whether you’re a beginner or have some experience with PowerPoint, these instructions will help you build polished, easy-to-edit infographic slides that make your content pop.
Table of Contents
- Why Use Infographic Slides Instead of Bullet Points?
- Preparing the Slide and Setting Up the Background
- Creating the Rectangular Shapes for Each Option
- Adding Triangles and Merging Shapes for a Polished Look
- Customizing Colors for Visual Appeal
- Inserting and Styling Icons
- Adding Text: Option Numbers, Titles, and Details
- Duplicating and Arranging Options
- Grouping Shapes and Arranging Layers
- Adding Animations for Dynamic Presentation
- Frequently Asked Questions (FAQ)
- Conclusion
Why Use Infographic Slides Instead of Bullet Points?
Traditional bullet points, while functional, can sometimes make presentations feel bland or overwhelming, especially when you have multiple items to highlight. Infographic slides offer a visually engaging alternative that helps your audience quickly grasp key points and maintain interest.
- Enhanced Visual Appeal: Colorful shapes and icons make your content more attractive and easier to digest.
- Improved Clarity: Distinct sections with titles and details help organize information clearly.
- Greater Engagement: Animation and design elements can keep your audience focused and engaged.
- Easy Customization: Infographic elements are versatile and can be adapted for various topics and themes.
By using infographic slides, you replace monotonous lists with impactful visuals, making your presentations more memorable and professional.
Preparing the Slide and Setting Up the Background
The first step in creating your infographic slide is to prepare the workspace. Here’s how you can get started:
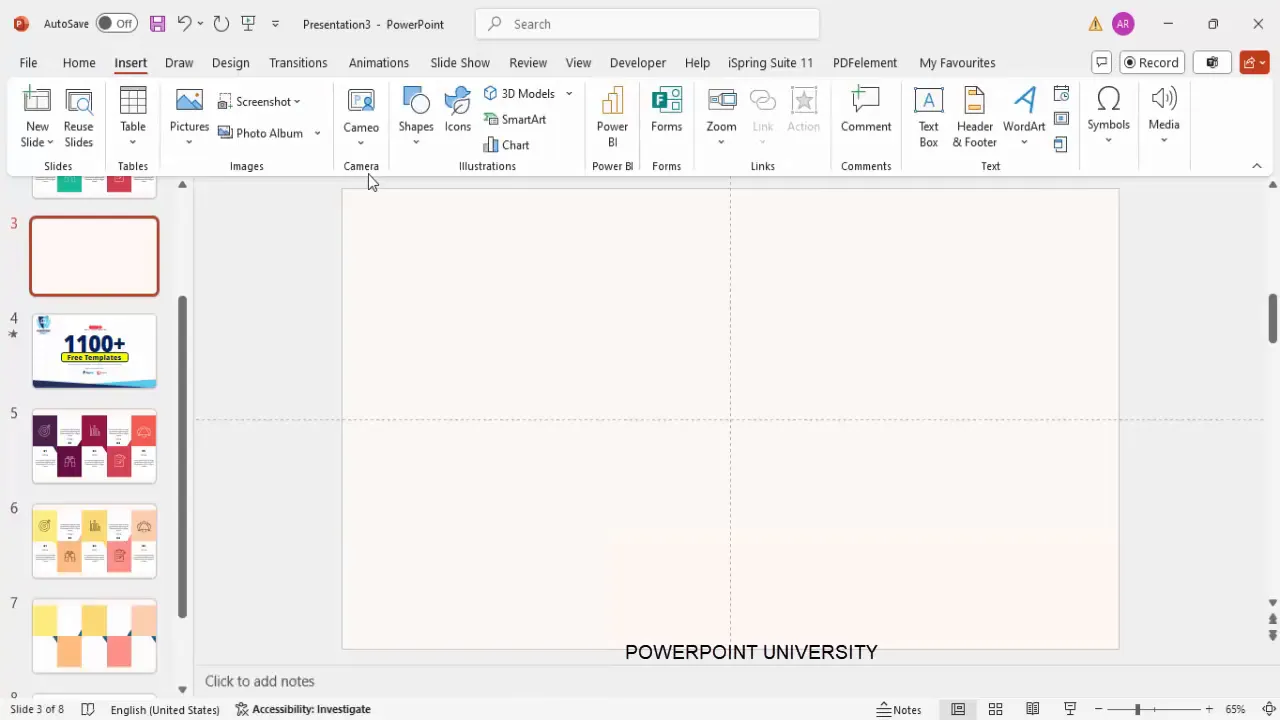
- Add a New Slide: Open your PowerPoint presentation and insert a new blank slide where you want to create the infographic.
- Set a Light Background Color: To ensure your colorful rectangles stand out, choose a light color for the slide background. This can be done by right-clicking on the slide background, selecting “Format Background,” and choosing a light color of your preference.
- Enable Guides: To align your shapes precisely, go to the View tab and enable Guides. This will help maintain consistent spacing and alignment throughout your design.
Having a clean, light background and visible guides ensures your infographic elements are well-positioned and visually balanced.
Creating the Rectangular Shapes for Each Option
Each option in your infographic will be represented by a colorful rectangular shape. Follow these steps to create the foundational shapes:
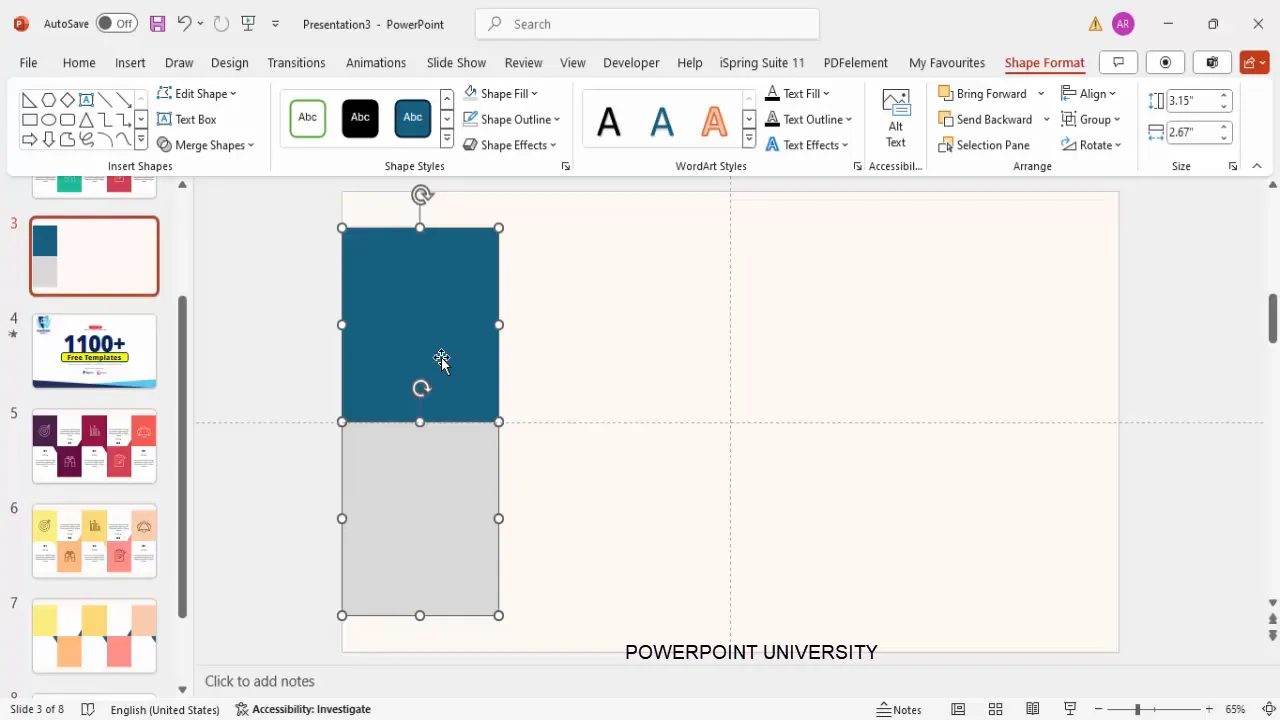
- Insert a Rectangle Shape: Go to Insert > Shapes and select the rectangle shape. Click once on the slide to place the shape.
- Set Shape Dimensions: With the rectangle selected, go to the Shape Format tab. Set the height to 3.15 inches and the width to 2.67 inches. This ensures uniformity across all options.
- Remove Shape Outline: For a clean look, set the shape outline to No Outline.
- Position the Rectangle: Place the rectangle on the left side of the slide where you want your first option to be.
- Duplicate the Rectangle: Press Ctrl + D to duplicate the rectangle. Change the color of the duplicate to a darker shade for contrast and place it exactly below the first rectangle.
- Select Both Rectangles and Duplicate to the Right: Select both rectangles, hold Ctrl + Shift, and drag to the right to create the second option. Repeat this for all five options.
Having two rectangles stacked for each option—a colored rectangle and a darker background rectangle—creates depth and visual interest.
Adding Triangles and Merging Shapes for a Polished Look
To enhance the design and create a unique shape for each option, add right triangles and merge them with the rectangles. Here’s how:
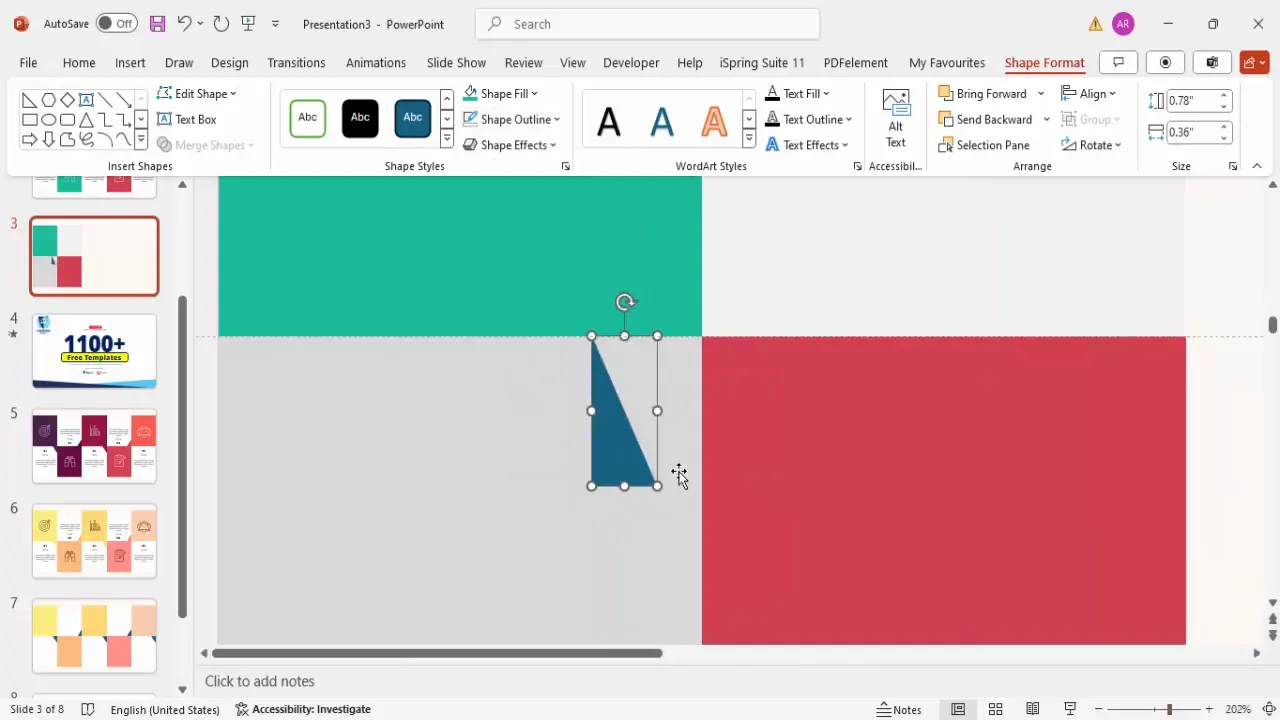
- Insert a Right Triangle: Go to Insert > Shapes and select the right triangle. Draw a small triangle near the edge of the upper rectangle.
- Remove the Outline: Set the triangle’s outline to No Outline.
- Flip the Triangle: Select the triangle, go to Shape Format > Rotate, flip vertically, then flip horizontally to position it correctly against the rectangle.
- Duplicate and Align: Duplicate the triangle and place it on the darker rectangle below, flipping vertically to align properly.
- Merge Shapes: Select the rectangle and the triangle, then go to Shape Format > Merge Shapes > Union to combine them into a single shape.
- Repeat for Both Rectangles: Perform the merge for both the top and bottom rectangles with their respective triangles.
This process gives the infographic options a sleek, arrow-like appearance that visually guides the viewer’s eye.
Customizing Colors for Visual Appeal
Color plays a vital role in making your infographic slide visually appealing. Follow these tips to customize your colors:
- Choose a Color Palette: Decide on a color scheme that fits your brand or presentation theme. You can use complementary or analogous colors to create harmony.
- Apply Different Colors to Each Option: Assign a unique color to each option’s rectangle, maintaining the darker background rectangle for contrast.
- Adjust Gray Rectangles: Change the gray rectangles in the design to white or a lighter shade to enhance readability and contrast.
- Be Consistent: Ensure that the color contrast between the foreground and background is sufficient for text and icons to be clearly visible.
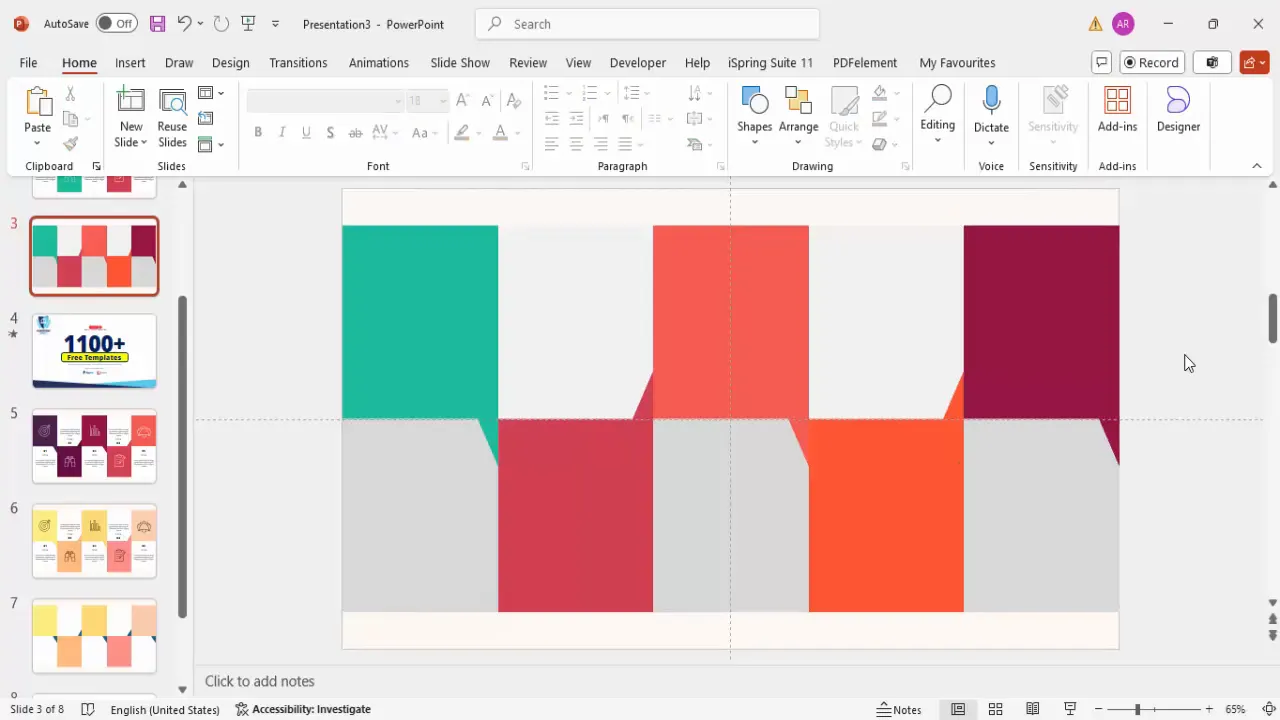
Colors not only beautify the slide but also help differentiate each option, making it easier for your audience to follow along.
Inserting and Styling Icons
Icons add a visual symbol to each infographic option, making the content more intuitive and engaging. Here’s how to add and style icons:
- Insert Icons: Go to Insert > Icons and select five icons that match the theme of your options. For example, use a house icon for real estate topics or binoculars for exploration.
- Resize Icons: After inserting, resize each icon to a height and width of 1.5 inches for consistency.
- Position Icons: Place each icon inside the darker background rectangle of each option.
- Change Icon Colors: For better contrast, change the color of the icons to white or a light shade that stands out against the background.
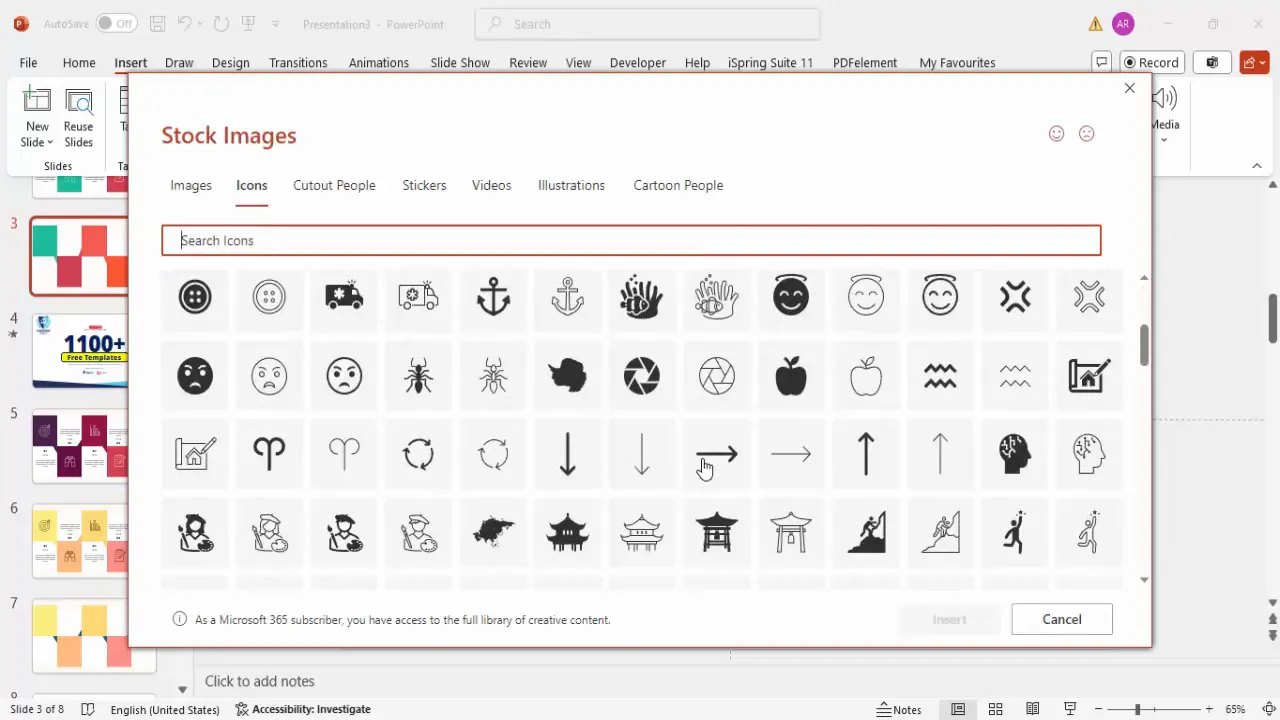
Icons serve as quick visual cues, helping viewers associate each option with its topic instantly.
Adding Text: Option Numbers, Titles, and Details
Text is essential to communicate the content of each infographic option clearly. Here’s how to add and format your text:
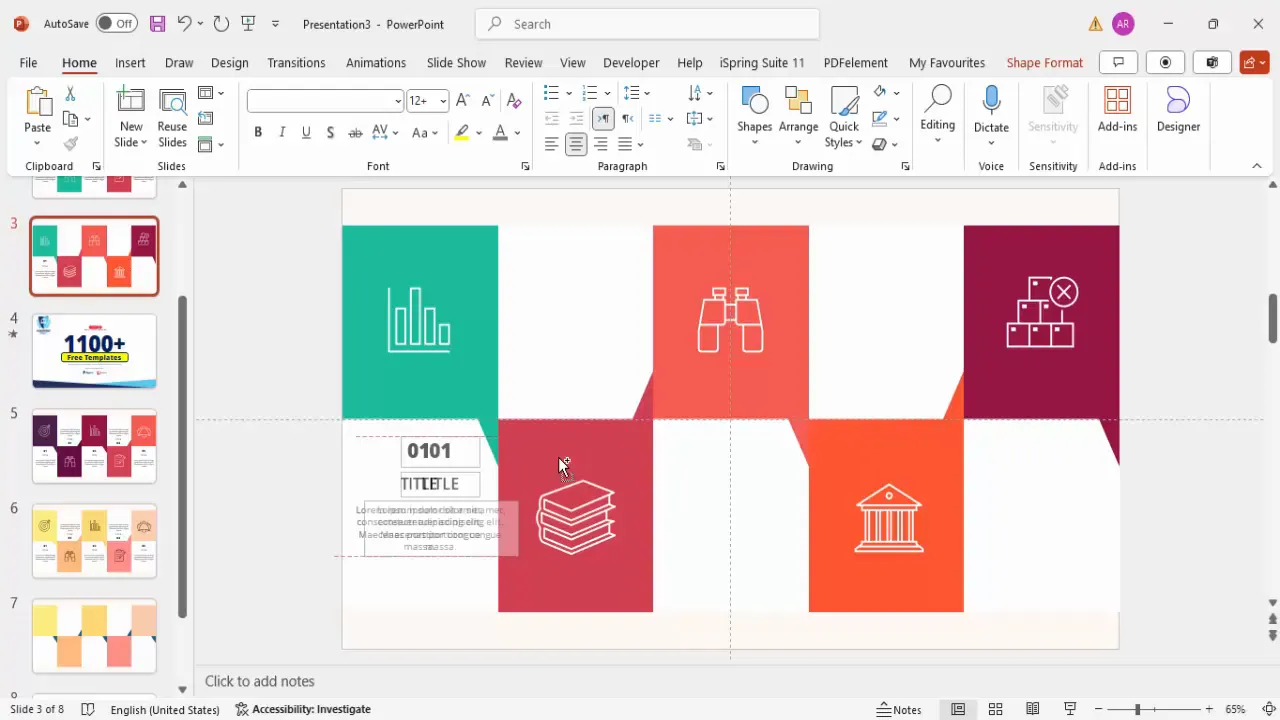
- Add the Option Number: Insert a text box and type the option number (e.g., “01”). Use the Open Sans Extra Bold font, center align the text, and adjust the font size to create a bold, prominent number.
- Add the Title: Below the number, add another text box for the option title. Use Open Sans Semi Bold with a font size around 18 pt for clear readability.
- Add Detail Text: Insert a smaller text box for detailed descriptions. Use Open Sans at 14 pt font size with a gray color to differentiate it from the title.
- Keep Text Concise: Limit the detail text to 12-15 words or a few short lines to avoid overcrowding the slide.
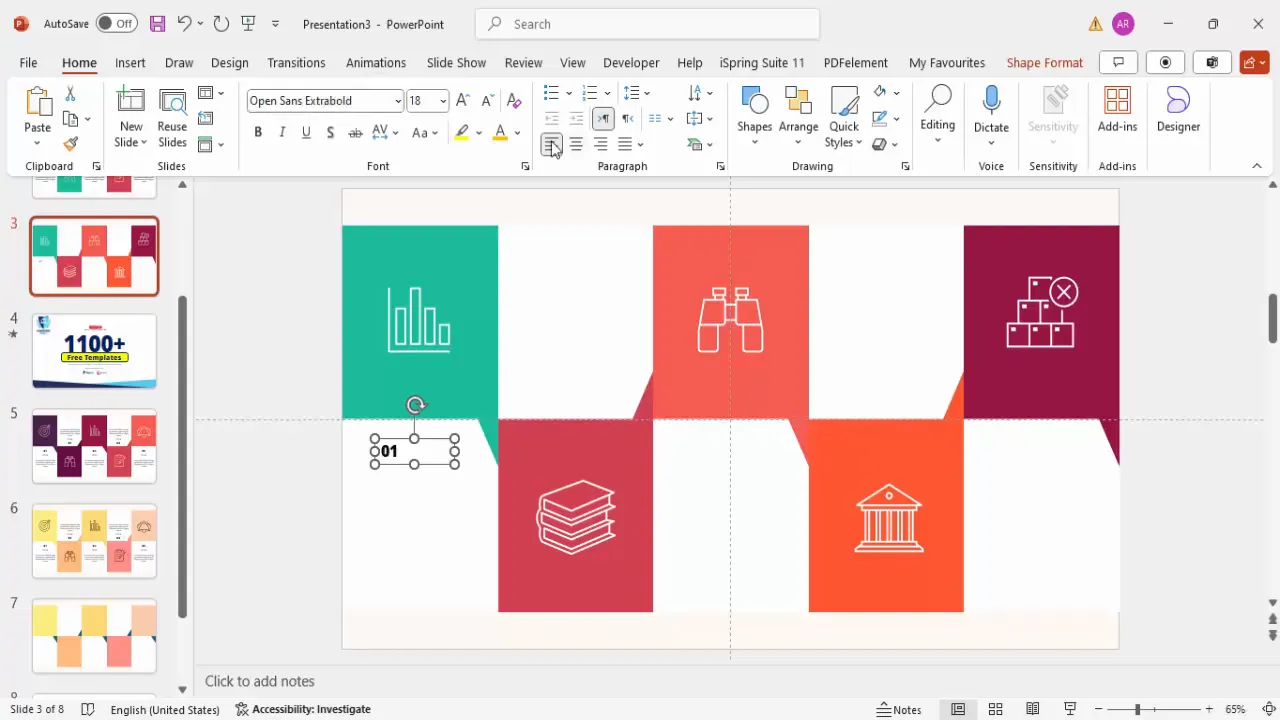
Well-organized text paired with bold numbers and clear titles ensures your audience can quickly scan and understand each option.
Duplicating and Arranging Options
After creating your first infographic option, you can efficiently replicate it for the remaining options:

- Group Elements: Group the rectangles, triangles, icons, and text boxes of the first option by selecting them and pressing Ctrl + G.
- Duplicate the Group: Press Ctrl + D to duplicate the grouped option.
- Position Duplicates: Drag the duplicated options horizontally across the slide to form a row of five options.
- Update Content: Change the option number, title, details, and colors for each duplicated group to make each option unique.
Duplicating grouped elements saves time and ensures consistency in layout and style across all options.
Grouping Shapes and Arranging Layers
Proper layering and grouping ensure your infographic elements don’t overlap incorrectly and maintain a polished appearance:
- Group Each Option Separately: Select all shapes and text elements for each option and group them.
- Send Background Shapes to Back: For each option, send the background rectangles to the back layer to prevent them from covering text or icons.
- Maintain Layer Order: Keep icons and text boxes in front of the colored rectangles to maintain clear visibility.

Layer management is key to ensuring the slide looks clean and professional.
Adding Animations for Dynamic Presentation
Animations help bring your infographic slide to life and guide your audience’s attention. Here’s how to add smooth animations:
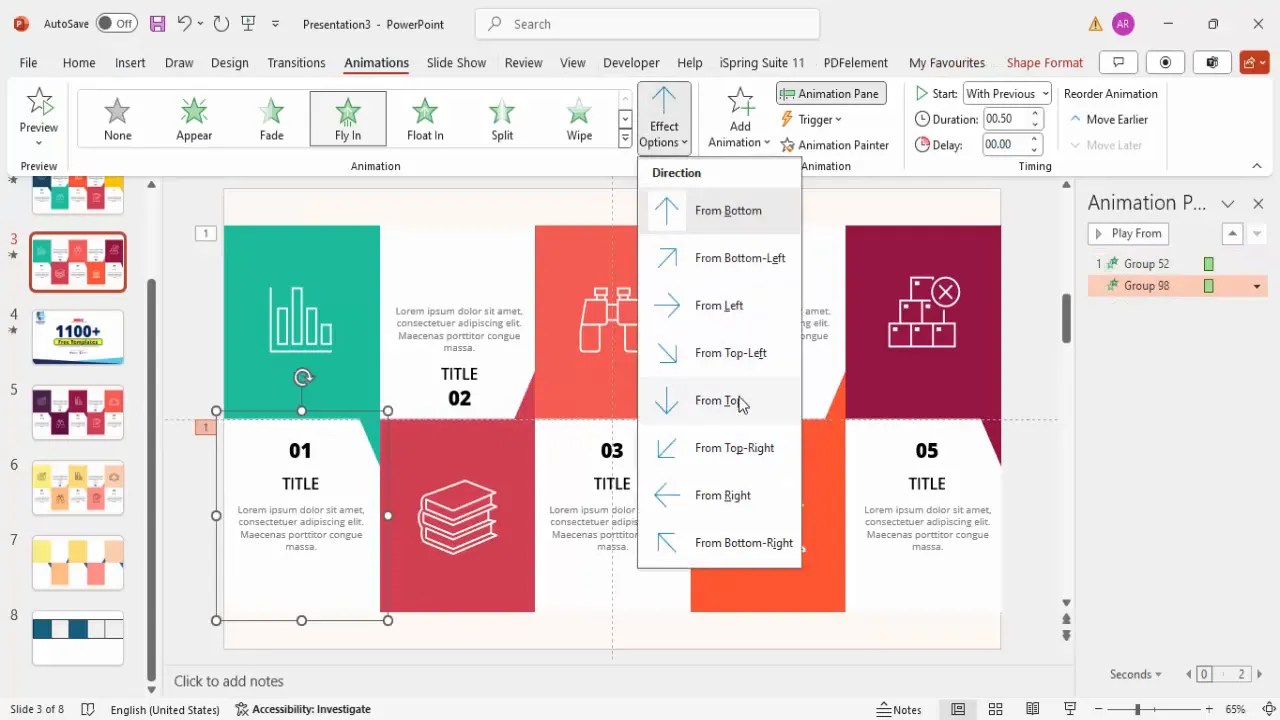
- Open Animation Pane: Go to the Animations tab and enable the Animation Pane for better control over effects.
- Select Shapes for Animation: For each option, select the background rectangles and icons.
- Apply Fly-In Animations: Choose the Fly In animation effect. Set the first rectangle to fly in from the bottom and the second from the top to create a dynamic entry.
- Set Animation Timing: Configure the animations to start With Previous for smooth transitions.
- Copy Animations: Use the animation painter to copy animation settings from one option to the others, alternating fly-in directions for variety.
- Preview the Slide: Run the slideshow to ensure each option appears sequentially and smoothly.
Animations make your infographic slide interactive and help emphasize each option as you discuss it.
Frequently Asked Questions (FAQ)
Can I customize the colors of the infographic options?
Absolutely. You can change the colors of the rectangles, backgrounds, and icons to match your brand or presentation theme. Use the Shape Format tab to select colors that provide good contrast and visual appeal.
How do I ensure the icons and text are properly aligned?
Enable guides under the View tab and use the alignment tools in the Shape Format tab. Grouping elements also helps maintain consistent alignment when duplicating options.
Can I add more than five options?
Yes. While this tutorial focuses on five options, you can duplicate and arrange more options horizontally or vertically, adjusting sizes and spacing accordingly.
Are these infographic slides suitable for all types of presentations?
Yes, these colorful infographic slides work well for business presentations, educational content, marketing pitches, and more. Their versatility allows you to convey multiple points clearly and attractively.
Can I download pre-made templates for these infographic slides?
Many online resources offer free and premium PowerPoint templates. Using templates can save time and provide inspiration for your designs. Additionally, creating your own infographic slides allows for full customization to suit your needs.
Conclusion
Creating engaging PowerPoint slides with colorful rectangular-shaped infographic options is a powerful way to replace traditional bullet points and elevate your presentations. By following this detailed guide, you can design a professional, visually appealing slide that effectively communicates multiple points with clarity and style.
From setting up the slide background and creating shapes to adding icons, text, and animations, each step contributes to a polished final product that captures your audience’s attention. Remember to customize colors and content to align with your message and brand identity.
With practice, this infographic slide design technique will become a valuable addition to your PowerPoint skills, helping you deliver presentations that are not only informative but also memorable.
Ready to transform your presentations? Start designing your colorful infographic PowerPoint slides today and make your next presentation stand out!
Check out the full video: 5 Colorful rectangular-shaped Infographic slide design in PowerPoint


