

If you want to take your PowerPoint presentations to the next level, learning how to create a cool slide animation can make your content more engaging and visually striking. In this comprehensive guide, we’ll walk you through designing a stunning animated infographic perfect for comparing products, services, or any two items you want to highlight side-by-side. This tutorial breaks down the process step-by-step, making it approachable even if you’re new to PowerPoint animations.
By following this guide, you’ll not only learn to design a modern and clean infographic slide but also how to animate its elements seamlessly for maximum impact. Plus, we’ll share tips on using PowerPoint tools and shortcuts to speed up your workflow. Ready to impress your audience with dynamic visuals? Let’s dive in!
Table of Contents
- Getting Started: Setting Up Your Slide
- Designing the Infographic: Shapes, Labels, and Layout
- Adding Cool Slide Animation: Motion Paths and Wipe Effects
- Tips for Consistency and Efficiency
- Frequently Asked Questions
- Conclusion
Getting Started: Setting Up Your Slide
Before jumping into the fun part of creating animated graphics, it’s important to start with a clean and well-structured slide. Here’s how to set up your slide to ensure consistency and ease of design.
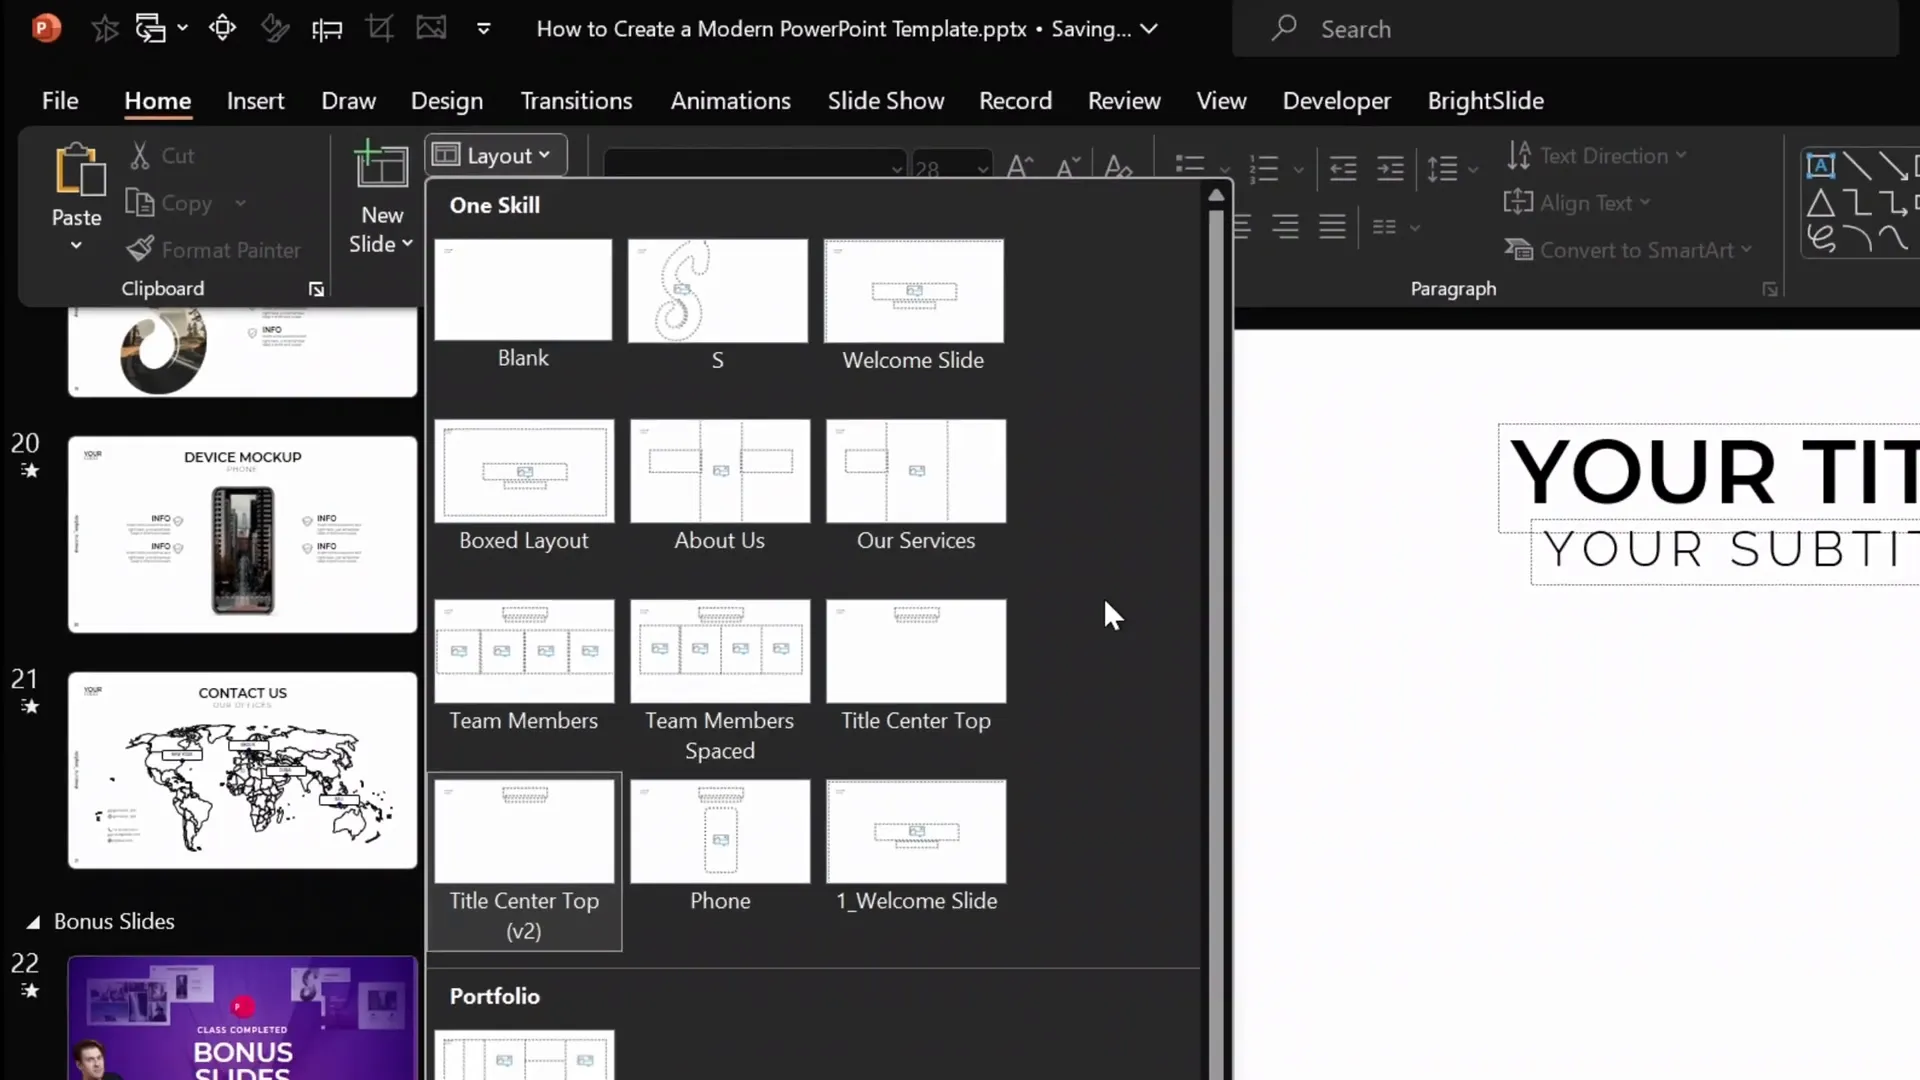
1. Insert a New Slide with a Custom Layout
To begin, insert a new slide at the bottom of your slide deck. This slide will use a custom layout that includes placeholders for the title, subtitle, your logo, and a custom slide number. This layout is created using PowerPoint’s Slide Master feature, which helps maintain a consistent look across your presentation.
If you’re interested in mastering slide layouts and templates, consider checking out a free PowerPoint masterclass on Skillshare that teaches you how to create professional slide masters and templates.
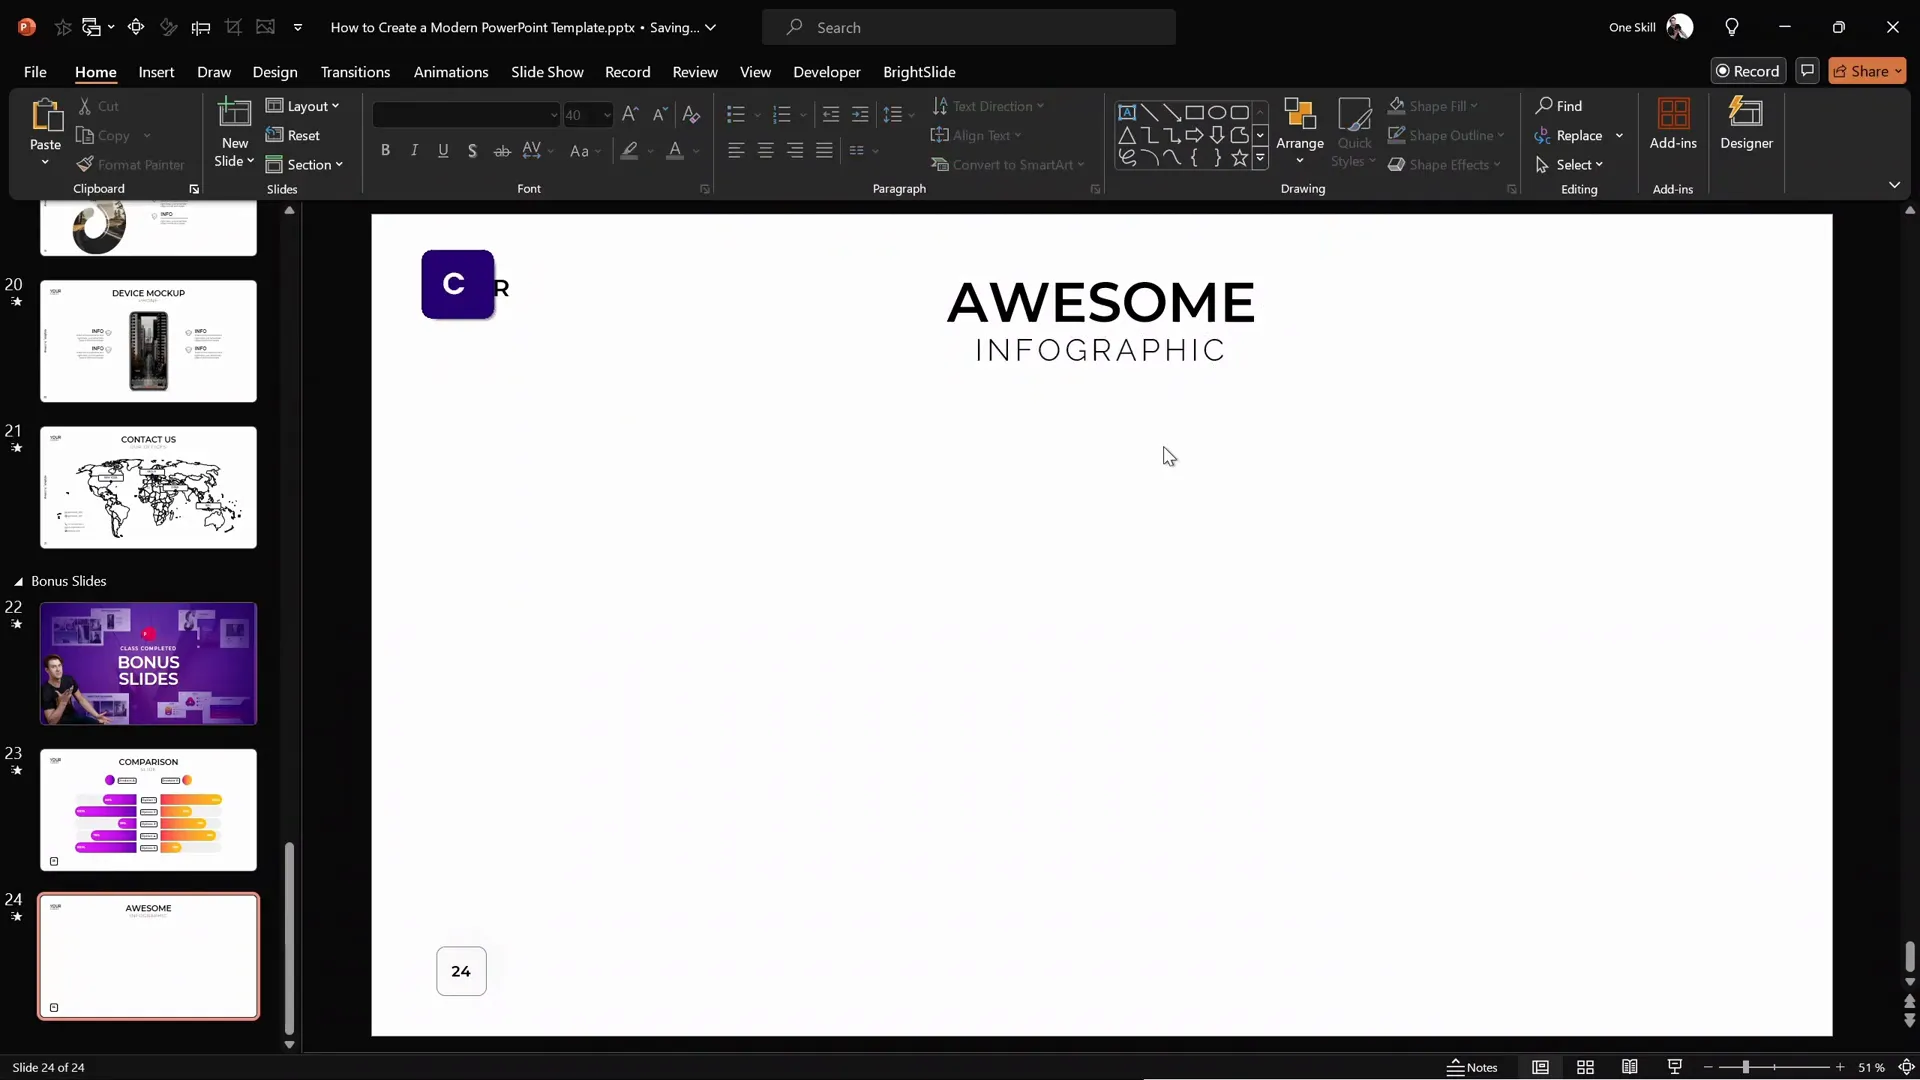
2. Add Your Title and Subtitle
Once your slide is inserted, fill in the title and subtitle placeholders with your desired text. This will help you stay focused on the slide’s purpose as you design the infographic.
3. Turn on Gridlines and Guides for Precise Alignment
For a clean and balanced design, turn on PowerPoint’s gridlines and guides. In this tutorial, the slide uses a grid of 18 columns and 8 rows, which helps in aligning and sizing the infographic elements precisely.
- Go to View tab
- Check Guides and Gridlines
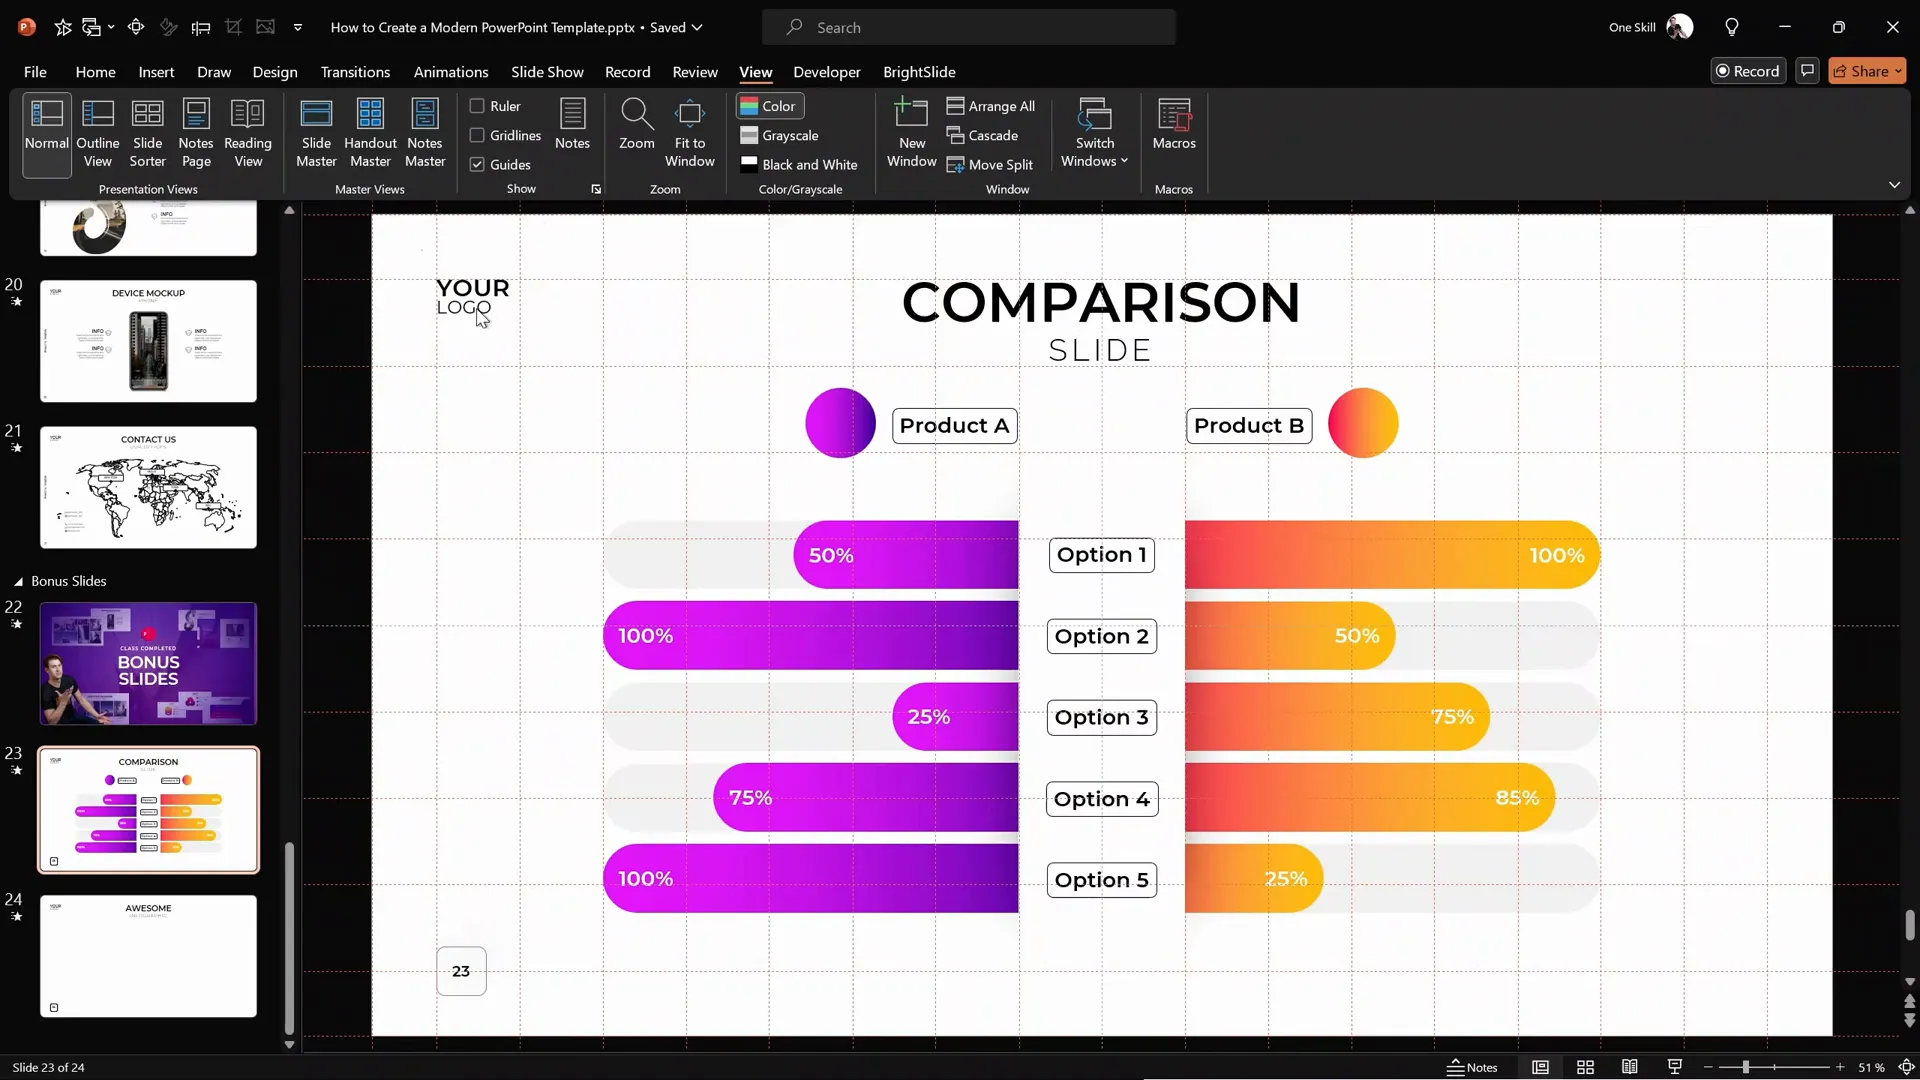
This grid allows you to easily measure and position shapes. For example, the main white shape in the middle of the slide has a width of 2 columns and height of 6 rows.
Designing the Infographic: Shapes, Labels, and Layout
Now that your slide is set up, it’s time to build the core components of your infographic. This involves creating shapes, labels, and background elements that will form the visual structure.
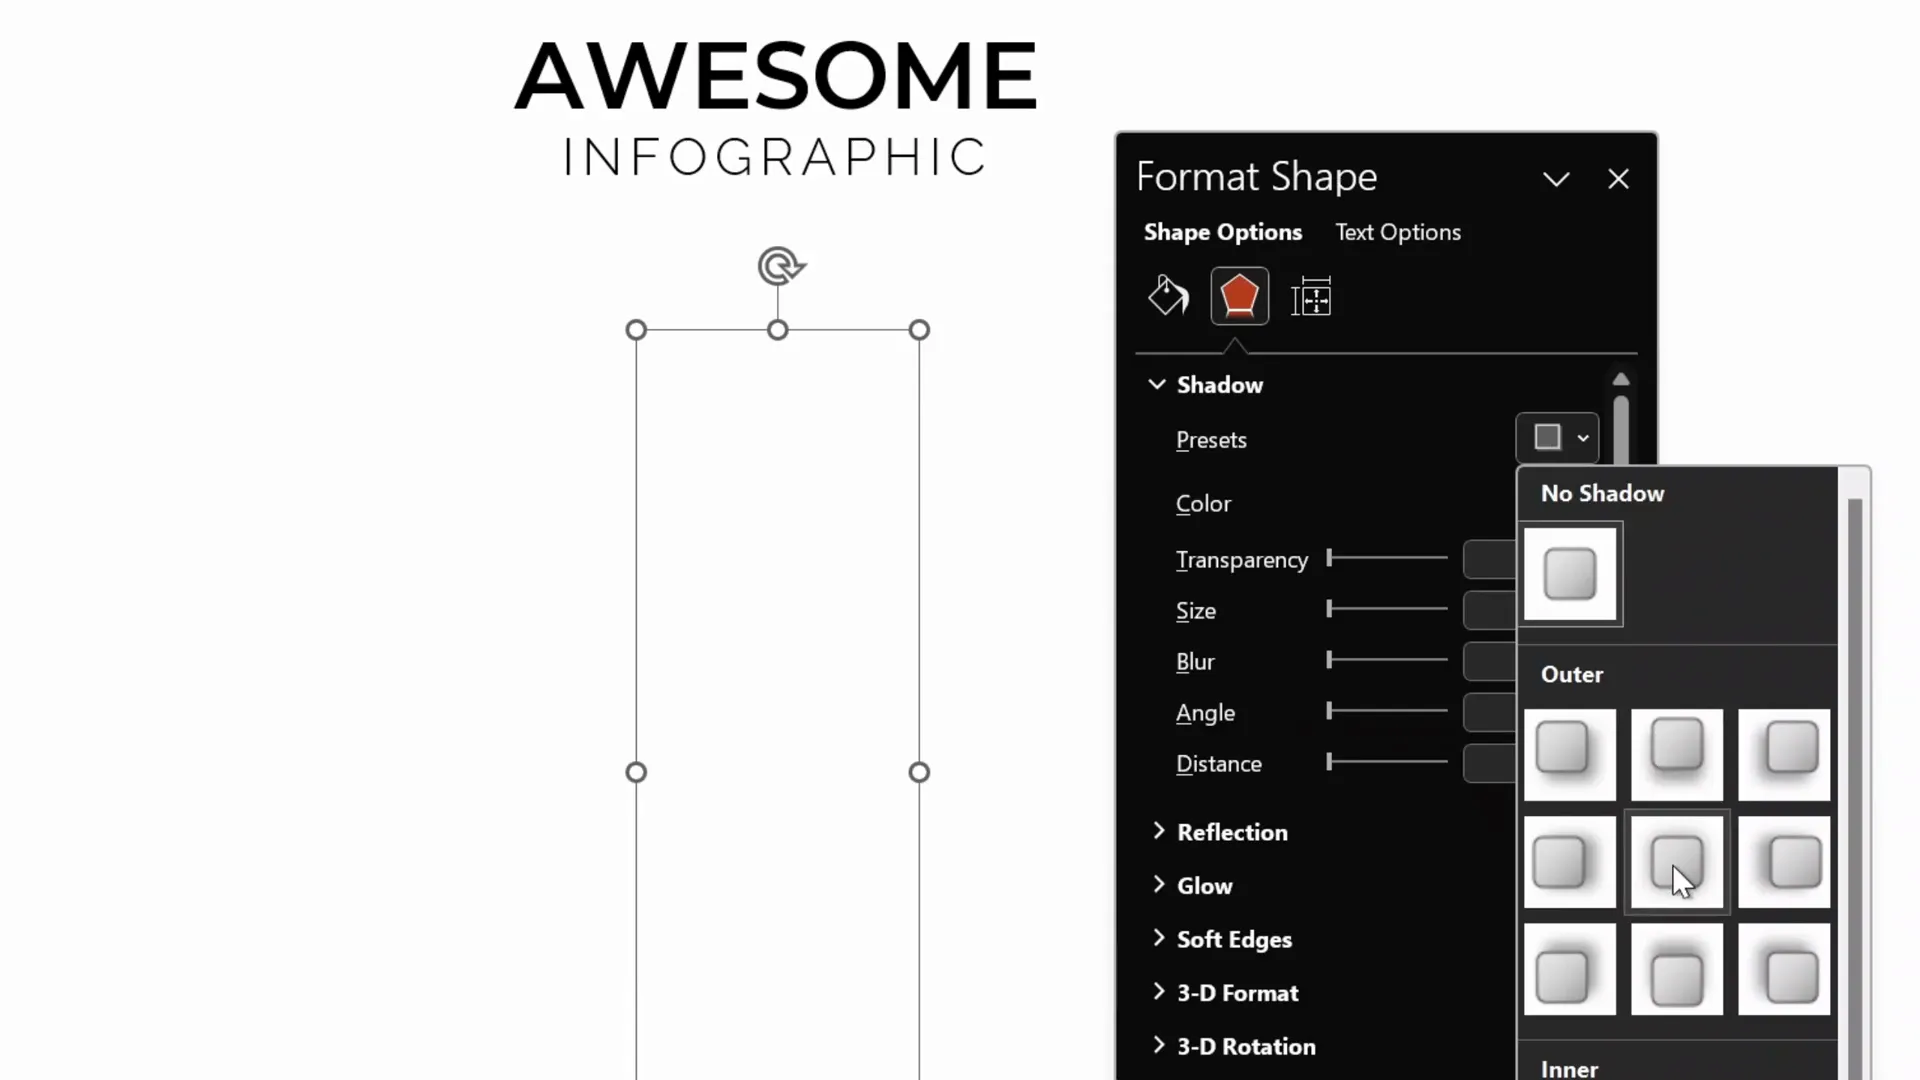
1. Create the Central White Shape with Shadow
The centerpiece of the infographic is a white rectangle with a subtle shadow effect. Here’s how to create it:
- Insert a rectangle shape in the center of the slide with the dimensions: 2 columns wide and 6 rows tall (based on the grid).
- Right-click the rectangle, select Format Shape.
- Under Fill, choose White.
- Set the Line to No Line.
- Under Shadow options, select the center preset.
- Adjust shadow settings as follows:
- Transparency: 20%
- Blur: 100 points
- Size: 70 points
This creates a soft shadow effect that anchors the central shape visually without overpowering the design.
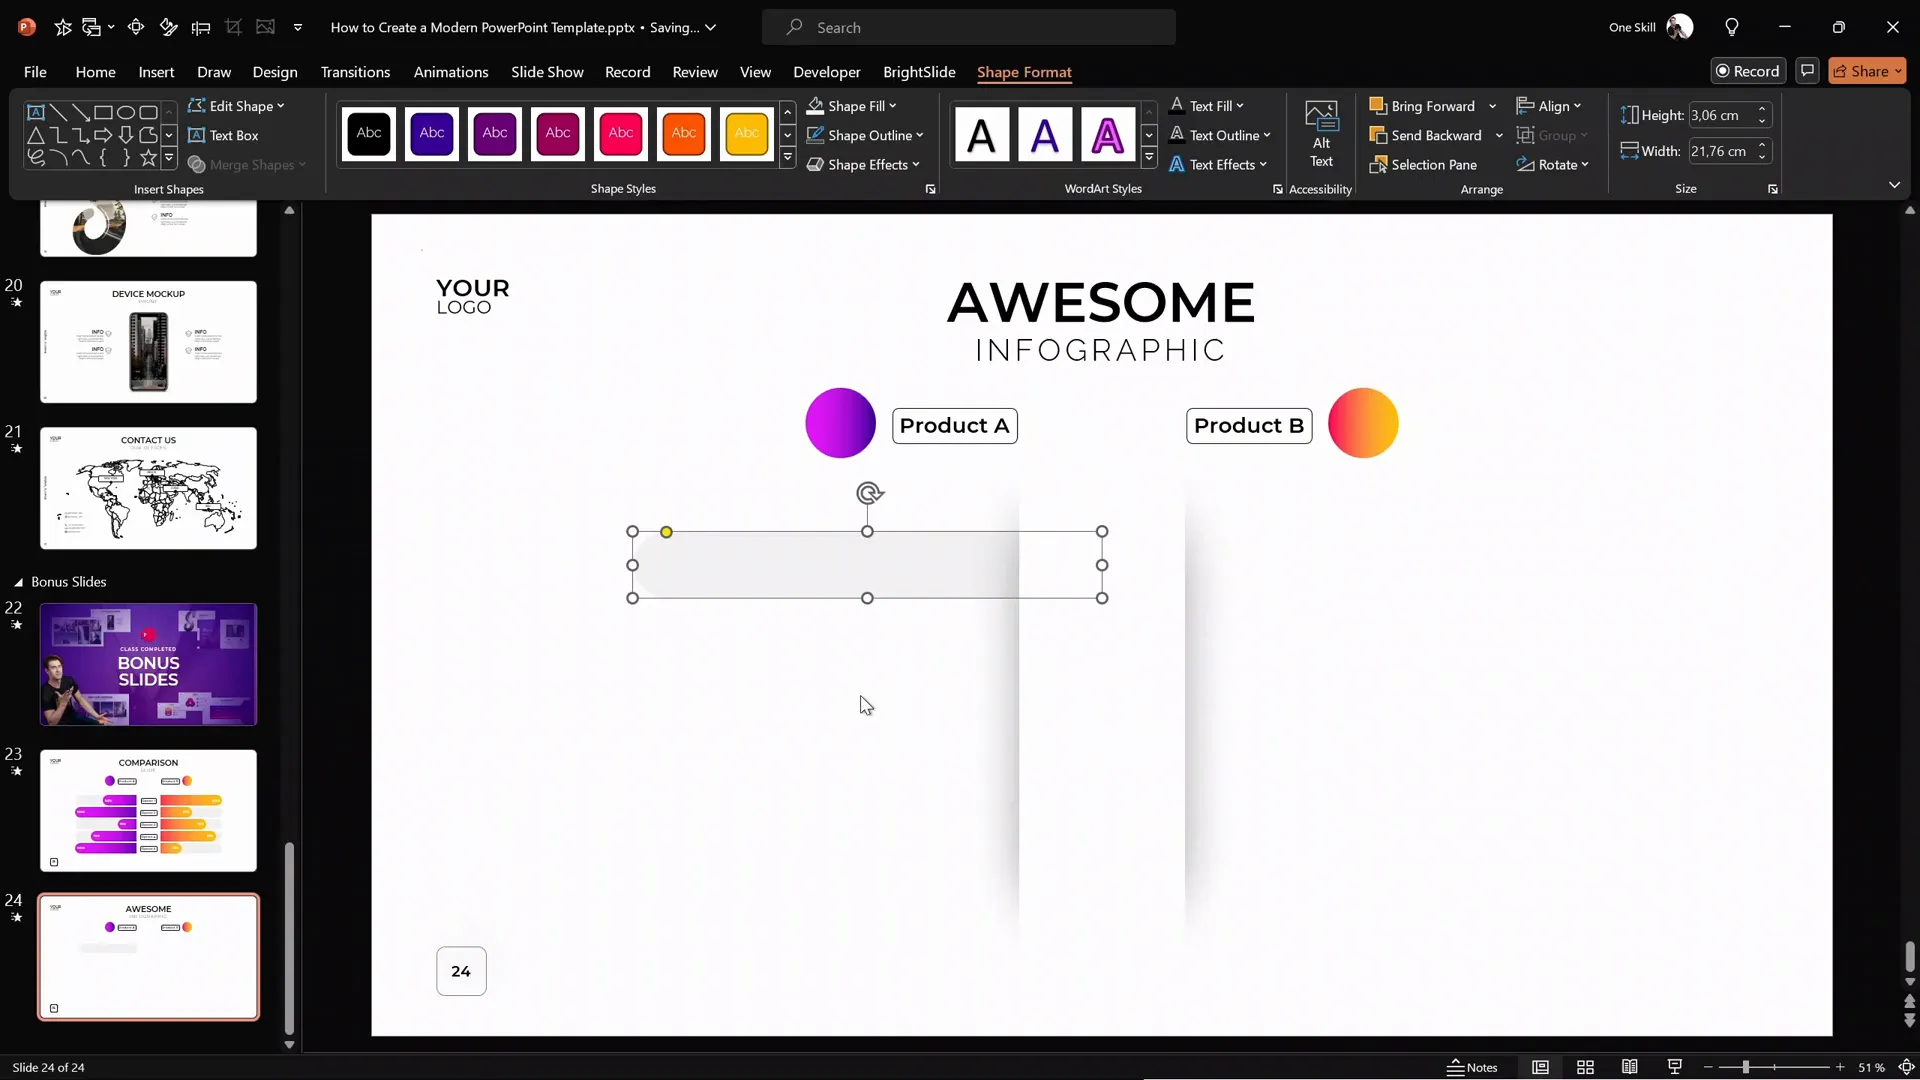
2. Design Product Labels and Colorful Bubbles
To highlight data points or product features, use circular bubbles with gradient fills and small rounded rectangles as labels.
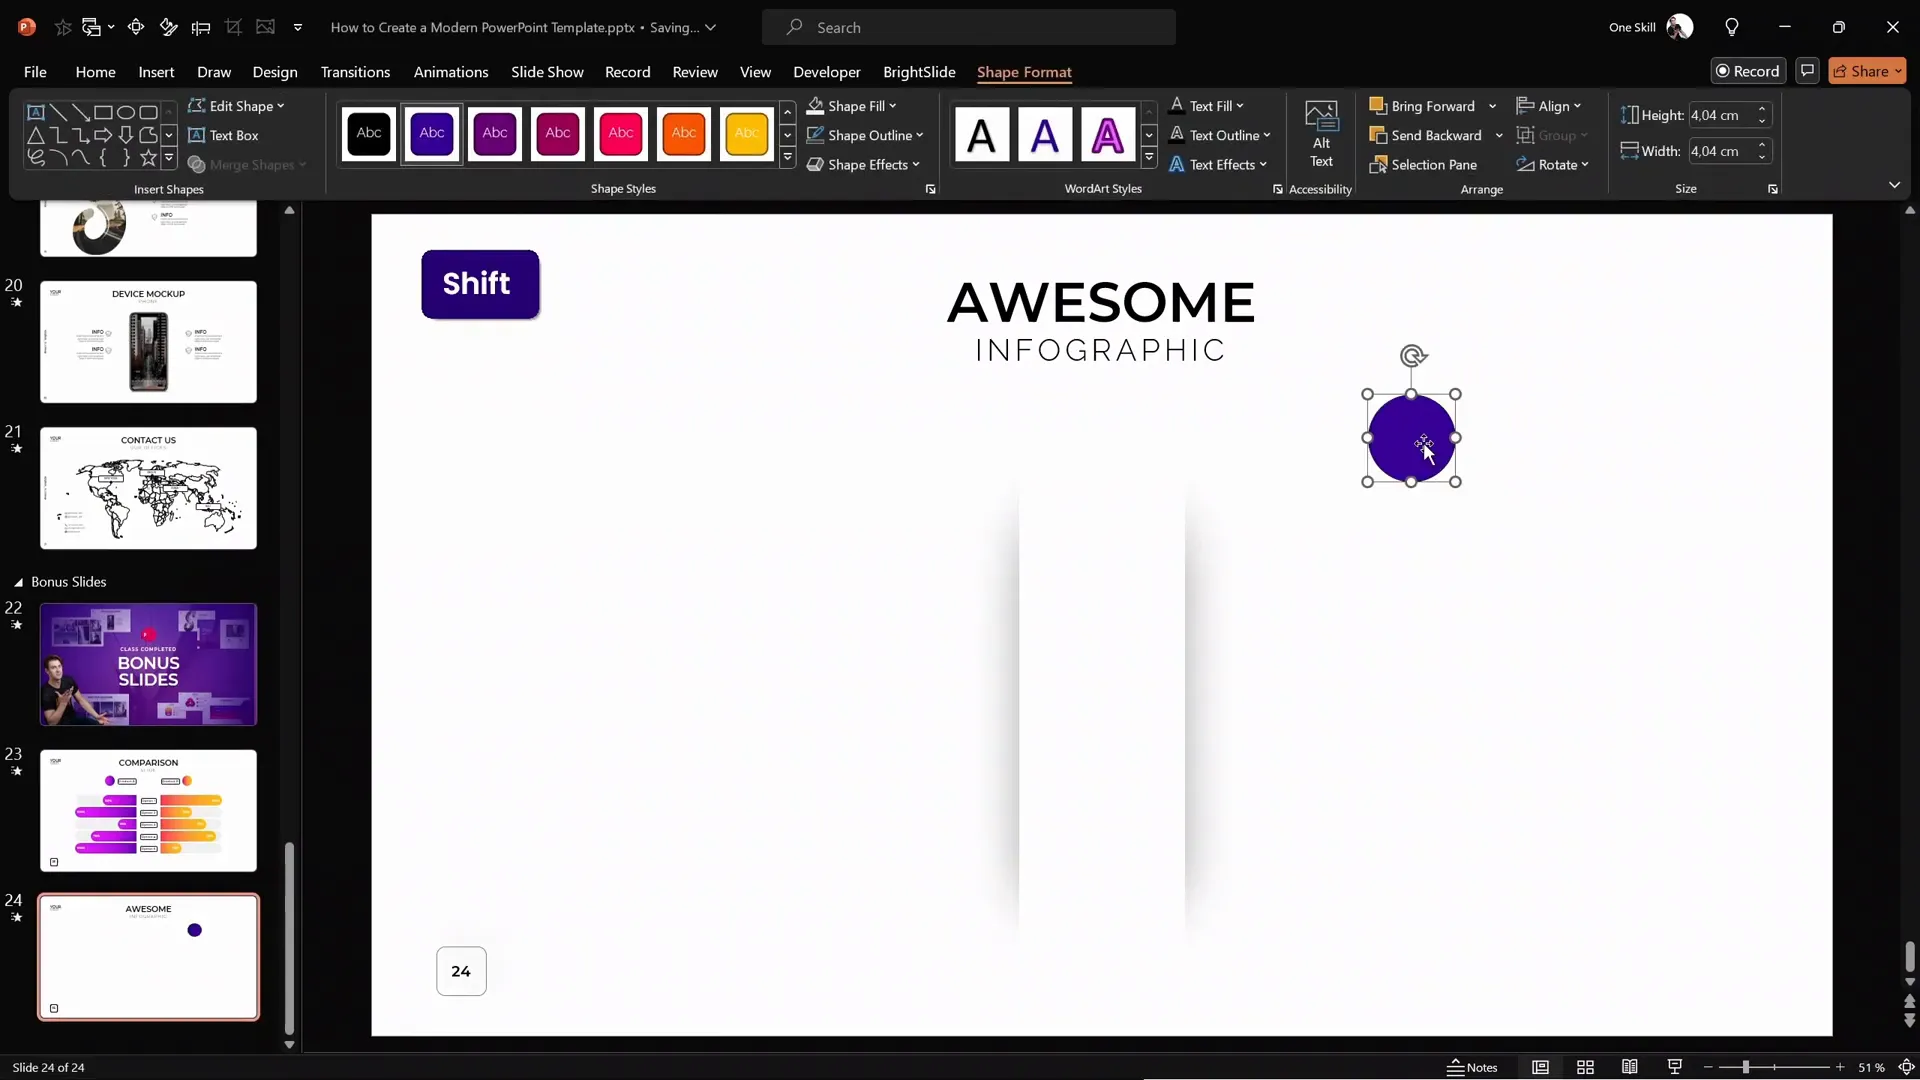
- Insert a perfect circle by holding Shift while dragging the circle shape.
- Apply a gradient fill to the circle for visual interest. You can use PowerPoint’s Format Painter tool to copy the gradient from a previously styled shape.
- Insert a small rounded rectangle next to the bubble for labeling.
- Double-click inside the rectangle to type your label text.
- Use Format Painter or Ctrl+Shift+C and Ctrl+Shift+V to copy and paste formatting styles for consistency.
Group the bubble and label together by selecting both and pressing Ctrl+G. This makes moving and animating easier later on.
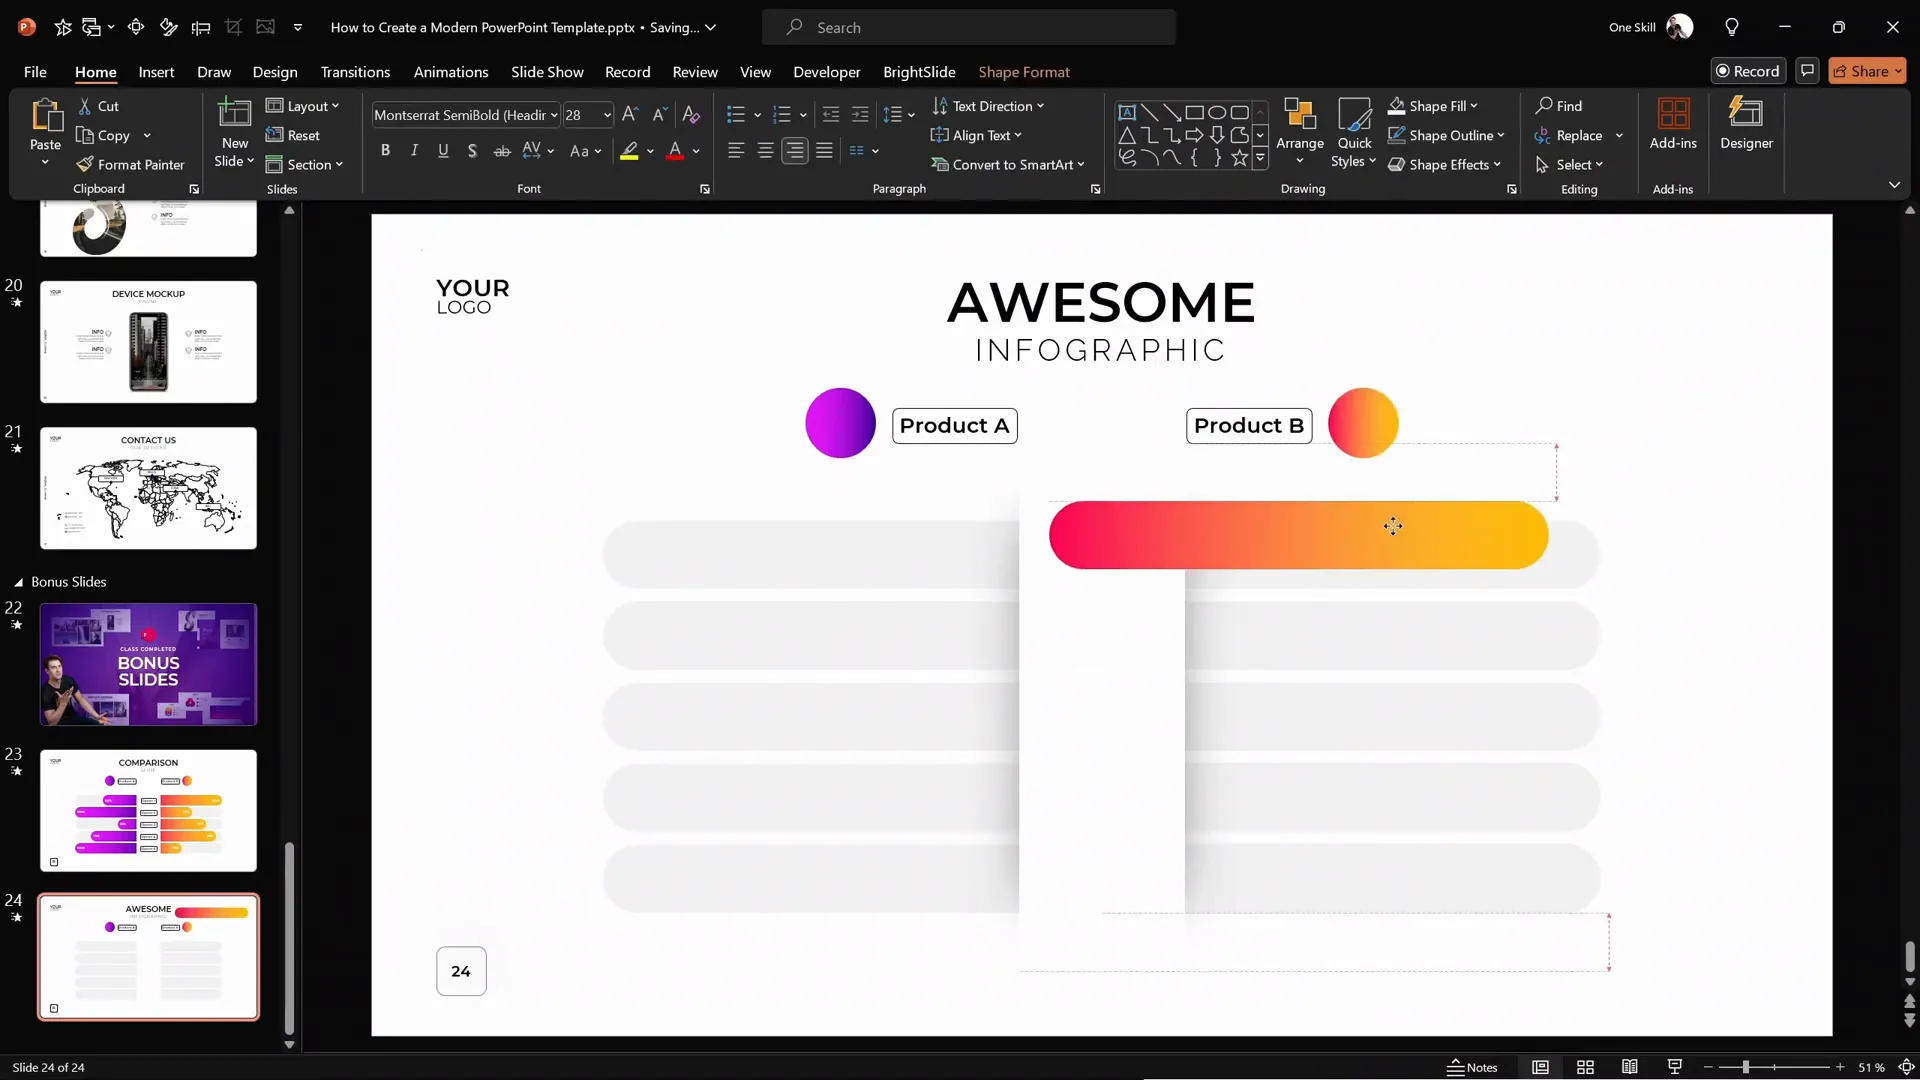
3. Add Subtle Rounded Rectangles in the Background
The infographic’s background features light gray rounded rectangles that add depth and structure without distracting from the main content.
- Insert a rounded rectangle and adjust the yellow handle to make the corners fully rounded.
- Resize the rectangle to be wider and flatter.
- Set the fill color to a light gray shade and remove the outline.
- Send the shape to the back so it sits behind the central white shape.
- Use Ctrl+Shift while dragging to create multiple copies aligned in a straight line.
- Duplicate the group of shapes to the opposite side of the slide for symmetry.
For a consistent design, you can also copy these background shapes from a previous slide where you’ve already styled them.
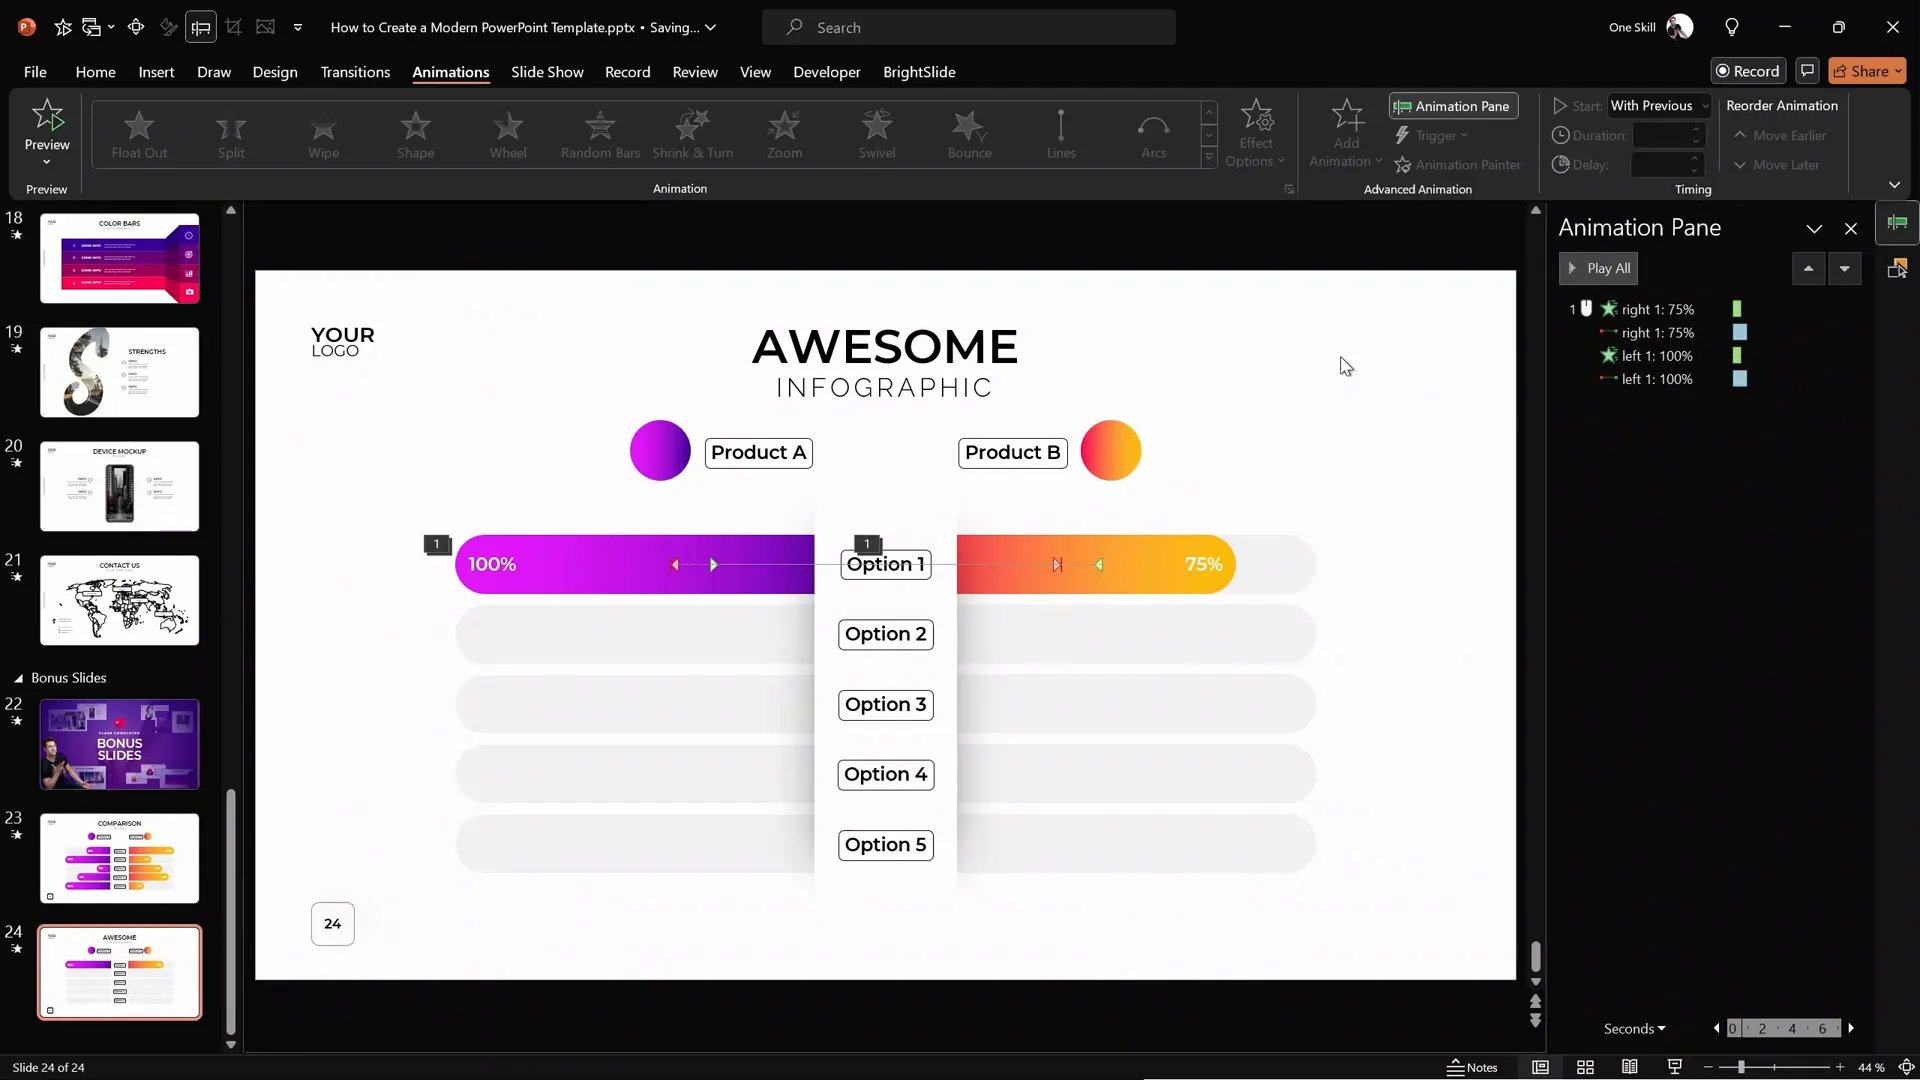
Adding Cool Slide Animation: Motion Paths and Wipe Effects
Now for the most exciting part — bringing your infographic to life with animation! The key to a cool slide animation is combining motion paths with wipe effects to create smooth sliding bars that reveal your data dynamically.
1. Create the Sliding Bars
Start by duplicating one of the rounded rectangles and filling it with a vibrant gradient color, such as orange or purple, to represent different data categories.
Align the colored bar precisely over the corresponding gray background bar:
- Align right edge with the gray bar.
- Align top edges.
- Adjust the length to represent a percentage value (e.g., 75%).
- Double-click inside the bar to add text like “75%.”
2. Add Motion Path Animation
To make the colored bar slide out smoothly:
- Select the colored rounded rectangle.
- Open the Animations pane and click Add Animation.
- Choose Motion Path → Line.
- Adjust the path direction to slide left for the right side bar (or right for the left side bar).
- Set the animation duration to 1 second.
- Enable Reverse Path Direction if the motion goes opposite of what you want.
- Double-click the animation to open options and select Smooth Start/End for a natural movement.
3. Add Wipe Animation as a Mask
To hide the unwanted edge of the sliding bar during animation and create a clean reveal, add a wipe animation:
- With the same colored bar selected, add a Wipe entrance animation.
- Set the direction to From Right for the right bar and From Left for the left bar.
- Adjust the wipe animation duration to about 0.6 seconds.
- In the animation pane, order the wipe animation to start With Previous so it synchronizes with the motion path.
The combination of the motion path and wipe animations creates a moving mask effect, making the bar appear to grow out from behind the white shape.

4. Duplicate and Adjust for the Opposite Side
Duplicate the orange sliding bar to create a purple bar on the opposite side:
- Align it with the left side gray rounded rectangle.
- Apply the same gradient fill, adjusting the text alignment to left.
- Adjust the motion path to slide right.
- Set the wipe animation direction to From Left.
- Adjust the length and text to reflect your data (e.g., 100%).
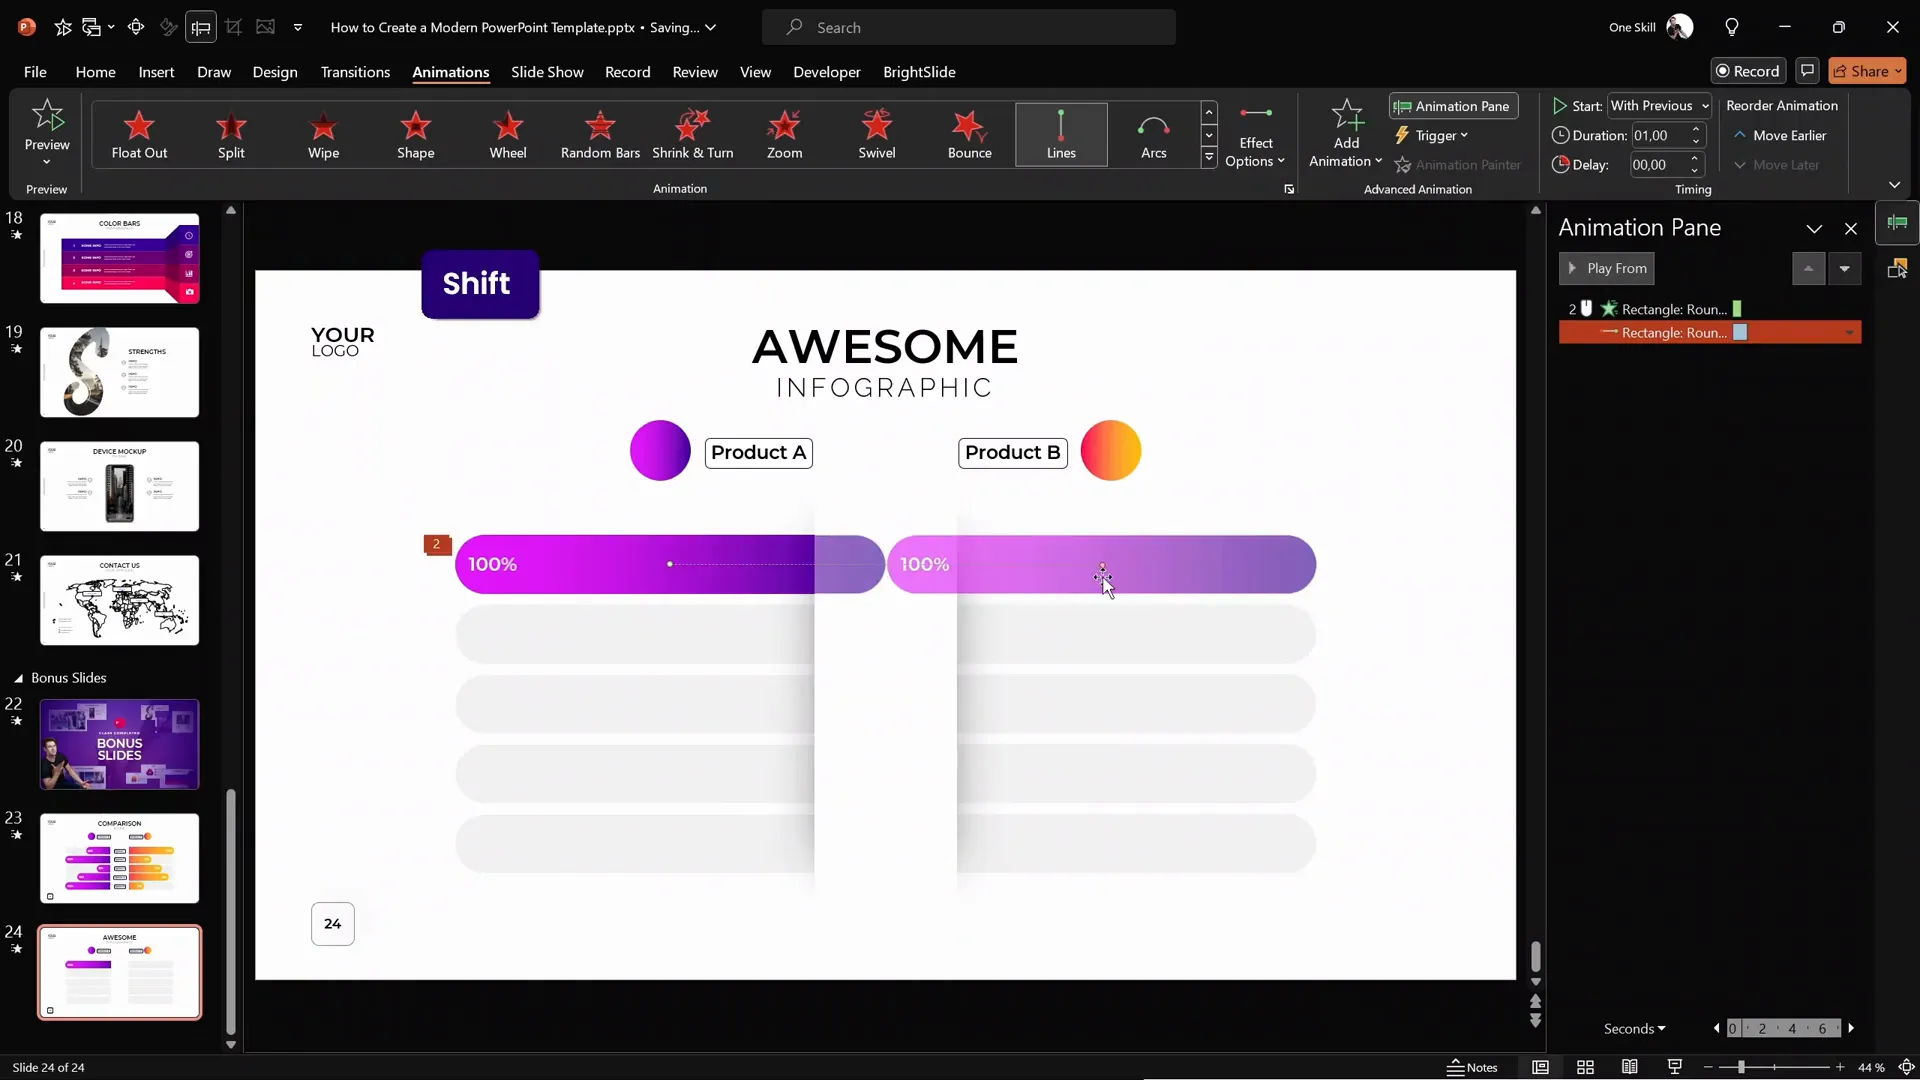
5. Synchronize Animations
By default, the left and right sliding bars animate on separate clicks. To create a unified effect where both bars slide simultaneously:
- In the animation pane, set the wipe animation of the left bar to start With Previous along with the right bar’s motion path animation.
- Test the animation in full-screen presentation mode to ensure both bars animate together on a single click.
Tips for Consistency and Efficiency
Here are some helpful tips to streamline your workflow and maintain a polished, professional look:
| Tip | Description |
|---|---|
| Use Slide Master Layouts | Create custom slide layouts in Slide Master view to ensure consistency in titles, logos, and slide numbers. |
| Utilize Gridlines and Guides | Turn on grids and guides to align and size shapes precisely, creating a balanced design. |
| Format Painter | Use the Format Painter tool (Ctrl+Shift+C and Ctrl+Shift+V) to quickly copy styles between shapes. |
| Group Elements | Group related shapes (like labels and bubbles) to move and animate them easily. |
| Name Elements | Rename shapes in the Selection Pane for easier animation management (e.g., “right bar,” “left bar”). |
| BrightSlide Add-in | Consider using the free BrightSlide PowerPoint add-in for productivity shortcuts like precise shape alignment and selection. |
Frequently Asked Questions
What is a cool slide animation in PowerPoint?
A cool slide animation combines different animation effects, such as motion paths and wipes, to create smooth, dynamic visual movements that enhance the storytelling and engagement of your presentation.
Can I create this animated infographic without advanced PowerPoint skills?
Yes! This tutorial breaks down the process into simple steps using built-in PowerPoint tools. With practice, even beginners can create professional-looking animated infographics.
How do I ensure my animations run smoothly during a presentation?
Test your animations in Slide Show mode before presenting. Use the Animation Pane to adjust timings and sequences. Group related animations and synchronize them with the “With Previous” or “After Previous” options.
Is the BrightSlide add-in necessary for this tutorial?
No, but it can speed up your workflow. BrightSlide offers useful productivity shortcuts for aligning, selecting, and moving objects. You can achieve the same results with built-in PowerPoint features but might need extra clicks.
Can I customize this infographic for more than two products or services?
Absolutely! You can add as many sliding bars and labels as needed by duplicating and customizing the shapes and animations. Just ensure your slide doesn’t become too cluttered.
Conclusion
Creating a cool slide animation infographic in PowerPoint is a powerful way to visually compare two products, services, or any other data points you want to showcase. With a few well-designed shapes, gradient fills, and a smart combination of motion path and wipe animations, you can craft an engaging slide that captures your audience’s attention and communicates your message clearly.
Remember to start with a well-structured slide layout, use grids and guides for precise placement, and leverage PowerPoint’s tools like the Format Painter and Selection Pane to keep your design consistent and your workflow efficient. Animations add a dynamic layer to your presentation, but they should always support your content, not distract from it.
With these techniques, you’ll be able to create impressive animated infographics that stand out in any presentation. Try experimenting with different colors, labels, and animation timings to tailor the slide to your unique needs.
Thank you for reading! Stay creative, and happy animating!


