
Creating visually appealing and engaging slides is essential for delivering impactful presentations. If you want to elevate your PowerPoint Slide Design skills, mastering infographic slides with a creative 3D touch is a great place to start. In this comprehensive tutorial, I’ll guide you through designing a vibrant, seven-step infographic slide in PowerPoint that not only looks professional but also captivates your audience with dynamic animations and color coordination.
This step-by-step guide will help you build a colorful, 3D infographic slide complete with icons, titles, and detailed text. Whether you’re presenting a process, workflow, or sequential data, this design approach will add clarity and visual appeal to your content.
Table of Contents
- Getting Started: Setting Up Your Slide
- Creating 3D Shapes for Each Step
- Choosing and Applying Color Combinations
- Adding Icons to Enhance Visual Communication
- Inserting Titles and Detail Text
- Design Enhancements with Shapes and Patterns
- Applying Animations for Dynamic Presentation
- Frequently Asked Questions
- Conclusion
Getting Started: Setting Up Your Slide
Before diving into the creative aspects, the first step is to set up a clean and organized slide in PowerPoint. Here’s how to begin:
- Add a New Slide: Open your PowerPoint presentation and insert a new blank slide to work on your infographic.
- Insert a Rectangle Shape: Go to the Insert tab, click on Shapes, and select the first rectangle shape.
- Draw the Rectangle: Click on the slide to place the rectangle.
- Adjust Size: Select the rectangle, go to the Shape Format tab, and set the height and width to exactly 1.65 inches (or 1.65 units depending on your measurement settings).
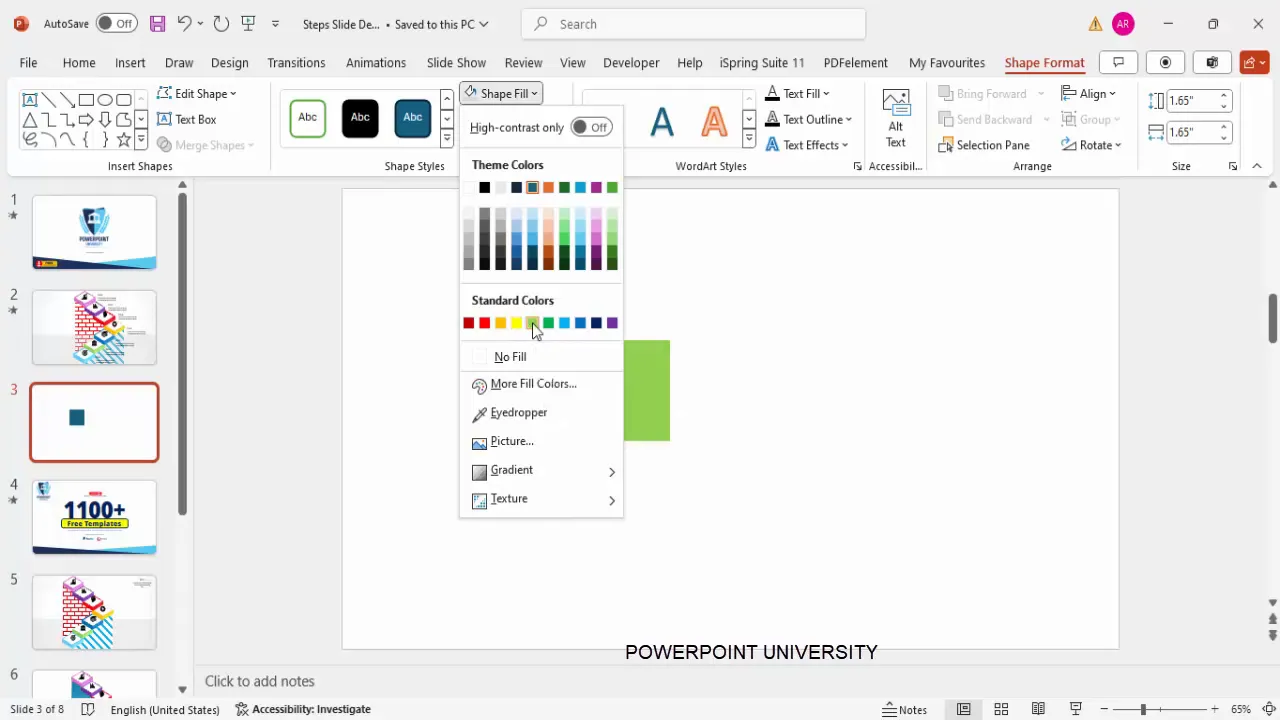
- Remove Outline: Click on Shape Outline and select No Outline to keep the shape clean.
- Fill with Color: Choose a color of your choice—for this tutorial, a vibrant green works well for the first step.
Creating 3D Shapes for Each Step
To make your infographic visually engaging, transforming flat shapes into 3D blocks adds depth and professionalism. Follow these detailed steps to give your rectangle a 3D look:
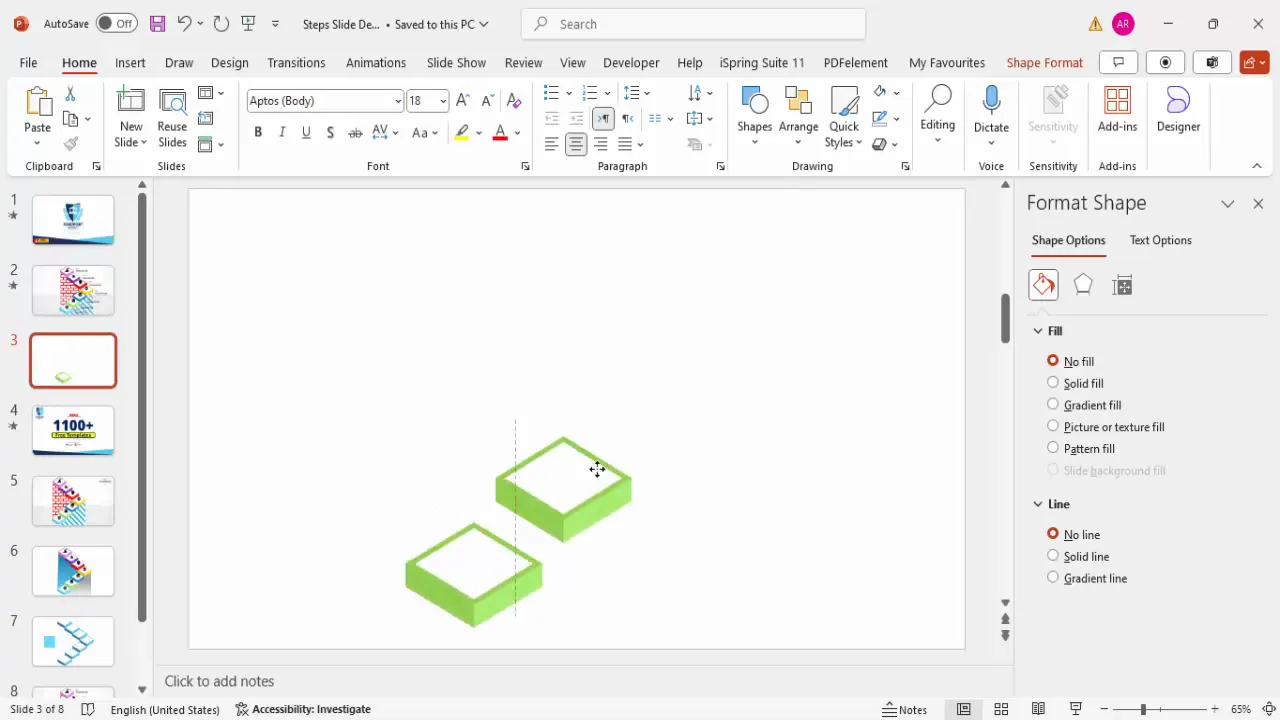
- Right-Click and Format Shape: Right-click the rectangle and select Format Shape.
- Apply 3D Rotation: In the Format Shape pane, navigate to Effects > 3D Rotation.
- Select Preset Rotation: Under the Parallel section, choose the third preset, Isometric Top Up. This provides an isometric 3D perspective from the top.
- Adjust Depth: Switch to the 3D Format tab and increase the Depth to around 32 or 33 to give the block substantial thickness.
- Set Lighting: Choose a suitable lighting option to enhance the 3D effect. Experiment with different lighting presets to find one that complements your color choice. For example, a soft light gray works well with green.
Once you have the first 3D block, duplicate it to create the remaining six steps:
- Select the grouped 3D shape and press Ctrl + D to duplicate.
- Change the fill color for each duplicate to create a vibrant spectrum across all seven steps (e.g., orange, red, blue, purple).
- Ensure each shape is perfectly aligned vertically or horizontally depending on your layout.
Choosing and Applying Color Combinations
Color plays a vital role in making each step distinct and visually appealing. Here’s how to apply and coordinate colors effectively:
- Start with a Base Color: Begin with a green block for step one.
- Use Contrasting Colors: For subsequent steps, choose contrasting yet harmonious colors such as orange, red, blue, purple, and light gray. This variety helps differentiate each step clearly.
- Maintain Consistency: Stick to bright, saturated tones to keep the infographic lively and consistent in style.
- Adjust Color Depth: Use the Format Shape pane to tweak the depth and lighting, enhancing the 3D effect while preserving color vibrancy.
Remember, your color choices should complement your presentation’s theme and be accessible for viewers with color vision deficiencies. Tools like Adobe Color or Coolors can assist in creating accessible palettes.
Adding Icons to Enhance Visual Communication
Icons help communicate your message quickly and visually. Adding relevant icons to each step of your infographic slide will make it easier for your audience to grasp the content at a glance.
- Insert Icons: Go to the Insert tab and click on Icons.
- Select Appropriate Icons: Choose icons that match the content or theme of each step. For example, a gear icon for process steps or a lightbulb for ideas.
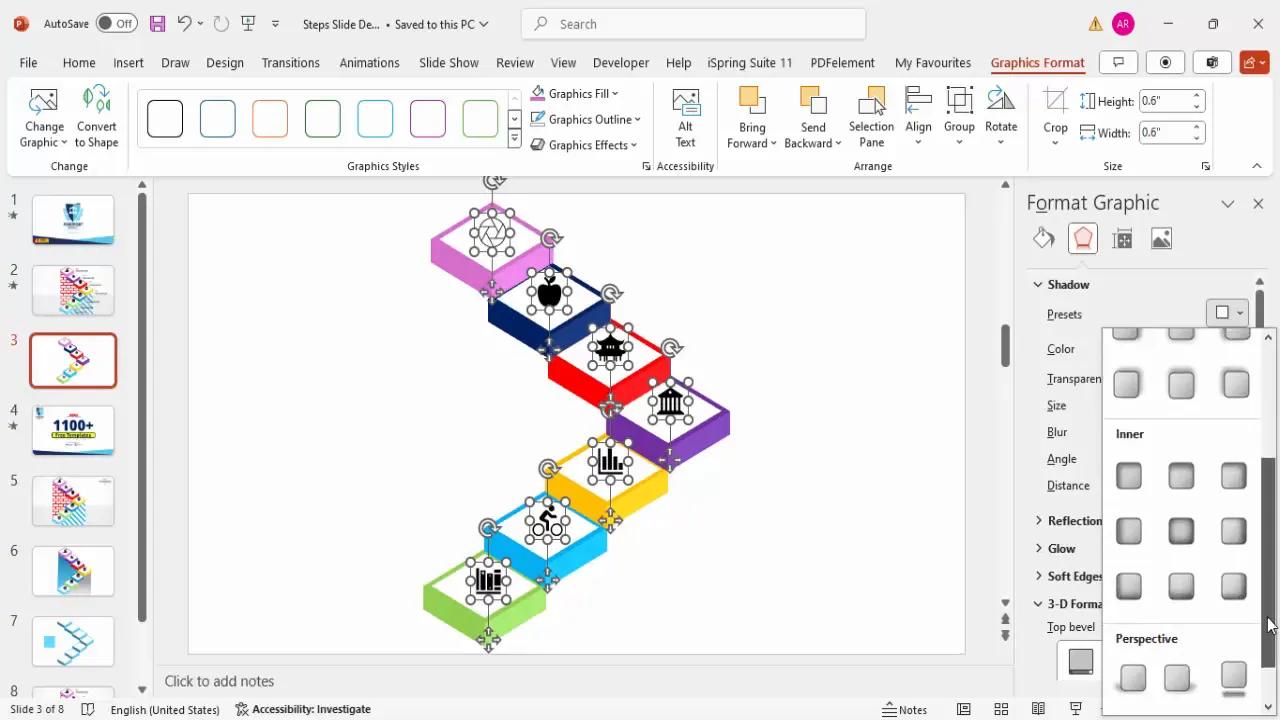
- Adjust Icon Size: Set the height of each icon to approximately 0.6 inches to fit neatly on top of each colored block.
- Position Icons: Align each icon centrally on its corresponding block.
- Add Shadow Effects: To add dimension, select each icon, go to Effects > Shadow, and choose a subtle shadow like Perspective Upper Left. Adjust distance and transparency for a refined look.
Choosing icons thoughtfully ensures your infographic is not only attractive but also meaningful and easy to understand.
Inserting Titles and Detail Text
To provide context and explanation for each step, adding clear titles and concise detail text is essential. Here’s how to do it effectively:
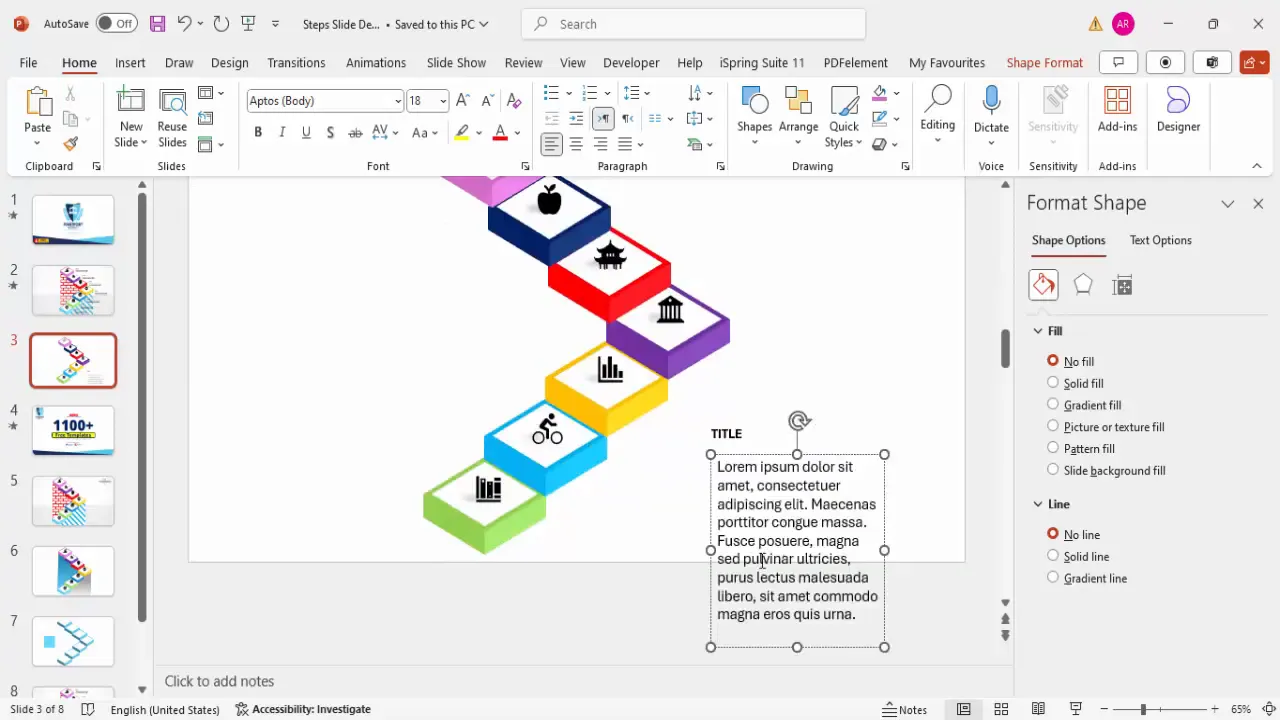
- Add Title Text Boxes: Insert a text box above or next to each 3D block. Use a bold font style with a size around 16 pt for visibility.
- Insert Detail Text: Below each title, add another text box with smaller font size (around 12 pt) to provide a brief description or explanation.
- Use Placeholder Text: You can start with placeholder text like “Lorem ipsum” and replace it with your actual content later.
- Align Text Properly: Ensure text boxes are aligned consistently across all steps for a clean, professional look.
- Group Elements: Once each step’s shapes, icons, and text are in place, group them together (Ctrl + G) for easier management and duplication.
- Duplicate for Remaining Steps: Use the grouped first step as a template, duplicate it, and update titles, icons, colors, and texts accordingly for steps two through seven.
Consistency in typography and spacing helps maintain a polished appearance and improves readability.
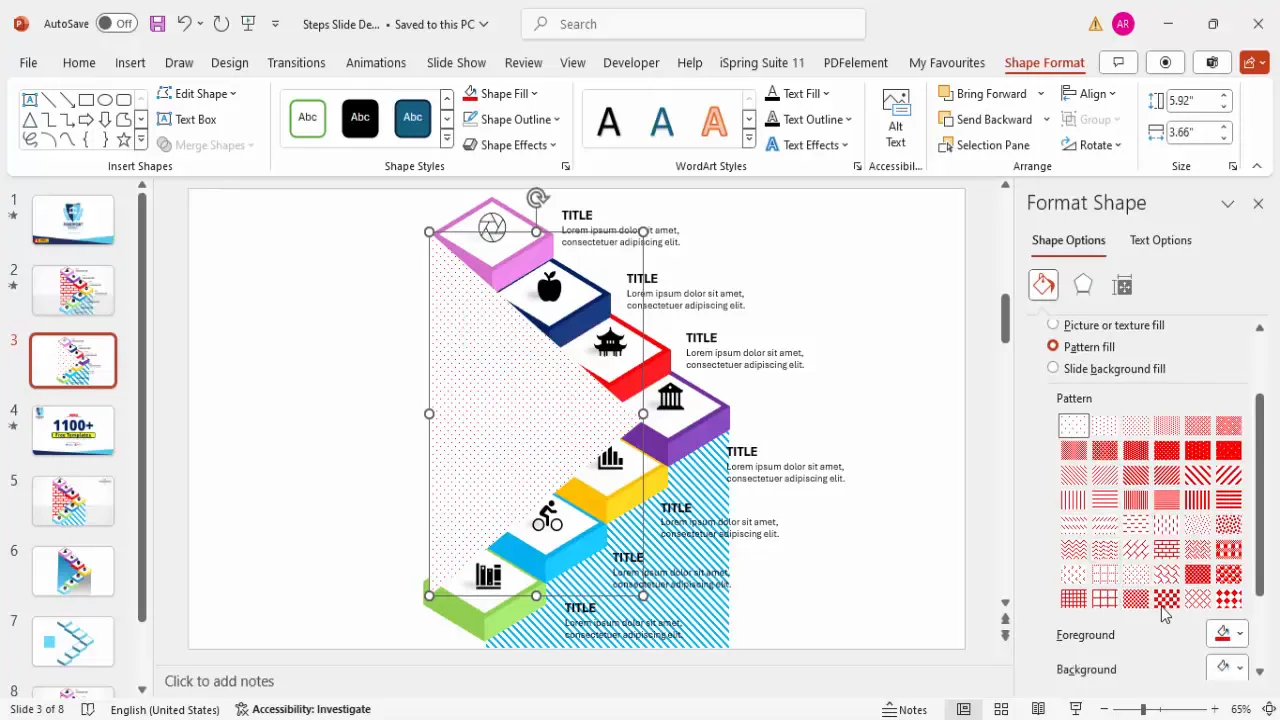
Design Enhancements with Shapes and Patterns
To add subtle yet effective design details, incorporating additional shapes and patterns can enhance the overall infographic without overwhelming the content. Here’s how:
- Insert Freeform Shapes: Use the Freeform Shape tool under Insert > Shapes > Lines to draw custom shapes that complement your infographic layout.
- Draw Straight Lines: Hold the Shift key while drawing to create perfectly straight lines for a clean design.
- Customize Shape Fill: Choose solid colors or pattern fills to add texture. For example, a brick pattern fill in red can provide a subtle background effect.
- Remove Shape Outline: Set the shape outline to No Outline to avoid distracting borders.
- Send Shapes to Back: Arrange these decorative shapes behind your main infographic elements to keep the focus on your content.
These enhancements add visual interest and depth, making your slide stand out while maintaining clarity.
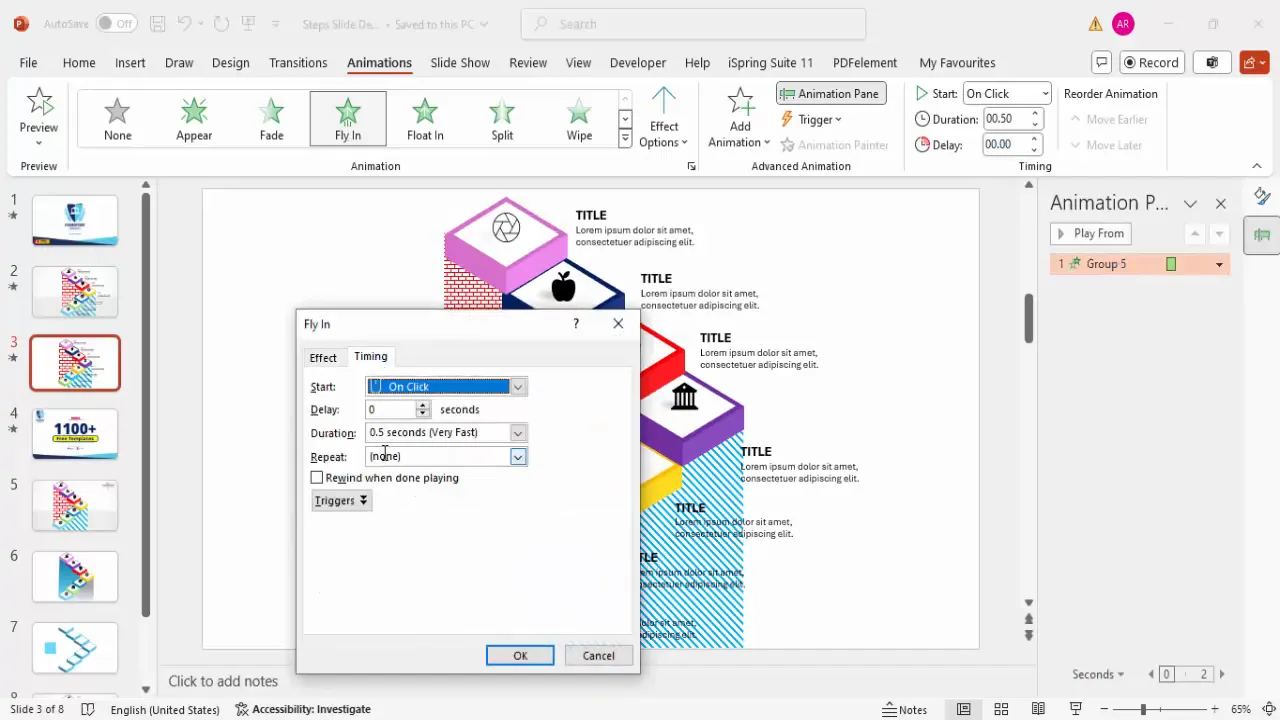
Applying Animations for Dynamic Presentation
Animations bring your infographic to life during your presentation, guiding your audience’s attention step-by-step. Here’s how to apply smooth and professional animations:

- Enable Animation Pane: Go to the Animations tab and open the Animation Pane for detailed control.
- Animate the 3D Blocks: Select the first 3D block and apply a Fly In animation. Adjust the timing to be fast (around 0.3 seconds) for a snappy effect.
- Animate Icons: For each icon, use More Entrance Effects and select Peek In. Set these to occur After Previous for smooth sequencing.
- Animate Text: Add a Stretch animation for the text, with the effect coming from the left. Set this to happen With Previous to synchronize with the icon animation.
- Use Animation Painter: To save time, use the Animation Painter tool to copy animations from one set of elements (block, icon, text) to the others. This ensures consistency in animation style and timing.
- Test the Animation Sequence: Play the animation pane to preview how each step appears in order, ensuring a smooth and engaging flow.
Animations should enhance your presentation, not distract. Keep them subtle and purposeful.
Frequently Asked Questions
How can I make sure my 3D infographic slide looks professional and clean?
Focus on consistent sizing, alignment, and spacing of all elements. Use complementary color schemes and avoid overcrowding. Group related elements and use clean fonts with appropriate sizes for readability.
Can I customize the color palette for my infographic slide?
Absolutely! Choose colors that align with your brand or presentation theme. Use tools like Adobe Color or Coolors to create accessible and harmonious palettes.
What types of icons work best for infographic slides?
Select icons that clearly represent the step or idea you’re illustrating. Avoid overly complex or abstract icons. Simplicity and clarity are key to effective communication.
Is it necessary to add animations to infographic slides?
While not mandatory, animations help guide viewers’ attention and make your presentation more engaging. Use subtle animations to enhance understanding without overwhelming the audience.
How can I ensure my PowerPoint slide design is accessible?
Use high-contrast color combinations, readable fonts, and avoid relying solely on color to convey information. Add descriptive alt text to images and icons, and keep text concise and clear.
Can I reuse this 7-step infographic slide in other presentations?
Yes! By grouping elements and duplicating slides, you can easily adapt this infographic for different topics or presentations. Just update text, icons, and colors as needed.
Conclusion
Mastering PowerPoint Slide Design with creative infographic slides like this seven-step colorful 3D layout can significantly boost your presentation’s effectiveness. By combining clean shapes, vibrant colors, meaningful icons, concise text, thoughtful design enhancements, and smooth animations, you can create slides that not only convey complex information clearly but also captivate your audience.
Remember, the key to great slide design lies in balancing aesthetics with functionality. This tutorial equips you with practical techniques to build professional, creative slides that stand out in any corporate, educational, or business setting.
Experiment with these steps, customize them to your needs, and watch your presentations transform into memorable storytelling tools.
For more free PowerPoint templates and creative design tutorials, explore resources from PowerPoint University and keep honing your presentation skills.
Check out the full video: 7-Step Colorful 3D Infographic Slide Design | PowerPoint Tutorial for Creative Presentations


