
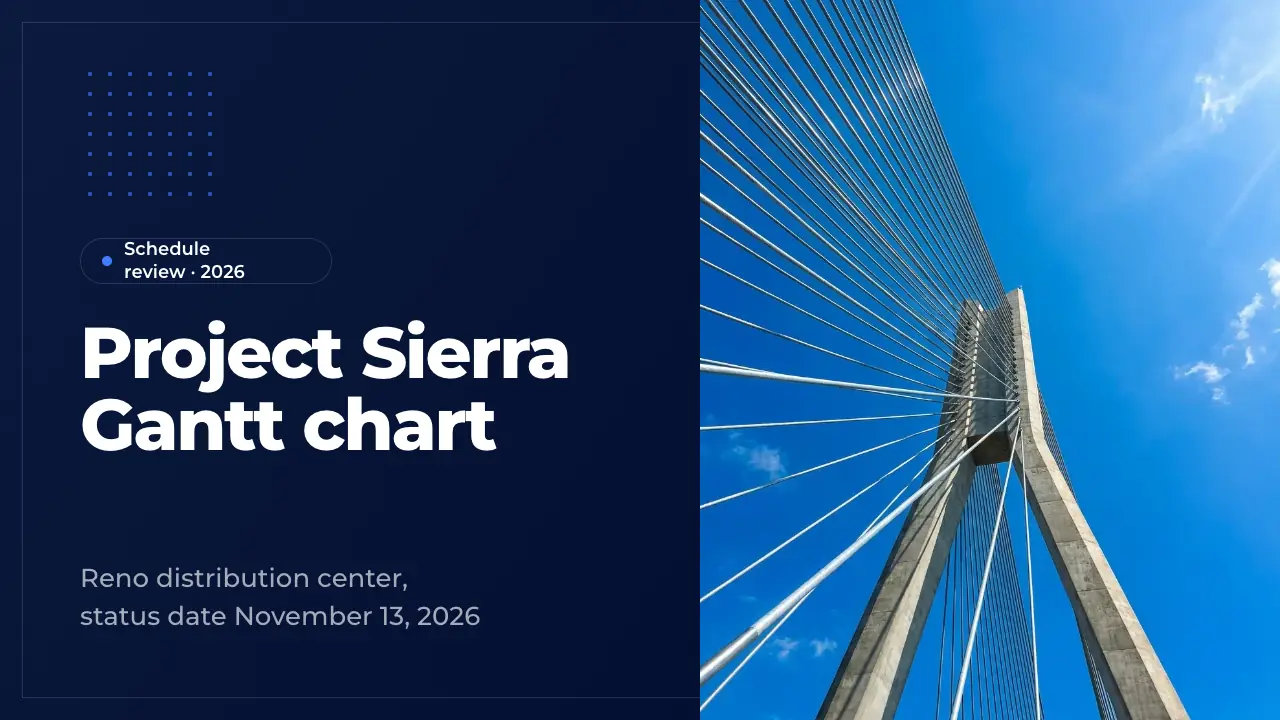
Template · Gantt Chart
Gantt chart PPT: a 50-slide schedule deck, written out and ready to edit
A full 50-slide Gantt chart deck: the anatomy of a Gantt chart, how to build one, the master schedule, milestones, dependencies, the critical path and float, resources, baseline against actual, slippage, recovery options and reporting. Fill it by AI, download it as PowerPoint, or edit every slide.
- 50 slides
- 16:9
- PowerPoint
Most Gantt chart decks are one crowded bar chart. This Gantt chart PPT template is a complete 50-slide schedule review, written for one realistic project: Calder Freight Systems building a $86.4M automated distribution center in 82 weeks. It explains how a Gantt chart works, then shows the master schedule, dependencies, the critical path, resource loading, baseline against actual, a 15-day steel slip and the plan that wins 10 days back.
Use it as the Gantt chart PPT for your own project review: replace the phases, dates, crews and figures, drop the teaching chapter if your audience knows the method, or let the AI write your schedule into all 50 slides at once. Every slide stays editable, in the colours and fonts you choose.
A Gantt chart PowerPoint deck with critical path, baseline and recovery
Title, agenda and an introduction; the anatomy of a Gantt chart, Gantt against Kanban, use cases, six build steps, a glossary and schedule rules; scope, key numbers, the work breakdown structure, the master Gantt chart, milestones, the site and the schedule owners; dependency types, the critical path, critical tasks, float, a sponsor quote and a health check; resources, a histogram, a look-ahead, KPIs, planned against actual and status; the slip, its root cause, risks, recovery options, actions, lessons, reporting levels, the update cycle, roadmap, targets, FAQ and closing.
How to use this Gantt chart template
Open it
Open the Gantt chart PPT in the editor with a free account. All 50 slides load with their text, charts and tables, ready to change.
Fill it with your schedule
Type your project's phases, dates and status into Fill with AI, or attach your schedule export or status report. The AI writes your schedule into these slides.
Make it yours
Pick your colours and fonts in the bar above the slides or apply your own Design Kit. Delete the chapters you do not need and reorder the rest.
Present or export
Present in the browser, export a PDF on every plan, or download the deck as PowerPoint on Pro and Business to keep working in PowerPoint.
What each part of a Gantt chart deck is for
The first chapter teaches the method, so a mixed audience reads the chart the same way. It names the six parts of a Gantt chart, from task bars and milestones to the baseline bar and the status-date line, sets the Gantt chart against a Kanban board, shows when a Gantt chart is the right tool, walks through six steps to build one, defines float, lag, baseline and SPI, and gives the rules that make a schedule trustworthy.
The middle chapters show one schedule in depth. Scope, four key numbers, the work breakdown structure, the master Gantt chart and six milestones set the frame. Then the four dependency types, the critical path link by link, a table of critical tasks with their float and a chart of float across all 214 tasks show where the date is decided. The resource chapter adds crews by role, a monthly histogram with a leveled peak, the three-week look-ahead, a KPI dashboard and planned against actual progress.
The last chapters handle what every real schedule meets: slippage. Baseline and forecast milestone dates, the root cause of the delay in days, four risks with their mitigation, recovery options compared by days and cost, the pros and cons of crashing, the actions with owners and dates and the lessons learned show how a slip is reported honestly. Reporting levels, the weekly update cycle, the roadmap, targets and a float-and-risk matrix close the deck.
How to adapt it to your project
Start with the facts that will be checked: the baseline dates, the status date, percent complete and the critical path. Put your phases, milestones and critical tasks in first, then make the KPI dashboard, the progress chart and the status report agree with them. A software rollout swaps steel and racking for build, test and cutover; an event or a product launch keeps the same chapters with its own tasks and dates.
Present the short version and keep the rest as an appendix. Fifteen slides carry a 30-minute steering committee review; the glossary, the health check and the weekly update cycle go to the project team as their reference. Keep one rule from the deck in every version: report against the approved baseline. A slip that is shown with its cause, its cost in days and a recovery plan builds more trust than a chart that always looks on time.
Questions about the template
Is this Gantt chart PPT template free?
Yes. You can open, edit, fill and present the whole deck with a free account and no credit card. On the Free plan a PDF export carries the ExpertSlides mark; downloading the PowerPoint file needs Pro or Business.
Can I download it as a Gantt chart PowerPoint template, free?
Editing and presenting are free, and every plan exports PDF. The PowerPoint download is part of Pro and Business, and the file opens in PowerPoint with editable text, tables and native charts.
What slides does a Gantt chart PPT need?
A schedule review needs the master Gantt chart, the key milestones, the critical path with its float, resources, baseline against actual and the status. When a project has slipped, add the root cause, recovery options and actions with owners. This deck holds all of them, plus a chapter that teaches how to read and build a Gantt chart.
How long should a schedule review be?
A steering committee review usually runs 30 to 40 minutes on 12 to 20 slides. Keep the method chapter and the detailed tables as an appendix, and lead with the status, the critical path and the decisions you need.
What do sponsors look for in a Gantt chart?
They look for the end date, the milestones that carry it, how much float is left and whether progress matches the baseline. They also want to see a slip reported against the original baseline, with its cause and a costed recovery plan, rather than a schedule that was quietly rebaselined.
Can the AI make a Gantt chart deck for my own project?
Yes. Describe your project or attach your schedule, status report or project plan, and Fill with AI writes your phases, milestones, critical path and figures into these 50 slides. It takes what you give it and does not invent numbers.
Try ExpertSlides AI for free — the ultimate AI presentation maker
Describe any topic or upload a document, and ExpertSlides designs and writes the whole deck — editable in the browser and as a PowerPoint file.
Use the Gantt chart template
A free account, no credit card. The deck opens in the editor, every slide editable.