
Expert Slides
AI Presentation MakerDesign TemplatesPricingSolutionsDesign Kits
Log inGet started freeMy ProjectsGet free credits
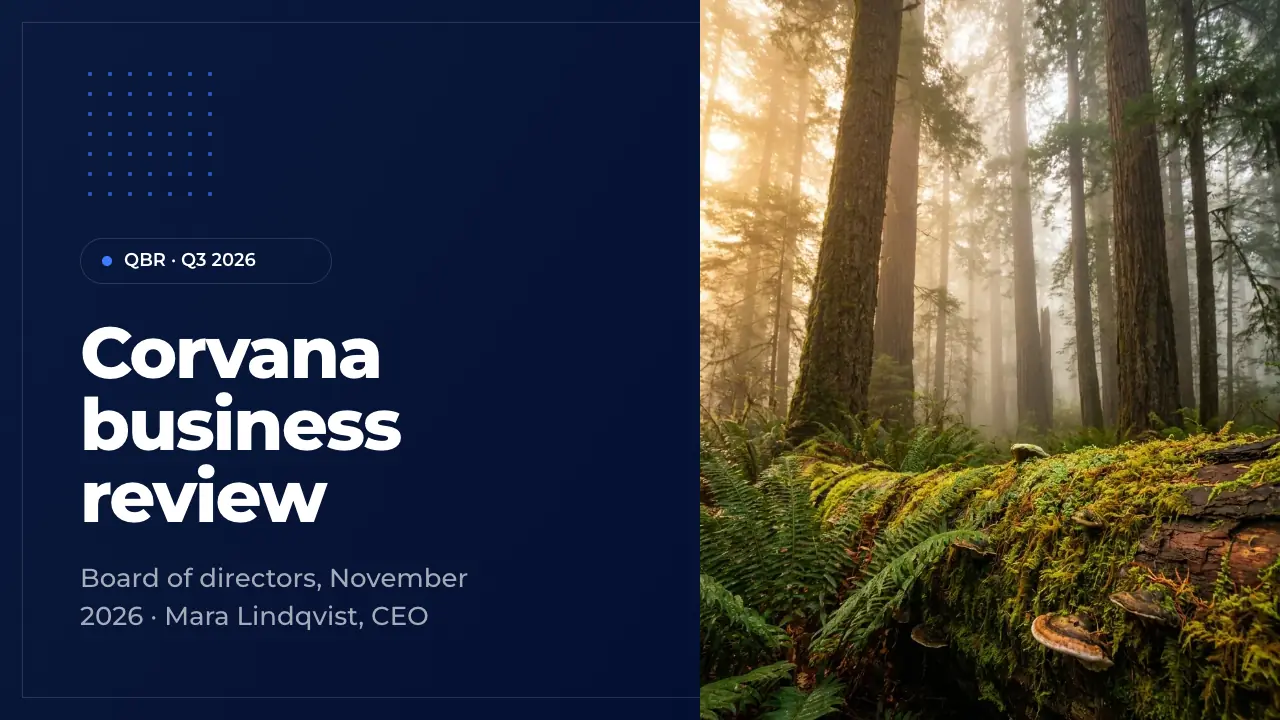
Title slide of Corvana's Q3 2026 quarterly business review with a photo of a distribution center aisle
1 / 50

Template · Quarterly Business Review

QBR template: a complete 50-slide quarterly business review, ready to edit

A complete 50-slide quarterly business review: results against plan, KPIs, wins and misses, customers and retention, pipeline, operations, people, financials, risks, the plan for next quarter and the asks. Fill it by AI, download it as PowerPoint or edit it slide by slide.

  • 50 slides
  • 16:9
  • PowerPoint
Edit slides 1:1 in editor

Most QBR decks are a scorecard and a list of next steps. This QBR template is a complete quarterly business review of 50 slides, written for a made-up SaaS company, Corvana, reviewing Q3 2026 with its board: $48.6M ARR, net new ARR at 90 % of plan, a retention gap, a Q4 to win and three decisions to ask for. Every slide is filled in the way a leadership team would present it.

Use it for your own quarter: replace Corvana's figures with yours, drop the chapters you do not need, or let the AI write your business into all 50 slides at once. It works for a board review, a leadership QBR or a review with a key account, and every slide stays editable and on brand.

Your quarter, in these 50 slides

Describe your quarter or attach your board pack and KPI sheet. ExpertSlides writes your results, pipeline and plan into this deck in minutes, and the layouts stay.

The 50 slides of the Corvana Q3 review

Corvana, a warehouse workforce software company, reviews Q3 2026 with its board: $48.6M ARR, a $0.5M miss on net new ARR, a Q4 to win and three decisions.

  1. 1 · TitleThe opening slide of the quarterly business review: company, quarter, audience and presenter. Use it to set the frame before the agenda. Change the quarter and the presenter's name for each review.
  2. 2 · AgendaThe five chapters of the review in the order they are presented. Use it right after the title so the board knows when the decisions come. Keep one line per chapter.
  3. 3 · Executive summaryThe whole quarter on one slide: three headline figures and one line on what follows. Use it for readers who see only this page. Pick the figures the board measures you by.
  4. 4 · Highlights and lowlightsThe quarter against plan as three highlights and three lowlights, each marked. Use it early in a business review to show you name the misses as plainly as the wins. Give each point its figure against plan.
  5. 5 · Chapter: Q3 resultsSection divider that opens the chapter on the quarter's results. Use it before the headline figures, the scorecard and the root causes. Keep the title to the chapter's name.
  6. 6 · Key numbersThe four figures that define the quarter, each with what it measures. Use it to open the results chapter. Choose the figures the board tracks every quarter so they compare.
  7. 7 · ARR by quarterEnding ARR over the last five quarters as a bar chart with one paragraph of reading. Use it to show the growth trend behind the quarter. Always state the plan beside the actual.
  8. 8 · Q3 scorecardThe quarter's key metrics in a table of plan, actual and variance. Use it as the reference the rest of the review explains. Keep the same rows every quarter so trends are visible.
  9. 9 · Wins and missesThe quarter's wins and misses side by side, four each. Use it to give the board an honest balance before the details. Put a figure into every point.
  10. 10 · Root causeA miss traced from the symptom through its causes to the root cause. Use it when the board asks why a target was missed. End on the cause you can act on.
  11. 11 · Q3 milestonesThe quarter's milestones in date order on one rail. Use it to show what actually happened between the figures. Give each milestone its date and one fact.
  12. 12 · Lessons learnedThree lessons the quarter taught, each with the fact behind it. Use it after the results to show the team learns from misses as well as wins. Name what you change because of each lesson in the notes.
  13. 13 · Chapter: CustomersSection divider that opens the chapter on customers and retention. Use it before the customer base, the case, the quote and the retention trend. Keep the line to what the chapter answers.
  14. 14 · Customer segmentsThe customer base split into its segments with count and ARR. Use it to show where revenue concentrates. Keep the segment thresholds you report by.
  15. 15 · Case study BrennickOne customer's win as proof: three result figures and the customer's own words. Use it to show the board why the largest deal of the quarter closed. Pick a case with figures the customer confirms.
  16. 16 · Customer quoteOne customer's words on what the product changed for them. Use it to let a customer speak between the figures. Choose a quote with one concrete outcome in it.
  17. 17 · Retention trendNet revenue retention over five quarters as a line, with the gross retention story beside it. Use it to separate expansion from losses. Show both figures on a trailing twelve-month basis.
  18. 18 · Account health matrixThe largest accounts placed in four fields by health and expansion potential, each field with its play. Use it to show the board how account management is steered. Count the accounts and ARR in each field.
  19. 19 · Advisory boardWhat the customer advisory board asked for, beside a picture of the meeting. Use it to show that the roadmap follows customers. List the top requests in the customers' words.
  20. 20 · Chapter: PipelineSection divider that opens the chapter on pipeline and growth. Use it before the funnel, the win rate and the go-to-market. Keep the line to what the chapter covers.
  21. 21 · Sales funnelThe quarter's funnel from marketing-qualified lead to won deal, with the rate from each stage to the next. Use it to show where deals are lost. Define each stage the way your CRM counts it.
  22. 22 · Win rate trendThe win rate quarter by quarter as an area chart with three reasons for its change. Use it to show the sales engine is getting more efficient. Keep the definition of win rate the same in every quarter.
  23. 23 · Demand generationMarketing's quarter in four figures and the sources of its leads. Use it to show that demand is not the bottleneck. Compare each figure with the last quarter or the plan.
  24. 24 · Go-to-market movesThe changes to how the company sells this quarter, with the one figure that proves them. Use it to show what was changed in the sales motion and what it brought. Name each move with its result.
  25. 25 · Channel partnersThe partners signed this quarter, each with its role and what it brought. Use it to show a new channel and its first results. Give each partner a figure, not only its logo.
  26. 26 · Shiftline ForecastThe quarter's product launch with what it does and its first commercial results. Use it to tie product work to revenue. Give the launch date and the share of deals it is in.
  27. 27 · Unit economicsWhat a new customer costs and returns in four figures. Use it to show that growth is bought efficiently. State the ACV and margin the figures rest on.
  28. 28 · Win and lossWin rates against each rival with the reason behind each result. Use it to show where the product wins and where price hurts. Count decided deals only.
  29. 29 · 2027 pricingA proposed price model with its tiers and the effect it is expected to have. Use it when a pricing decision is on the board's table. Show the modelled revenue effect next to the prices.
  30. 30 · Chapter: OperationsSection divider that opens the chapter on operations, people and financials. Use it before the operating metrics, the headcount and the profit and loss. Keep the line to the chapter's three topics.
  31. 31 · Operations dashboardThe operating metrics of the quarter against the quarter before, with the change. Use it to show the platform and service are in control. Keep the same five metrics every quarter.
  32. 32 · Initiative statusThe progress of the strategic initiatives as bars. Use it to show which bets are on track and which are late. Say in the notes what holds back the shortest bars.
  33. 33 · Implementation processHow a new customer is implemented, step by step with its days. Use it to show what changed in delivery and why customers go live faster. Give each step its time box.
  34. 34 · Headcount by teamHeadcount by function as bars at the end of the quarter. Use it to show where the people are. Compare the total with the plan in the notes.
  35. 35 · Open rolesThe open roles by function, with where they sit and how many. Use it to show where the hiring gap is and what it holds back. Pair it with hires against plan in the notes.
  36. 36 · Leadership teamThe leadership team with names and roles beside a group photo. Use it to show who owns which part of the business and the Q4 priorities. Keep roles short and official.
  37. 37 · Revenue by quarterRevenue over five quarters as bars, with the margin trend in one line. Use it to show that growth comes with better margins. Give gross and EBITDA margin for the first and last quarter.
  38. 38 · Opex by functionOperating expenses by function against plan, with the total. Use it to show where spending differed from the budget. Explain the largest variance in the notes.
  39. 39 · Cash and runwayThe cash position in four figures. Use it to show that the company is funded through its plan. Explain any seasonal effect on burn in the notes.
  40. 40 · Chapter: OutlookSection divider that opens the outlook chapter. Use it before the risks, the targets, the roadmap and the asks. Keep the line to what the board will decide.
  41. 41 · Top risksThe top risks to the plan, each with likelihood, impact and the answer to it. Use it before the targets so the board sees what could break them. Name an owner for each answer in the notes.
  42. 42 · SWOTStrengths, weaknesses, opportunities and threats on one slide. Use it to frame the strategy that follows. Back every point with a figure or a name.
  43. 43 · 2027 strategyThe direction for next year in one statement and three priorities. Use it to connect the targets to choices. Keep it to the few moves that matter most.
  44. 44 · TargetsThe targets for the coming quarter and year, each with today's value and its date. Use it to state what the board will measure you by next time. Keep each target to one number.
  45. 45 · 2027 roadmapThe coming year in four quarters, each with a theme and three items. Use it to show when the strategy turns into delivery. Put the commercial milestones beside the product ones.
  46. 46 · Q4 action planThe actions for the rest of the quarter, each with what it changes, an owner and a date. Use it so the board can check progress at the next review. Keep to actions with a single owner.
  47. 47 · The asksThe decisions the board is asked to make, each with its amount or scope. Use it at the end of a business review so the meeting ends with clear choices. Ask for decisions, not for feedback.
  48. 48 · Expected questionsThe questions the board is likely to ask, with short answers. Use it before the close to address doubts on the asks. Answer each with a fact.
  49. 49 · Key takeawaysThe review's message in one sentence and three figures. Use it before the close so the board leaves with the same story. Choose one figure for growth, one for the problem, one for the outlook.
  50. 50 · ClosingThe close of the review with the next steps and dates. Use it to end on what happens after the meeting. Name the next date the board hears from you.

What this quarterly business review PPT template holds

Title, agenda, an executive summary and highlights against lowlights; key numbers, an ARR chart, a plan-against-actual scorecard, wins and misses, a root cause, milestones and lessons; customer segments, a case study, a quote, retention, an account health matrix and advisory board feedback; funnel, win rate, demand, go-to-market, partners, product, unit economics, win and loss and pricing; operations, initiatives, process, headcount, hiring, team, revenue, opex and cash; risks, SWOT, strategy, targets, roadmap, actions, asks, FAQ, takeaways and a close.

How to use this QBR template

  1. 01

    Open it

    Open the QBR template in the editor with a free account, no credit card needed. All 50 slides arrive editable, in the blue Originals look.

  2. 02

    Fill it with your quarter

    Press Fill with AI and describe your quarter, or attach your board pack or KPI sheet. The AI writes your results, pipeline and plan into these layouts.

  3. 03

    Check the figures

    Make sure every figure agrees with your plan and your books, drop the chapters your audience does not need and add your own charts.

  4. 04

    Present or export

    Present in the browser, export a PDF on any plan, or download PowerPoint on Pro and Business to present in your board room.

What each chapter of a quarterly business review is for

The opening gives the room the whole quarter before any detail. The agenda shows when the decisions come, the executive summary puts the quarter on one page, and the highlights and lowlights slide names the misses as plainly as the wins. The first chapter then sets results against plan: four headline figures, ARR by quarter, a scorecard of plan, actual and variance, the wins and misses side by side, a root-cause slide for the largest miss, the quarter's milestones and the lessons the team takes from it.

The customer chapter shows who pays and whether they stay. It splits the base into segments with their ARR, proves the value with one case and one quote, tracks net and gross retention over five quarters and places the top accounts on a health matrix with a play for each field. The pipeline chapter follows: the funnel from lead to win, the win rate trend, demand generation, the go-to-market changes, new partners, the product launch, unit economics, win and loss by competitor and a pricing proposal.

The operations chapter covers how the business runs: an operations dashboard quarter on quarter, the status of strategic initiatives, the implementation process, headcount by team, open roles, the leadership team, revenue by quarter, opex by function against plan and cash with runway. The outlook closes the review: the top risks with their answers, a SWOT, the strategy for next year, targets with dates, a four-quarter roadmap, the actions with owners, the decisions asked for, the questions the room will ask and the takeaways.

How to make a business review the board acts on

Lead with the plan, not with activity. Every figure in this deck stands beside the target it was measured against, and each miss has its cause and its fix on the next slide. Keep the same scorecard rows every quarter so trends are visible, separate net from gross retention so expansion cannot hide churn, and show pipeline coverage for the coming quarter. A good review ends with decisions, so the asks are specific: an amount, a headcount, a date.

Use the chapters that fit your audience. A board wants the scorecard, cash, risks and the asks; a leadership QBR goes deeper into pipeline and operations; a review with a key account replaces the financials with its usage, outcomes and the next quarter's plan together. Send the deck two days ahead, so the meeting is spent on the decisions.

Questions about the template

Is this QBR template free?

Yes. You can open, edit, fill with AI and present all 50 slides with a free account, no credit card needed. Every plan exports PDF; on Free the PDF carries the ExpertSlides mark, and PowerPoint download comes with Pro and Business.

What slides does a QBR deck need?

At least an executive summary, results against plan, the KPIs that matter, wins and misses with their causes, customers and retention, pipeline for the next quarter, financials, risks and the asks. This deck holds all of them in five chapters, plus the slides a board often asks for, such as cash, headcount and a roadmap.

How long should a business review presentation for the quarter be?

For a board, plan on 60 to 90 minutes with 20 to 30 slides on screen and the rest in the appendix. For a leadership team or a key account, 30 to 45 minutes is usual. The 50 slides here let you choose what to present and what to keep for questions.

What does a board look for in a quarterly business review?

Honest results against plan, the reasons behind the misses, whether the next quarter is covered by pipeline, cash and runway, and clear decisions to take. Boards trust a review that names its weak figures, such as gross retention here, and shows what is done about them.

Can I download it as PowerPoint?

Yes, on Pro and Business you download the deck as an editable PowerPoint file with native charts and tables. On every plan you can export a PDF or present it straight from the browser.

Can the AI make a QBR for my own company or client?

Yes. Press Fill with AI and type your quarter's results, or attach your board pack, KPI export or account report. The AI writes your figures and story into these 50 layouts; check each number against your own sources before you present.

Try ExpertSlides AI for free — the ultimate AI presentation maker

Describe any topic or upload a document, and ExpertSlides designs and writes the whole deck — editable in the browser and as a PowerPoint file.

Try it for free

Use the quarterly business review template

A free account, no credit card. The deck opens in the editor, every slide editable.

Use this templateMore presentation designs
Expert Slides
AI presentation maker: type a topic, pick a style, get a finished deck in 60 seconds.
Product
AI Presentation MakerDesign TemplatesPricingSolutionsPowerPoint & Google Slides Add-insPowerPoint TemplatesPresentation TemplatesProject Management TemplateFree PowerPoint Templates
Company
Help CenterGuidesContact
Legal
PrivacyTermsLicensingImprint
© 2026 ExpertSlides · ES Solutions GmbH