Research presentation template: 50 slides from question to findings
A 50-slide research presentation for a made-up evaluation of nurse-led follow-up after hospital discharge: question, mixed-methods design, 2,412 matched patients, a 28 % drop in readmissions, costs, limits and a rollout plan.
This research presentation template takes one applied study all the way through: the research question and why it matters, aims and hypotheses, design, sample, analysis, findings with charts and tables, interviews, costs, limitations and the next steps. Every slide is written out for a realistic health-services study, so you see what a strong slide says before you put your own data in.
Use it as a research presentation template for PowerPoint, present it in the browser or let the AI fill it with your study. Results are reported the way reviewers expect: effect sizes with confidence intervals, an enrollment flow, baseline balance and an honest page of limitations.
Your study, in these 50 slides
Describe your research or attach your report, protocol or results tables. ExpertSlides writes your question, method and findings into this deck in minutes, the layouts stay, nothing is made up.
The 50 slides of the research presentation
The Larkspur Institute presents the HomeStep study: nurse-led follow-up for 1,206 older patients cut 30-day readmissions from 19.7 % to 14.2 %. Replace it with your study.
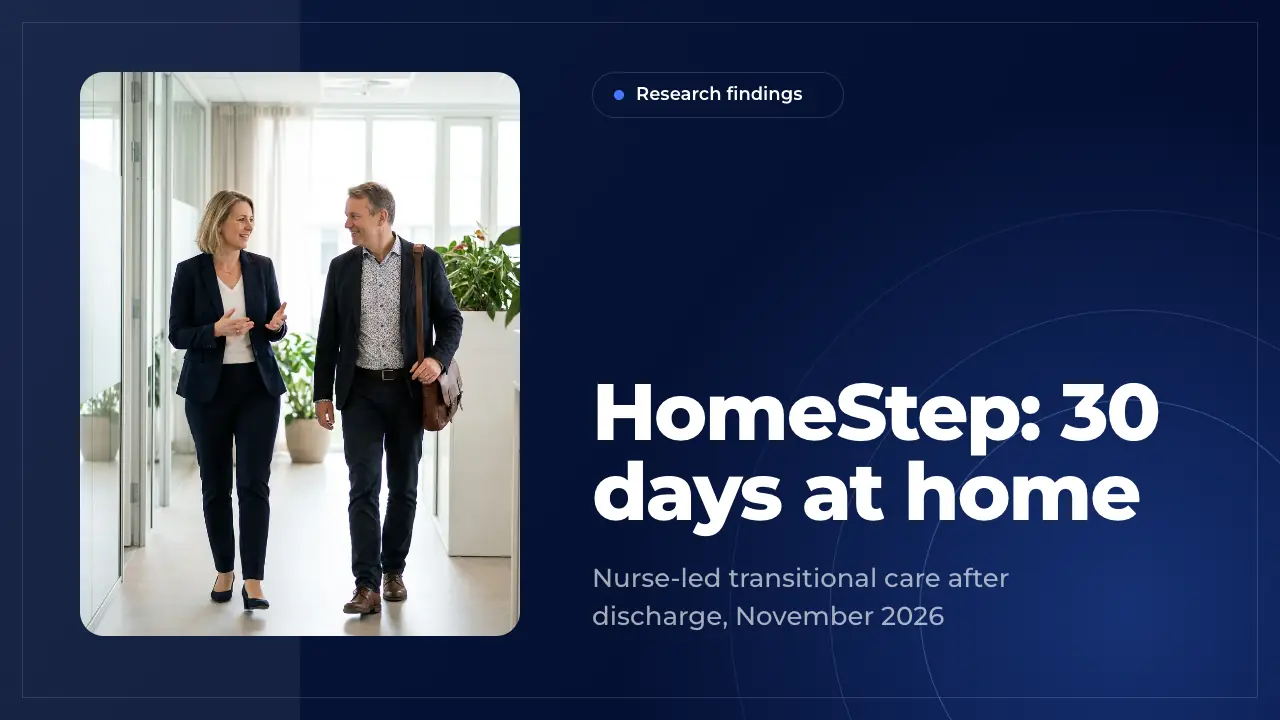
1 · Title slideThe opening slide of a research findings presentation: the study's name, a short subtitle and a calm photo of the setting. Use it to name the study, the field and the date of the presentation.
2 · AgendaA six-part agenda that follows the classic order of a research presentation. Use it right after the title so the audience knows where the findings and the recommendations come.
3 · Executive summaryThe whole study on one slide: the situation, what was tested and the result. Use it early for a board that may only remember one slide, and keep each part to one figure.
4 · Chapter: The questionA section divider that opens the background chapter of the study. Use it to separate the problem and the research question from the methods that follow.
5 · IntroductionSets the scene for the study in three short points. Use it to explain why the research question exists before you state it, with one fact behind each point.
6 · Baseline figuresFour key numbers that size the problem before the study. Use it to show the baseline your findings will be measured against, with the year the figures come from.
7 · The care gapNames the problem the study addresses and the intervention it tested. Use it to connect the background to the research question in two plain statements.
8 · Why nowThree trends that make the research question urgent. Use it to show decision makers why the study's answer matters for the coming years, not only for the past.
9 · Research questionThe research question on a slide of its own. Use it to make the one question the study answers unmistakable before you explain the method.
10 · Aims and hypothesesThe study's aims with their hypotheses and measures. Use it to state before the results what counts as success, so the findings can be judged against it.
11 · Chapter: MethodsA section divider that opens the methods chapter. Use it to move from the research question to how the study was designed and run.
12 · Study designThe study design in three steps: the comparison, the interviews and the data sources. Use it to explain the method in one view before the details of the sample and the analysis.
13 · The interventionThe intervention studied, as a sequence of four steps over 30 days. Use it so the audience knows exactly what was tested before seeing whether it worked.
14 · Enrollment flowHow the sample narrowed from screening to analysis, like a CONSORT flow. Use it to show reviewers where patients were lost and why the final sample is credible.
15 · Sample characteristicsBaseline characteristics of the two groups after matching. Use it to show that the comparison is fair before presenting any outcome, with the balance statistic named.
16 · Program vs usual careSets the two arms of the study side by side: what the comparison group received and what the intervention added. Use it so the audience reads every result as the effect of exactly this difference.
17 · Analysis planThe analysis plan in four points, from the primary model to the qualitative coding. Use it to show reviewers that the statistics were planned before the results and fit the design.
18 · Study timelineThe study's milestones in date order, from approval to this presentation. Use it to show how long data collection ran and when the results became available.
19 · Chapter: FindingsA section divider that opens the results chapter. Use it to mark the move from how the study was done to what it found.
20 · Primary resultThe primary outcome in four figures: both rates, the effect size and the number needed to treat. Use it as the one result slide the audience must remember, with the confidence interval in the notes.
21 · Readmissions over 30 daysA line chart of cumulative readmissions by day after discharge, with notes comparing the usual-care group. Use it to show when an effect appears, not only how large it is at the end.
22 · Program deliveryA dashboard of how faithfully the intervention was delivered. Use it next to the outcomes so the audience can judge the effect against the dose patients actually received.
23 · Subgroup resultsA bar chart of the effect by subgroup, with three findings beside it. Use it to show for whom an intervention works best and to guide where a rollout should start.
24 · Secondary outcomesA table of the secondary outcomes with both groups and the difference. Use it to show that the main result is consistent with the other measures, and say plainly which differences are not significant.
25 · Medication discrepanciesA bar chart of what went wrong with medications at home, by type, with three points on the most dangerous patterns. Use it to explain the mechanism behind a result.
26 · Caregiver quoteA quote from a study participant that gives the numbers a human voice. Use it after the quantitative findings to show what a result means for one household.
27 · Interview themesThe qualitative findings as four themes from the interviews. Use it to explain how and for whom an intervention works, next to the figures that show whether it works.
28 · The home visitOne picture and a short text that show the setting of the intervention. Use it to make a finding concrete: what researchers or staff actually saw in the field.
29 · Chapter: ImplicationsA section divider that opens the chapter on interpretation and implications. Use it to move from the findings to what they mean for decisions.
30 · Causes of readmissionThe causes behind the outcome, grouped into four categories with their shares. Use it to explain the mechanism of an effect and which causes an intervention can reach.
31 · Cost per patientThe economics of the intervention per patient: cost, avoided cost, return and net saving. Use it to translate an effect size into money for a budget decision.
32 · Benefits at scaleWhat the study's effect would mean if applied across the whole organisation. Use it to turn a per-patient result into the yearly figures decision makers plan with.
33 · Rollout prioritiesA two-by-two matrix that turns subgroup findings into priorities. Use it to show where an intervention should start and how much of it each group needs.
34 · Lessons learnedWhat went well and what did not in carrying out the study or program. Use it to show an honest account of delivery and what the next phase will change.
35 · Key insightsThe insights to remember from the findings, each with its supporting figure. Use it to close the interpretation chapter before limitations and recommendations.
36 · Chapter: Next stepsA section divider that opens the chapter on limitations and next steps. Use it to move from results to an honest look at their limits and the plan ahead.
37 · Study limitationsThe study's main limitations beside what was done about each. Use it to show reviewers and decision makers that the weaknesses are known and how far they matter.
38 · Reviewer questionsThe critical questions a study is likely to face, each with a short evidence-based answer. Use it to address doubts before they come up in the discussion.
39 · Scale now or waitWhat scaling now gains and what it gives up compared with waiting for more evidence. Use it to make a decision under uncertainty explicit before the recommendation.
40 · Rollout roadmapThe plan ahead in phases, with when and who for each. Use it to show how research findings turn into a staged rollout and further study.
41 · Resources neededThe people, budget and tools a recommendation requires. Use it so decision makers see the full cost of acting on the findings before they approve.
42 · RecommendationsThe study's recommendations as actions with an owner and a date. Use it to turn findings into decisions the audience can assign before the meeting ends.
43 · Chapter: AppendixA section divider that opens the appendix. Use it to separate the main argument from the reference slides that support it.
44 · Research teamThe people behind the study with their portraits and roles. Use it to show who is accountable for the findings and whom to ask about each part.
45 · Study partnersThe organisations that made the study possible and what each contributed. Use it to credit funders and data partners, as research presentations are expected to do.
46 · GlossaryThe technical terms of the study with plain definitions. Use it in the appendix so a mixed audience can follow the methods and results.
47 · Frequently askedThe practical questions an audience asks about a study, each with a one-line answer. Use it at the end to save discussion time for the decision itself.
48 · Sources and dataThe data sources and documents behind every figure in the deck. Use it so readers can trace results to their origin and periods; costs are in 2026 US dollars.
49 · Pause at homeA full-bleed picture with one line that gives the audience a moment before the closing. Use it to remind decision makers who the figures are about.
50 · Closing and askThe closing slide with the one decision asked for and an invitation to questions. Use it to end a research presentation on its recommendation, not only on thanks.
A science research presentation template with method, findings and limits
Title, agenda, executive summary; introduction, baseline figures, the problem, three trends, the research question and the aims; the design, the intervention as a process, the enrollment funnel, a sample table, a comparison of the two groups, the analysis plan and a timeline; the primary result, three charts, a delivery dashboard, secondary outcomes, a quote, interview themes, a photo; root causes, cost per patient, benefits at scale, a priority matrix, lessons and takeaways; limitations, reviewer questions, pros and cons, a roadmap, resources, recommendations, team, partners, glossary, FAQ, sources and closing.
How to use this research presentation template
01
Open it
Press Use this template. The research presentation template is copied into your account, free and without a credit card, and opens in the editor.
02
Put in your study
Replace the HomeStep question, sample, figures and charts with your own, slide by slide. Or ask the AI to rewrite a slide or the whole deck from your report.
03
Fit it to your audience
For a conference or a class keep the methods and findings; for a board keep the summary, costs and recommendations and move the rest to the appendix.
04
Present or export
Present it from the browser or export it. On Pro and Business you download an editable PowerPoint file. Every plan exports PDF; on Free a PDF carries the ExpertSlides mark.
What a research findings presentation needs
A good research presentation answers four questions in order: what did you ask, how did you find out, what did you find and what should happen now. The deck follows that order in six chapters. The opening chapter gives the background, the baseline figures and the research question on a slide of its own, then the aims with their hypotheses, so the audience knows what counts as success before any result appears.
The methods chapter is where credibility is won. It shows the design in three steps, the intervention as a process, the enrollment flow from 3,920 screened patients to 1,206 analysed, a table of baseline characteristics after matching, what each group received and how the data were analysed. Reviewers look for exactly these slides, and an audience of decision makers needs them to trust the numbers that follow. Each of them is short enough to read in seconds and complete enough to survive questions.
The findings chapter leads with the primary result in four figures, then shows when the effect appears on a line chart, how well the program was delivered, the effect by subgroup, the secondary outcomes in a table and what the home visits found. A caregiver's quote, four interview themes and a photo slide give the figures a human side, as mixed-methods research should. Together they let numbers and voices tell one story.
From results to a decision
Applied research is presented to people who must decide something, so the deck does not stop at the results. It explains why the effect happened, turns it into cost per patient and figures at scale, shows where a rollout should start on a matrix, and lists what went well and what did not. The limitations slide, the reviewers' questions and a weighing of scaling now against waiting keep the argument honest.
The last chapters give a roadmap for 2027 and 2028, the resources it needs, recommendations with owners and dates, the team, partners, a glossary, an FAQ and the sources behind every figure. Remove what your audience does not need, or move it to an appendix. A shorter talk keeps the summary, the primary result and the recommendations.
Questions about the template
What slides does a research presentation need?
At least the research question, background, method, sample, findings, limitations and next steps. This research presentation template has all of them in 50 slides, plus aims, an enrollment flow, charts, tables, interview themes, costs and recommendations. Delete the ones your study does not need.
How long should a research findings presentation be?
For a 15-minute conference talk, 12 to 18 slides are usually enough; for a 35-minute briefing with questions, 25 to 35. The full 50 slides suit a final report to a funder or board. Keep the primary result and the limitations whatever you cut.
Can I use it as an AP research presentation template?
Yes. The deck follows the structure an AP Research presentation and oral defense expects: question, literature context, method, findings, limitations and implications. Replace the health study with your own inquiry and shorten it to the time your teacher sets.
Is the template free?
Yes. With a free account you open, edit and present all 50 slides and export a PDF, which carries the ExpertSlides mark on Free. Downloading it as an editable PowerPoint file needs Pro or Business.
Does it work in PowerPoint?
Yes. On Pro and Business you download the deck as an editable PowerPoint file, with native charts and tables you can change in PowerPoint itself. You can also present it straight from the browser.
Can the AI make one for my own study?
Yes. Press Fill with AI, describe your research or attach your report or results tables, and the AI writes your content into these layouts. It uses your figures and does not invent results; slides it has no content for are left out.
Try ExpertSlides AI for free — the ultimate AI presentation maker
Describe any topic or upload a document, and ExpertSlides designs and writes the whole deck — editable in the browser and as a PowerPoint file.