Project Timeline Slides People Can Actually Read
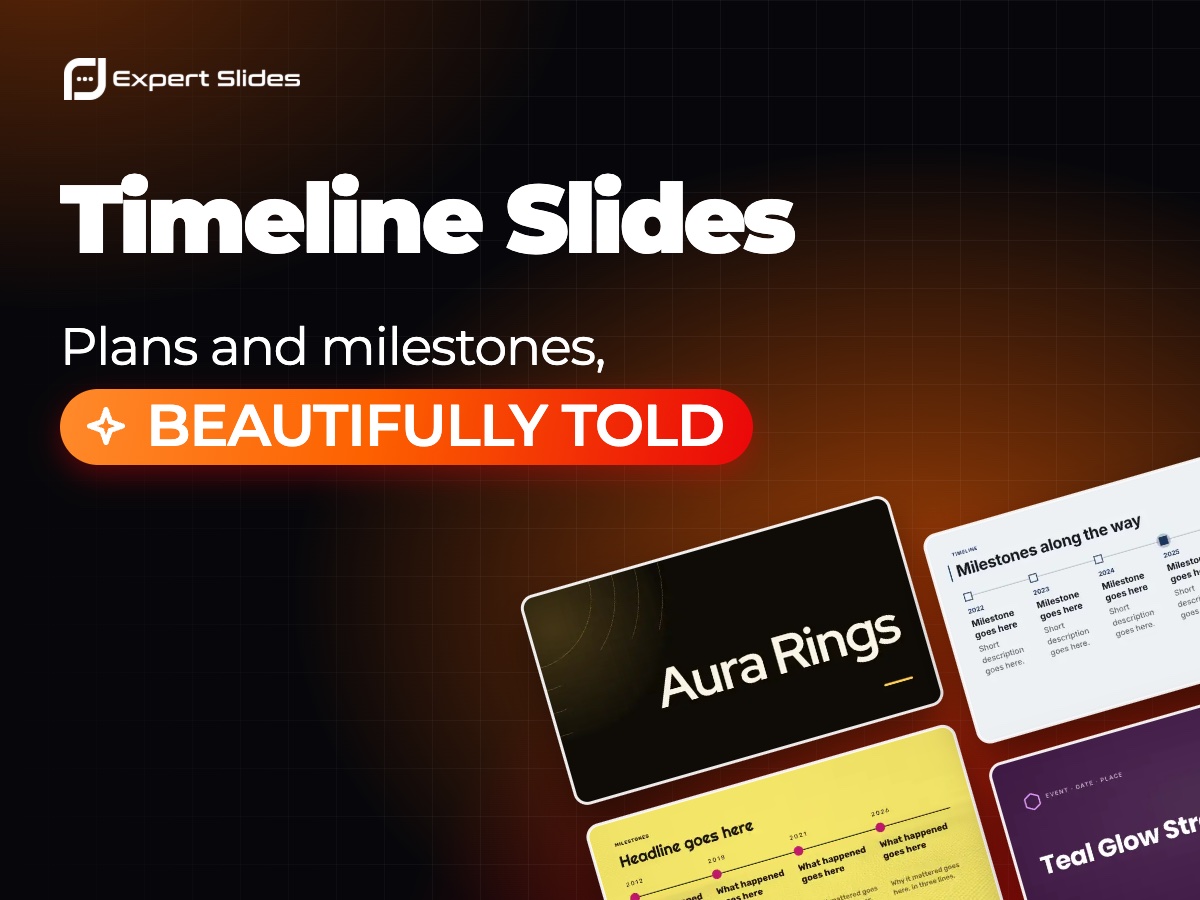
Picture a project plan pasted onto a slide: forty rows, tiny dates, coloured bars that need a magnifying glass. Everyone nods and nobody reads it. A project timeline slide works when it shows fewer things, more clearly.
Milestones, not tasks
Your project tool knows every task. Your audience needs the moments that change something: a decision, a delivery, a launch, a review. Four to seven milestones fit comfortably on one slide. If you have more, split the plan into phases, give each phase its own slide, and put a one-line overview in front.
Each milestone needs a date and a label of two to four words, such as "Pilot starts", "Supplier chosen" or "Go-live". The detail belongs in what you say. Long labels force small text and break the rhythm of the line.
Show where you stand
A marker for today turns a plan into a status report. Combine it with two visual states, for example a filled shape for done and an outline for what lies ahead, and people see progress without reading a word. Then pick the shape that suits your plan:
- Horizontal line for a sequence across months or quarters.
- Vertical list when labels are longer or the screen is narrow.
- Phased blocks when work overlaps, such as design running into build.
- Milestones with pictures for company histories, where each step has a story.
A product launch over a year might read: Q1 research, Q2 pilot with three customers, Q3 public launch, Q4 second market. Four points, one line, and a marker on Q2 if that is where you are. That single slide can open the meeting and be the one you return to at the end.
Building it faster
In ExpertSlides you describe the plan in plain words, with phases and dates, and the AI lays them out on a timeline slide in your chosen design, every label and date still editable. Designs with timeline slides are in the design catalogue, and the guide to timelines in PowerPoint shows how to build and adjust one by hand.